Sun Pharmaceutical Industries Limited: $11.75 Billion Organon Pivot Near New Jersey as 30.0% Operating Margin Signals US Generic De-risking
Date : 2026-07-09
Reading : 164
HDIN Executive Takeaways
1. Sun Pharmaceutical Industries Limited reported $6,708.45 Million (+11.19% YoY) in operational revenue and $2,034.66 Million (+16.1% YoY) in EBITDA, expanding margins by 170 bps to 30.0% amid structural generic pricing deflation.
2. The $11.75 Billion Organon & Co. acquisition establishes a new Women’s Health pillar and Top 10 global biosimilar position, supported by a 40-facility global manufacturing footprint and $1,121.16 Million in consolidated liquidity.
3. Management absorbed $150.03 Million in pre-tax exceptional items and faces $738.94 Million in appellate tax litigation, balanced by $434.22 Million in positive foreign currency translation reserves.
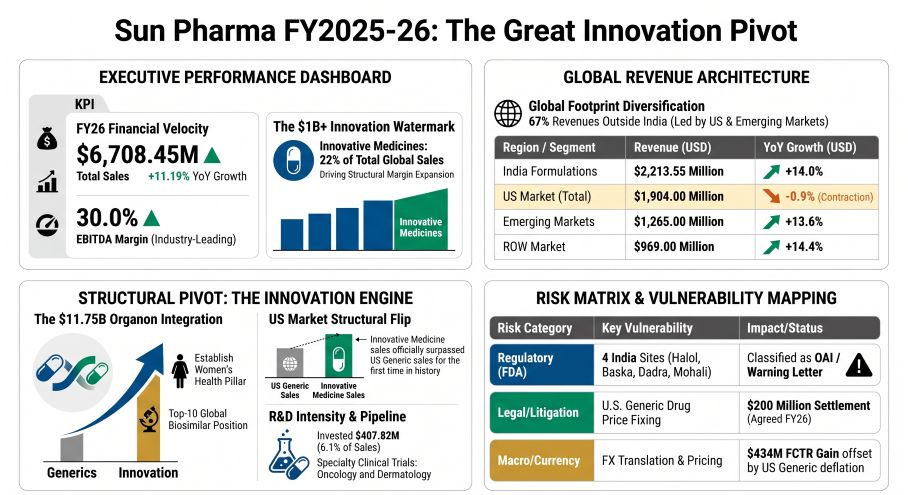
Figure Sun Pharma FY2025-26: The Great innovation Pivot
 Segmental Realities, Margin Architecture, and Forex Mechanics
Sun Pharmaceutical Industries Limited [NSE: SUNPHARMA] executed a strict margin expansion cycle in FY26. Operating margins expanded by 170 bps to 30.0%, driven by the transition toward high-margin Innovative Medicines, which surpassed the traditional US Generics segment in revenue contribution for the first time. The financial architecture relies on an explicit exchange conversion rate of 1 USD = 87.1468 INR. Despite severe pricing headwinds in the US commoditized generics market—exacerbated by incoming Most Favoured Nation (MFN) models such as GLOBE, GUARD, and GENEROUS—the consolidated balance sheet demonstrated liquidity resilience and a conservative debt-to-equity posture.
Table 1: Consolidated Income & Segmental Performance
Table 2: Geographic & Operational Segment Distribution
The Company distributed an interim dividend of $0.126 (₹11.00) per share, totaling $299.98 Million (₹26,142.7 Million). A proposed final dividend of $0.057 (₹5.00) per share requires $137.66 Million (₹11,996.67 Million), achieving absolute parity with the FY25 total payout of $0.184 (₹16.00) per share.
Table 3: Capital Structure & Borrowing Mechanics
The standalone borrowing architecture reveals non-cash interest capitalization mechanisms. Parent company borrowings opened at $1,349.86 Million (₹117,635.8 Million). Despite executing cash repayments of -$133.71 Million (₹11,652.6 Million), the debt balance increased due to a non-cash transfer (interest capitalization) of $323.78 Million (₹28,216.7 Million), closing at $1,539.93 Million (₹134,199.9 Million). Consolidated borrowings expanded via cash inflows of $219.39 Million (₹19,118.8 Million) and foreign exchange (FX) impacts of $34.44 Million (₹3,001.0 Million), rising from an opening position of $214.54 Million (₹18,696.3 Million) to a close of $468.36 Million (₹40,816.1 Million).
Table 4: Comprehensive Income & Forex Hedging Operations
A 5% fluctuation in the INR against foreign currencies impacts consolidated profit by $55.39 Million (₹4,826.9 Million) and consolidated equity by $62.36 Million (₹5,434.1 Million). A 50-basis-point interest rate increase impacts Group profits by $2.34 Million (₹204.1 Million).
Infrastructure Layout, Corporate Governance, and M&A Dynamics
Sun Pharmaceutical Industries Limited sustains a vertically integrated supply chain encompassing 40 global manufacturing sites. The physical layout mandates strict volume generation in Emerging Markets across 80 countries (including Brazil, Romania, and Russia) backed by 3,300 representatives, while the Indian operations are supported by a field force of 16,000 representatives securing an 8.4% domestic market share. The domestic baseline growth expectation stands at a 6.5% to 9.5% CAGR from 2025-2029.
Global Physical Infrastructure:
* Finished Dosage Facilities (27): India (12), United States (3), Bangladesh (2), Morocco (1), Canada (1), Hungary (1), Israel (1), South Africa (1), Malaysia (1), Romania (1), Egypt (1), Nigeria (1), Russia (1).
* API Facilities (13): India (8), Australia (2), Israel (1), United States (1), Hungary (1).
* R&D Centers (6 facilities, >2,700 staff): Vadodara (Gujarat), Gurugram (Haryana), Haifa Bay (Israel), Brampton (Ontario), New Brunswick (NJ), Lexington (MA).
* Divestments/Closures: Ankleshwar facility reclassified as "held for sale". Lyndra Therapeutics Inc. closed, triggering a $29.87 Million (₹2,603 Million) impairment. Amalgamation of 5 wholly-owned Indian subsidiaries completed.
Inorganic Expansion and Mergers:
* Organon & Co.: $11.75 Billion enterprise valuation ($14.00 per share in cash) establishing a Women's Health division and a top 10 position in the biosimilars market.
* Checkpoint Therapeutics, Inc.: Acquired for $397.7 Million upfront ($4.10 per share) to secure the FDA-approved UNLOXCYT oncology asset.
* Taro Pharmaceutical Industries Ltd.: Completed a $347.4 Million (₹28,998.5 Million) minority shareholder buyout for 100% control.
Intra-Group Financing and Related Party Transactions (RPTs):
* Sun Pharma Distributors Limited: Generated operational inflows of $539.33 Million (₹47,000.8 Million).
* Sun Pharmaceutical Industries, Inc. (SPIINC): Generated $397.78 Million (₹34,665.5 Million) in revenue and received $39.56 Million (₹3,447.4 Million) in reimbursements. Secured Term Loans of $108.27 Million (₹9,435.0 Million) maturing Jan 2029, and $324.80 Million (₹28,305.0 Million) maturing Feb 2029, both at SOFR 3-months + 135 bps.
* Sun Pharma Laboratories Limited: Parent took loans of $1,678.89 Million (₹146,309.5 Million) and executed repayments of $1,488.81 Million (₹129,745.4 Million).
* Realstone Infra Limited: Received a $5.75 Million (₹500.7 Million) loan maturing Mar 2027 at 7.5%.
* Credit Provisions: Recognized a $9.91 Million (₹863.57 Million) credit impairment against wholly-owned subsidiaries and a $0.18 Million (₹15.3 Million) impairment/allowance against third-party loans.
* KMP & Promoter Entities: Remuneration for KMP stood at $2.80 Million (₹244.0 Million) and $0.46 Million (₹40.1 Million) for Independent Directors. Transactions with promoter-influenced entities included Shantilal Shanghvi Foundation ($4.59 Million / ₹400.0 Million for CSR), Sun Pharma Advanced Research Company Limited ($4.90 Million / ₹427.3 Million), NavBio AG ($0.11 Million / ₹9.5 Million), and Alfa Infraprop Private Limited ($0.32 Million / ₹28.0 Million).
Corporate Governance & Board Architecture:
* Dilip Shanghvi: Stepped down as MD on Sept 1, 2025; remains Executive Chairman.
* Kirti Ganorkar: Appointed Managing Director on Sept 1, 2025 (5-year term).
* Vidhi Shanghvi: Appointed Whole-time Director on May 22, 2025 (5-year term).
* Jayashree Satagopan: Succeeded C. S. Muralidharan as CFO on July 1, 2025.
* Sudhir Valia / Rama Bijapurkar: Retired July 31, 2025, and May 20, 2026, respectively.
* Pawan Goenka: Re-appointed Lead Independent Director on May 21, 2026 (5-year term).
* Satyavati Berera / Andreas Busch: Appointed Independent Directors on May 8, 2026, and May 12, 2026, respectively.
* Diversity & Sustainability: Board gender representation stands at 25% (2 of 8), with a 30% target by 2040. External auditor DNV Business Assurance India Private Limited verified energy sourcing is 52.6% renewable, achieving a 16.7% reduction in Scope 1 and 2 emissions (against a 35% reduction target by 2030) and a 20.2% drop in water consumption compared to a 2020 baseline.
Regulatory Compliance, Litigations, and Risk Architecture
Statutory auditors S R B C & CO LLP issued an unmodified opinion but flagged CARO qualifications under clauses i(c), iii(c), iii(e), and ix(a), alongside an IT audit trail compromise between May 2024 and November 2024. Key Audit Matters (KAMs) centered on litigation contingencies, U.S. revenue deductions, unrecoverable deferred tax assets, and valuation models for goodwill.
US FDA Compliance Actions:
* Halol (Gujarat): Inspected June 2025, classified Official Action Indicated (OAI) Sept 2025. Operates under Import Alert 66-40 and a Warning Letter.
* Baska (Gujarat): Inspected Sept 2025, classified OAI Dec 2025.
* Dadra: Inspected Dec 2023 (OAI), Warning Letter issued June 2024.
* Mohali (Punjab): Operating under an April 2023 Consent Decree (OAI Aug 2022).
Table 5: Contingent Liabilities, Exceptional Items & Provisions
Sub-judice operations involve ongoing Lipitor (Atorvastatin) antitrust claims regarding a 2008 Pfizer settlement (summary judgment granted June 2024, oral arguments heard Sept 2025). The Ranitidine/Zantac MDL regarding nitrosamine impurities remains under appeal following a July 2021 generic dismissal. Six Benzoyl Peroxide (BPO) degradation class actions concerning benzene were dismissed between Sept 2024 and April 2025, but remain under appeal. The UK NHS filed follow-on damage claims regarding Citalopram against Ranbaxy and Lundbeck following a 2021 ECJ ruling.
HDIN Institutional Verdict: Intellectual Property and Clinical Economics
Sun Pharmaceutical Industries Limited employs a heavily conservative R&D capitalization matrix, successfully capitalizing $482.51 Million (₹42,049.6 Million) from the development phase into active 'Other Intangible Assets' while immediately expensing $398.34 Million (₹34,713.7 Million) through the P&L. Product-related intangibles are amortized on a straight-line basis over 3 to 15 years. Legal defense of Concert Pharmaceuticals' patents against Incyte Corporation at the PTAB and EPO successfully protected $164.97 Million in associated goodwill.
Table 6: R&D Economics & Intellectual Property Valuation
The commercialization pipeline includes 29 globally marketed Innovative Medicine products. Prescriptive dominance is secured via a #1 ranking across 11 specialist categories (Psychiatrists, Neurologists, Cardiologists, Diabetologists, Gastroenterologists, Consultant Physicians, Urologists, Dermatology, ENT specialists, Chest physicians, Gynaecologists) and #2 among Nephrologists, Ophthalmologists, and Orthopaedic specialists.
Clinical Operations & Portfolio Execution:
* Commercialized: ILUMYA (+16.7% YoY, launched in India for plaque psoriasis), WINLEVI, CEQUA (out-licensed for Greater China).
* FY26 Launches: LEQSELVI (severe alopecia areata US), UNLOXCYT (cSCC US), Noveltreat, Sematrinity, Revital Biotin, Revital Omega, Volini Roll-on, Revital Recharge.
* Active Pipeline: Fibromun (Soft Tissue Sarcoma/Glioblastoma Phase 2); Nidlegy (Locally advanced melanoma Phase 3, BCC/cSCC Phase 2, partnered with Philogen in EU/Aus/NZ); GL0034 (Type 2 Diabetes Phase 2); MM-II (Pain in osteoarthritis Phase 2); ILUMYA (Psoriatic Arthritis Phase 3).
* Terminated Assets: SCD-044 development ceased, triggering a $33.01 Million (₹2,876.4 Million) charge.
Presentation Download & Video Access:
* Presentation Download: Click the PDF download link under 'Related Topics' to access the full institutional presentation of this report.
* Video Link: Click this link to watch the HDIN analyst briefing on YouTube.
About HDIN Research:
HDIN Research is a premier global market intelligence and strategic advisory firm specializing in institutional-grade financial analysis, supply chain audits, and macroeconomic forecasting. Our dedicated sector analysts deliver actionable, data-driven insights tailored for private equity, hedge funds, and corporate strategy teams. Visit us at http://www.hdinresearch.com.
2026 AI Transparency Footer:
"This intelligence report was authored by HDIN Research analysts following a rigorous audit of official corporate filings. AI was utilized for massive-scale data synthesis and structural drafting, ensuring 100% inclusion of reported data points. All strategic insights, financial modeling, and final verdicts were verified by our editorial board to ensure professional accuracy and compliance with 2026 Google Search E-E-A-T standards."
1. Sun Pharmaceutical Industries Limited reported $6,708.45 Million (+11.19% YoY) in operational revenue and $2,034.66 Million (+16.1% YoY) in EBITDA, expanding margins by 170 bps to 30.0% amid structural generic pricing deflation.
2. The $11.75 Billion Organon & Co. acquisition establishes a new Women’s Health pillar and Top 10 global biosimilar position, supported by a 40-facility global manufacturing footprint and $1,121.16 Million in consolidated liquidity.
3. Management absorbed $150.03 Million in pre-tax exceptional items and faces $738.94 Million in appellate tax litigation, balanced by $434.22 Million in positive foreign currency translation reserves.
Figure Sun Pharma FY2025-26: The Great innovation Pivot
Segmental Realities, Margin Architecture, and Forex MechanicsSun Pharmaceutical Industries Limited [NSE: SUNPHARMA] executed a strict margin expansion cycle in FY26. Operating margins expanded by 170 bps to 30.0%, driven by the transition toward high-margin Innovative Medicines, which surpassed the traditional US Generics segment in revenue contribution for the first time. The financial architecture relies on an explicit exchange conversion rate of 1 USD = 87.1468 INR. Despite severe pricing headwinds in the US commoditized generics market—exacerbated by incoming Most Favoured Nation (MFN) models such as GLOBE, GUARD, and GENEROUS—the consolidated balance sheet demonstrated liquidity resilience and a conservative debt-to-equity posture.
Table 1: Consolidated Income & Segmental Performance
| Metric | FY2026 (USD Million) | FY2026 (INR Million) | FY2025 (USD Million) | YoY Change |
|---|---|---|---|---|
| Total Operational Revenue | $6,708.45 | ₹584,620.4 | $6,033.32 | +11.19% |
| Gross Sales | $6,678.38 | ₹582,000.0 | N/A | +11.9% |
| EBITDA | $2,034.66 | ₹177,314.0 | N/A | +16.1% |
| Reported Profit After Tax (PAT) | $1,327.02 | ₹115,645.2 | $1,259.95 | +5.32% |
| Adjusted PAT (After Minority Interest) | $1,422.88 | ₹124,000.0 | N/A | +3.5% |
| Cost of Materials Consumed | $847.88 | ₹73,890.2 | $740.03 | +14.5% |
| Employee Benefit Expenses | $1,310.30 | ₹114,188.6 | $1,144.40 | +14.5% |
| Other Expenses | $2,181.18 | ₹190,082.8 | $1,924.55 | +13.3% |
| EBITDA Margin | 30.0% | — | 28.3% | +170 bps |
| Net Profit Margin | 19.7% | — | 21.0% | -130 bps |
Table 2: Geographic & Operational Segment Distribution
| Segment | Revenue (USD Million) | Revenue (INR Million) | Revenue Contribution | YoY Growth |
|---|---|---|---|---|
| India Formulations | $2,213.55 | ₹192,904 | 33% | +14.0% |
| US Formulations | $1,930.56 (Local: $1,904M) | ₹168,242 | 29% | -0.9% (USD) / +3.6% (INR) |
| Emerging Markets | $1,283.64 (Local: $1,265M) | ₹111,865 | 19% | +13.6% (USD) / +18.8% (INR) |
| Rest of World (ROW) Formulations | $983.21 (Local: $969M) | ₹85,684 | 15% | +14.4% (USD) / +19.6% (INR) |
| API Segment | $250.76 | ₹21,853 | 4% | +2.6% |
| Innovative Medicines | $1,475.86 (Local: $1,475M) | ₹128,600 | 22% | N/A |
The Company distributed an interim dividend of $0.126 (₹11.00) per share, totaling $299.98 Million (₹26,142.7 Million). A proposed final dividend of $0.057 (₹5.00) per share requires $137.66 Million (₹11,996.67 Million), achieving absolute parity with the FY25 total payout of $0.184 (₹16.00) per share.
Table 3: Capital Structure & Borrowing Mechanics
| Metric | FY2026 (USD Million) | FY2026 (INR Million) | FY2025 (USD Million) |
|---|---|---|---|
| Total Assets | $12,483.00 | ₹1,087,852.2 | $10,568.44 |
| Total Equity (Consolidated) | $9,625.11 | ₹838,797.4 | $8,317.68 |
| Total Equity (Standalone) | $2,567.02 | ₹223,707.6 | N/A |
| Cash & Cash Equivalents | $1,121.16 | ₹97,705.1 | $1,178.33 |
| Non-current Borrowings (Consolidated) | $3.59 | ₹312.6 | $0.29 |
| Current Borrowings (Consolidated) | $464.77 | ₹40,503.5 | $214.25 |
| Consolidated Debt-to-Equity Ratio | 0.06x | — | 0.03x |
| Standalone Debt-to-Equity Ratio | 0.61x | — | 0.50x |
| Current Ratio | 2.56x | — | 1.03x |
The standalone borrowing architecture reveals non-cash interest capitalization mechanisms. Parent company borrowings opened at $1,349.86 Million (₹117,635.8 Million). Despite executing cash repayments of -$133.71 Million (₹11,652.6 Million), the debt balance increased due to a non-cash transfer (interest capitalization) of $323.78 Million (₹28,216.7 Million), closing at $1,539.93 Million (₹134,199.9 Million). Consolidated borrowings expanded via cash inflows of $219.39 Million (₹19,118.8 Million) and foreign exchange (FX) impacts of $34.44 Million (₹3,001.0 Million), rising from an opening position of $214.54 Million (₹18,696.3 Million) to a close of $468.36 Million (₹40,816.1 Million).
Table 4: Comprehensive Income & Forex Hedging Operations
| OCI Item | Net Gain / (Loss) (USD Million) | Pre-Tax (USD Million) | Tax Impact (USD Million) |
|---|---|---|---|
| Foreign Currency Translation Reserve (FCTR) | $434.22 (₹37,840.5M) | — | — |
| Net Investment Translation | $7.72 (₹673.0M) | — | — |
| Foreign Exchange Operational Gain | $142.31 (₹12,401.8M) | — | — |
| Defined Benefit Plan Remeasurement | $1.19 | $1.89 | $(0.70) |
| Equity Instruments (FVOCI) | $20.62 | $32.87 | $(12.25) |
| Cash Flow Hedges | $(24.58) | $(32.85) | $8.27 |
| Debt Instruments (FVOCI) | $(0.06) | $(0.08) | $0.02 |
| Non-Reclassifiable OCI (Net Gain) | $21.82 | — | — |
| Reclassifiable OCI (Net Gain) | $417.29 | — | — |
A 5% fluctuation in the INR against foreign currencies impacts consolidated profit by $55.39 Million (₹4,826.9 Million) and consolidated equity by $62.36 Million (₹5,434.1 Million). A 50-basis-point interest rate increase impacts Group profits by $2.34 Million (₹204.1 Million).
Infrastructure Layout, Corporate Governance, and M&A Dynamics
Sun Pharmaceutical Industries Limited sustains a vertically integrated supply chain encompassing 40 global manufacturing sites. The physical layout mandates strict volume generation in Emerging Markets across 80 countries (including Brazil, Romania, and Russia) backed by 3,300 representatives, while the Indian operations are supported by a field force of 16,000 representatives securing an 8.4% domestic market share. The domestic baseline growth expectation stands at a 6.5% to 9.5% CAGR from 2025-2029.
Global Physical Infrastructure:
* Finished Dosage Facilities (27): India (12), United States (3), Bangladesh (2), Morocco (1), Canada (1), Hungary (1), Israel (1), South Africa (1), Malaysia (1), Romania (1), Egypt (1), Nigeria (1), Russia (1).
* API Facilities (13): India (8), Australia (2), Israel (1), United States (1), Hungary (1).
* R&D Centers (6 facilities, >2,700 staff): Vadodara (Gujarat), Gurugram (Haryana), Haifa Bay (Israel), Brampton (Ontario), New Brunswick (NJ), Lexington (MA).
* Divestments/Closures: Ankleshwar facility reclassified as "held for sale". Lyndra Therapeutics Inc. closed, triggering a $29.87 Million (₹2,603 Million) impairment. Amalgamation of 5 wholly-owned Indian subsidiaries completed.
Inorganic Expansion and Mergers:
* Organon & Co.: $11.75 Billion enterprise valuation ($14.00 per share in cash) establishing a Women's Health division and a top 10 position in the biosimilars market.
* Checkpoint Therapeutics, Inc.: Acquired for $397.7 Million upfront ($4.10 per share) to secure the FDA-approved UNLOXCYT oncology asset.
* Taro Pharmaceutical Industries Ltd.: Completed a $347.4 Million (₹28,998.5 Million) minority shareholder buyout for 100% control.
Intra-Group Financing and Related Party Transactions (RPTs):
* Sun Pharma Distributors Limited: Generated operational inflows of $539.33 Million (₹47,000.8 Million).
* Sun Pharmaceutical Industries, Inc. (SPIINC): Generated $397.78 Million (₹34,665.5 Million) in revenue and received $39.56 Million (₹3,447.4 Million) in reimbursements. Secured Term Loans of $108.27 Million (₹9,435.0 Million) maturing Jan 2029, and $324.80 Million (₹28,305.0 Million) maturing Feb 2029, both at SOFR 3-months + 135 bps.
* Sun Pharma Laboratories Limited: Parent took loans of $1,678.89 Million (₹146,309.5 Million) and executed repayments of $1,488.81 Million (₹129,745.4 Million).
* Realstone Infra Limited: Received a $5.75 Million (₹500.7 Million) loan maturing Mar 2027 at 7.5%.
* Credit Provisions: Recognized a $9.91 Million (₹863.57 Million) credit impairment against wholly-owned subsidiaries and a $0.18 Million (₹15.3 Million) impairment/allowance against third-party loans.
* KMP & Promoter Entities: Remuneration for KMP stood at $2.80 Million (₹244.0 Million) and $0.46 Million (₹40.1 Million) for Independent Directors. Transactions with promoter-influenced entities included Shantilal Shanghvi Foundation ($4.59 Million / ₹400.0 Million for CSR), Sun Pharma Advanced Research Company Limited ($4.90 Million / ₹427.3 Million), NavBio AG ($0.11 Million / ₹9.5 Million), and Alfa Infraprop Private Limited ($0.32 Million / ₹28.0 Million).
Corporate Governance & Board Architecture:
* Dilip Shanghvi: Stepped down as MD on Sept 1, 2025; remains Executive Chairman.
* Kirti Ganorkar: Appointed Managing Director on Sept 1, 2025 (5-year term).
* Vidhi Shanghvi: Appointed Whole-time Director on May 22, 2025 (5-year term).
* Jayashree Satagopan: Succeeded C. S. Muralidharan as CFO on July 1, 2025.
* Sudhir Valia / Rama Bijapurkar: Retired July 31, 2025, and May 20, 2026, respectively.
* Pawan Goenka: Re-appointed Lead Independent Director on May 21, 2026 (5-year term).
* Satyavati Berera / Andreas Busch: Appointed Independent Directors on May 8, 2026, and May 12, 2026, respectively.
* Diversity & Sustainability: Board gender representation stands at 25% (2 of 8), with a 30% target by 2040. External auditor DNV Business Assurance India Private Limited verified energy sourcing is 52.6% renewable, achieving a 16.7% reduction in Scope 1 and 2 emissions (against a 35% reduction target by 2030) and a 20.2% drop in water consumption compared to a 2020 baseline.
Regulatory Compliance, Litigations, and Risk Architecture
Statutory auditors S R B C & CO LLP issued an unmodified opinion but flagged CARO qualifications under clauses i(c), iii(c), iii(e), and ix(a), alongside an IT audit trail compromise between May 2024 and November 2024. Key Audit Matters (KAMs) centered on litigation contingencies, U.S. revenue deductions, unrecoverable deferred tax assets, and valuation models for goodwill.
US FDA Compliance Actions:
* Halol (Gujarat): Inspected June 2025, classified Official Action Indicated (OAI) Sept 2025. Operates under Import Alert 66-40 and a Warning Letter.
* Baska (Gujarat): Inspected Sept 2025, classified OAI Dec 2025.
* Dadra: Inspected Dec 2023 (OAI), Warning Letter issued June 2024.
* Mohali (Punjab): Operating under an April 2023 Consent Decree (OAI Aug 2022).
Table 5: Contingent Liabilities, Exceptional Items & Provisions
| Liability / Charge | Amount (USD Million) | Amount (INR Million) |
|---|---|---|
| Antitrust Settlement (Gross Payout) | $200.00 | ₹17,112.0 |
| Antitrust Settlement – Net FY2026 Charge (Including Opt-Out Provision) | $74.80 | ₹6,443.1 |
| Antitrust Tax Credit | $21.85 | ₹1,904.5 |
| Labour Codes Provision | $43.09 | ₹3,755.3 |
| Labour Codes Tax Credit | $10.84 | ₹944.4 |
| SCD-044 Discontinuation Charge | $33.01 | ₹2,876.4 |
| SCD-044 Tax Credit | $11.53 | ₹1,005.1 |
| Opioid Master Settlement (January 2026) | $36.75 | ₹3,161.7 |
| Speakes v. Taro Litigation (Insurance Covered) | $36.00 | — |
| Taro Minority Shareholder Litigation (Israel) | $245.00 | — |
| Tax Department Appeals Against the Company | $738.94 | ₹64,396.1 |
| Tax Appeals Filed by the Company | $81.58 | ₹7,109.1 |
| DPEA Contingent Liability | $39.87 | ₹3,474.2 |
| Indirect Taxes & Statutory Levies | $12.11 | ₹1,054.9 |
| Claims Not Acknowledged as Debt | $5.11 | ₹445.5 |
| Outstanding Bank Guarantees | $34.98 | ₹3,048.0 |
| Capital Expenditure Commitments (Unexecuted Contracts) | $400.46 | ₹34,898.4 |
| Investment Commitments | $50.81 | ₹4,427.6 |
| Outstanding Letters of Credit | $4.24 | ₹369.2 |
| NGT Environmental Penalty (Stayed) | $1.15 | ₹100.0 |
| MCA Penalty (DIN Non-Disclosure, FY2015–FY2018) | $0.02 | ₹1.45 |
Sub-judice operations involve ongoing Lipitor (Atorvastatin) antitrust claims regarding a 2008 Pfizer settlement (summary judgment granted June 2024, oral arguments heard Sept 2025). The Ranitidine/Zantac MDL regarding nitrosamine impurities remains under appeal following a July 2021 generic dismissal. Six Benzoyl Peroxide (BPO) degradation class actions concerning benzene were dismissed between Sept 2024 and April 2025, but remain under appeal. The UK NHS filed follow-on damage claims regarding Citalopram against Ranbaxy and Lundbeck following a 2021 ECJ ruling.
HDIN Institutional Verdict: Intellectual Property and Clinical Economics
Sun Pharmaceutical Industries Limited employs a heavily conservative R&D capitalization matrix, successfully capitalizing $482.51 Million (₹42,049.6 Million) from the development phase into active 'Other Intangible Assets' while immediately expensing $398.34 Million (₹34,713.7 Million) through the P&L. Product-related intangibles are amortized on a straight-line basis over 3 to 15 years. Legal defense of Concert Pharmaceuticals' patents against Incyte Corporation at the PTAB and EPO successfully protected $164.97 Million in associated goodwill.
Table 6: R&D Economics & Intellectual Property Valuation
| Asset / Expenditure | Value (USD Million) | Value (INR Million) |
| Total FY26 R&D Spend (6.1% of sales vs 6.2% FY25) | 407.82 | 35,540.0 |
| Total FY25 R&D Spend | 372.75 | 32,484.0 |
| Expensed R&D (Revenue Expenditure) | 398.34 | 34,713.7 |
| Capitalized R&D (Capital Expenditure) | 9.17 | 799.1 |
| In-Process R&D (FY26) | 191.75 | 16,710.8 |
| In-Process R&D (FY25) | 620.75 | 54,096.2 |
| IP Capitalized to Active Intangibles | 482.51 | 42,049.6 |
| Other Intangible Assets (FY26) | 1,362.65 | 118,750.8 |
| Other Intangible Assets (FY25) | 414.35 | 36,109.2 |
| Net Goodwill (FY26) | 1,128.34 | 98,330.8 |
| Net Goodwill (FY25) | 1,025.79 | 89,394.2 |
| Goodwill: SPIINC | 398.32 | 34,712.5 |
| Goodwill: SC Terapia SA | 288.51 | 25,142.9 |
| Goodwill: Taro | 216.14 | 18,835.7 |
| Goodwill: Concert | 164.97 | 14,376.9 |
| Non-Exceptional Impairment (PPE/Intangibles) | 2.22 | 193.4 |
The commercialization pipeline includes 29 globally marketed Innovative Medicine products. Prescriptive dominance is secured via a #1 ranking across 11 specialist categories (Psychiatrists, Neurologists, Cardiologists, Diabetologists, Gastroenterologists, Consultant Physicians, Urologists, Dermatology, ENT specialists, Chest physicians, Gynaecologists) and #2 among Nephrologists, Ophthalmologists, and Orthopaedic specialists.
Clinical Operations & Portfolio Execution:
* Commercialized: ILUMYA (+16.7% YoY, launched in India for plaque psoriasis), WINLEVI, CEQUA (out-licensed for Greater China).
* FY26 Launches: LEQSELVI (severe alopecia areata US), UNLOXCYT (cSCC US), Noveltreat, Sematrinity, Revital Biotin, Revital Omega, Volini Roll-on, Revital Recharge.
* Active Pipeline: Fibromun (Soft Tissue Sarcoma/Glioblastoma Phase 2); Nidlegy (Locally advanced melanoma Phase 3, BCC/cSCC Phase 2, partnered with Philogen in EU/Aus/NZ); GL0034 (Type 2 Diabetes Phase 2); MM-II (Pain in osteoarthritis Phase 2); ILUMYA (Psoriatic Arthritis Phase 3).
* Terminated Assets: SCD-044 development ceased, triggering a $33.01 Million (₹2,876.4 Million) charge.
Presentation Download & Video Access:
* Presentation Download: Click the PDF download link under 'Related Topics' to access the full institutional presentation of this report.
* Video Link: Click this link to watch the HDIN analyst briefing on YouTube.
About HDIN Research:
HDIN Research is a premier global market intelligence and strategic advisory firm specializing in institutional-grade financial analysis, supply chain audits, and macroeconomic forecasting. Our dedicated sector analysts deliver actionable, data-driven insights tailored for private equity, hedge funds, and corporate strategy teams. Visit us at http://www.hdinresearch.com.
2026 AI Transparency Footer:
"This intelligence report was authored by HDIN Research analysts following a rigorous audit of official corporate filings. AI was utilized for massive-scale data synthesis and structural drafting, ensuring 100% inclusion of reported data points. All strategic insights, financial modeling, and final verdicts were verified by our editorial board to ensure professional accuracy and compliance with 2026 Google Search E-E-A-T standards."