Shanghai Smart Logic Technology: Fabless AI Pivot Near Hubei as 585% Accounts Receivable Bloat Signals Acute Infrastructure Concentration Risk
HDIN Executive Takeaways
1. Q1 2026 R&D intensity reached 207.94% amid a $121.32 million 2025 operating cash burn, sustained entirely by a pre-IPO equity injection of $727.14 million.
2. Operations in Hubei exhibit a 99.67% accounts receivable concentration from a single public-sector entity, elongating the cash conversion cycle to 0.71x.
3. Strategic viability relies on scaling the HPP2.0 architecture beyond Nvidia's ecosystem monopoly, demanding $453.18 million in IPO capital for outsourced tape-outs.
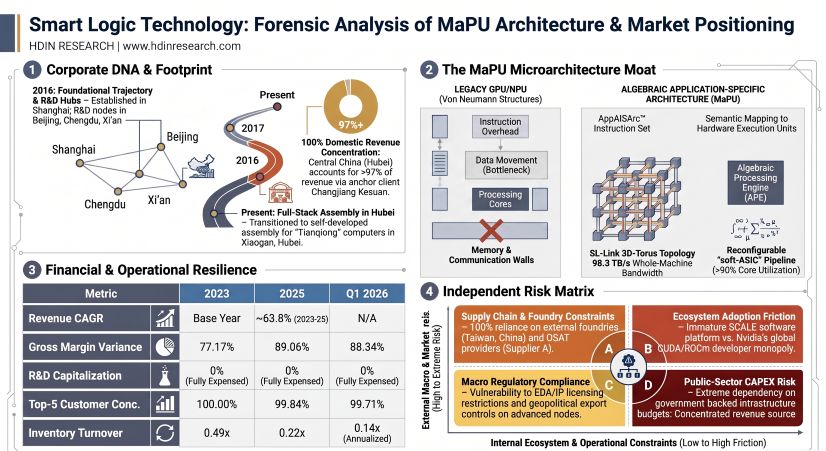
Figure Smart Logic Technology: Forensic Analysis of MaPU Architecture & Market Positioning
 Segmental Realities and Margin Compression
Shanghai Smart Logic Technology [Pending SSE: SMARTLOGIC] operates a concentrated commercialization model divided strictly into Scientific Computing and Advanced Communication. A forensic audit of the income statement reveals structural divergence between high gross margins and systemic operating cash outflows, dictated by extreme customer concentration and working capital bloat.
Table 1: Main Business Revenue Split & Gross Margins (USD Millions)
| Business Segment | Product Line | 2026 Q1 Revenue (USD M) | Q1 Gross Margin | FY2025 Revenue (USD M) | FY2025 Gross Margin | FY2024 Revenue (USD M) | FY2024 Gross Margin | FY2023 Revenue (USD M) | FY2023 Gross Margin |
|---|---|---|---|---|---|---|---|---|---|
| Scientific Computing | Subtotal | $18.35 | 89.19% | $91.87 | 89.23% | $57.17 | 83.84% | $34.64 | 80.39% |
| Scientific Computer | $18.35 | 89.19% | $91.87 | 89.23% | $55.86 | 84.44% | $34.64 | 80.39% | |
| Scientific Computing Chip | - | - | - | - | $1.05 | 47.54% | - | - | |
| Scientific Computing Software | - | - | - | - | $0.26 | 100.00% | - | - | |
| Advanced Communications | Subtotal | $0.49 | 56.99% | $0.91 | 71.38% | $1.41 | 91.15% | - | - |
| Communications Baseband Chip | $0.25 | 30.48% | $0.46 | 48.25% | $0.14 | 35.15% | - | - | |
| Communications Software | $0.20 | 100.00% | $0.38 | 100.00% | $1.20 | 100.00% | - | - | |
| Other Communications Hardware | $0.05 | 19.69% | $0.07 | 69.82% | $0.07 | 55.48% | - | - | |
| Total Main Business | Aggregate | $18.85 | 88.34% | $92.78 | 89.06% | $58.58 | 84.01% | $34.64 | 77.17% |
Note: The 2025 aggregate gross margin stood at 88.59% (overall), structurally outpacing the domestic peer average of 58.77% (Hygon Information 57.83%, Moore Threads 65.57%, MetaX 56.51%, Cambricon 55.15%).
Table 2: Production and Sales Volume Metrics
| Product Category | Metric | 2026 Q1 | FY2025 | FY2024 | FY2023 |
|---|---|---|---|---|---|
| "Tianqiong" 3D Scientific Computer | Production (Units) | - | 6 | 4 | 2 |
| Sales (Units) | 1 | 5 | 4 | 2 | |
| Sales-to-Production Ratio | N/A | 83.33% | 100.00% | 100.00% | |
| UCP Series Baseband Chip | Sales (Units) | 4,240 | 6,034 | 2,313 | - |
Table 3: Geographic Revenue Split (USD Millions)
Product Category Performance
| Product Category | Metric | 2026 Q1 | FY2025 | FY2024 | FY2023 |
|---|---|---|---|---|---|
| "Tianqiong" 3D Scientific Computer | Production (Units) | - | 6 | 4 | 2 |
| Sales (Units) | 1 | 5 | 4 | 2 | |
| Sales-to-Production Ratio | N/A | 83.33% | 100.00% | 100.00% | |
| UCP Series Baseband Chip | Sales (Units) | 4,240 | 6,034 | 2,313 | - |
Geographic Revenue Split (USD Millions)
| Geography (China) | 2026 Q1 Revenue | % of Total | FY2025 Revenue | % of Total | FY2024 Revenue | % of Total | FY2023 Revenue | % of Total |
|---|---|---|---|---|---|---|---|---|
| Central China | $18.35 | 97.37% | $91.89 | 99.04% | $55.86 | 95.35% | $34.64 | 100.00% |
| East China | $0.34 | 1.81% | $0.26 | 0.28% | $2.29 | 3.91% | - | 0.00% |
| North China | $0.10 | 0.52% | $0.30 | 0.32% | $0.17 | 0.29% | - | 0.00% |
| Other Regions | $0.05 | 0.29% | $0.33 | 0.36% | $0.26 | 0.44% | - | 0.00% |
| Total Revenue | $18.85 | 100.00% | $92.78 | 100.00% | $58.58 | 100.00% | $34.64 | 100.00 |
Profitability, Working Capital, and Quality of Earnings
* Net Income & Operating Cash Flow (OCF): The entity reported net losses of -$44.34 million (2023), -$41.67 million (2024), -$56.52 million (2025), and -$39.35 million (Q1 2026). Correlating OCF deteriorated sharply at -$13.65 million, -$49.28 million, -$121.32 million, and -$25.36 million across the same periods, indicating recognized revenues are not yielding cash inflows.
* Accounts Receivable (AR) Bloat: AR turnover collapsed from 7.28x (2024) to 1.55x (2025), annualizing at 0.71x by Q1 2026. The Q1 2026 AR balance reached $111.69 million, equating to 585.57% of quarterly revenue.
* Customer Concentration: The anchor client, Changjiang Kesuan, represented 99.67% of the total AR balance. Its revenue contribution measured 100.00% ($34.87 million) in 2023, 95.39% ($56.32 million) in 2024, 99.03% ($92.68 million) in 2025, and 97.40% ($18.58 million) in Q1 2026. Total Top-5 client concentration stood at 100.00% ('23), 99.55% ('24), 99.84% ('25), and 99.71% (Q1 '26).
* Inventory Execution: Gross inventory reached $65.95 million (net $57.22 million) by Q1 2026. Strategic stockpiling to hedge geopolitical risks compressed inventory turnover from 0.49x (2023) to 0.14x (Q1 2026), forcing an inventory impairment provision of $8.73 million (a 13.24% impairment ratio).
* R&D Capitalization & Personnel: R&D expenditures registered at $34.70 million (2023), $65.16 million (2024), $98.81 million (2025), and $39.66 million (Q1 2026). R&D intensity scaled from 99.51% ('23), 110.37% ('24), and 105.57% ('25) to 207.94% in Q1 2026. The entity enforces a strict 0% R&D capitalization rate. R&D personnel account for 79.26% (539 out of 680) of the Q1 2026 workforce, up from 79.02% in 2025.
* State Subsidies & Tax Advantages: Direct government subsidies offsetting P&L burn totaled $0 (2023), $2.44 million (2024), $1.38 million (2025), and $0.14 million (Q1 2026). Key tranches included a $2.07 million Support Industrial Scale Leap Subsidy (2024), a $0.56 million High-Growth Tech Enterprise Subsidy (2025), and a $0.50 million Data Intelligence Industry High-Quality Development Subsidy (2025). The parent and key subsidiaries (Shanghai Smart Logic Wanwei, Smart Logic Dongxin) hold "High-Tech Enterprise" certifications, qualifying for a 15% enterprise income tax rate and a 15% VAT input credit extra deduction.
* Share-Based Compensation: Overhead includes non-cash share-based compensation of $22.57 million (2023), $13.50 million (2024), $16.75 million (2025), and $5.72 million (Q1 2026).
* Liquidity Injections: The Q1 2026 balance sheet incorporates $702.07 million in cash from equity financing, elevating Cash and Cash Equivalents to $433.49 million and Trading Financial Assets to $210.79 million. Consequently, the Current Ratio spiked from 2.60x to 19.99x, the Quick Ratio from 2.23x to 18.78x, and the Asset-Liability Ratio compressed from 40.89% to 8.16%. Accumulated unrecovered losses sit at -$174.63 million, legally halting near-term dividend distributions.
Infrastructure Layout and Regional Moats
Shanghai Smart Logic Technology executes a 100% "Fabless" operational model, maintaining complete dependence on external wafer fabrication and Outsourced Semiconductor Assembly and Test (OSAT) facilities while retaining centralized intellectual property design.
Physical & Supply Chain Architecture
* HQ & Core R&D: Jingan District, Shanghai (Centralized architecture design).
* Regional R&D Centers: Beijing, Chengdu, and Xi'an (Decentralized talent acquisition, software ecosystems).
* Equipment Manufacturing: Xiaogan, Hubei via subsidiary Hubei Silang Wanwei (Assembly base for the Tianqiong 3D computer, transitioned to full-stack self-developed integration).
* Foundry Dependency & Prepayments: Top-5 supplier concentration shifted from 80.85% (2023), 53.61% (2024), and 67.98% (2025), peaking at 89.33% in Q1 2026. OSAT partner "Supplier A" controlled 59.71% of Q1 2026 procurement. Securing global foundry capacity necessitated $41.28 million in current prepayments (4.37% of total current assets), including a concentrated $15.34 million allocation (37.15% of total prepayments) to "Supplier F" for advanced chip tape-outs.
Technological Benchmarks & MaPU Specifications
The proprietary Mathematics Processing Unit (MaPU) utilizes an Application Algorithm Instruction Set Architecture (AppAISArc™) and Algebraic Processing Engine (APE) vector cores capable of issuing 25 instructions simultaneously. Native data support encompasses FP64, FP32, TF32, FP16, BF16, FP8, INT32, and INT8.
* Molecular Dynamics Performance: The "Tianqiong" 3D Scientific Computer (configured with 512 HPP chips operating at 50.87 kW) delivers 2,940 ns/day on the STMV Benchmark (1.06 million atoms). This structurally challenges D.E. Shaw Research's Anton 2 (9,500 ns/day at 50-70 kW) and outpaces Nvidia Corporation's [NASDAQ: NVDA] Selene supercomputer (64 A100 GPUs at 35-42 kW), which registers 234 ns/day. On the LAMMPS Benchmark (EC/LiPF6 electrolyte, 999.6k atoms), Tianqiong delivers 1,540 ns/day versus an 8-node Nvidia H100 GPU cluster at 13.34 ns/day.
* System-Level Hardware: The system yields 2.21 PFLOPS of FP64 peak compute per unit, capped at 120 kW power consumption. The hardware utilizes a 3D-Torus network topology and SL-Link interconnect protocol, delivering single-chip aggregate bandwidth of 384 GB/s and whole-machine bi-directional bandwidth of 98.3 TB/s at nanosecond latency. The hardware holds a "Double Five" (CP-S5, CE-S5) rating from CAICT.
* Advanced Communications: The UCP series (UCP4008 advancing to UCP8016) utilizes Software-Defined Radio, integrating 8 APE processors and 2 NPU clusters at a typical power draw of 12W for 5G and Non-Terrestrial Network (NTN) satellite internet base stations.
Ecosystem Moats & Intellectual Property
The SCALE (Smartlogic Computing Architecture Language and Environment) platform supports general LLVM Intermediate Representation (IR), XSIMD, OpenCL, and C/C++ extensions to run proprietary software like Alpha Dynamics and sDDE. The global IP portfolio features 150 authorized patents (112 domestic, 7 overseas), 130 software copyrights, and 4 IC layout designs. Patent stratification includes Microarchitecture (41 granted/5 overseas, 10 pending), Algorithms (9 granted, 47 pending), Compiler Optimization (2 granted, 1 PCT, 11 pending), and Interconnects (1 granted, 1 PCT, 7 pending).
HDIN Institutional Verdict
Shanghai Smart Logic Technology presents a highly polarized institutional profile. The firm possesses legitimate, globally competitive FP64 hardware validated by CAICT and direct commercial deployment, yet its capitalization structure and commercialization runway are burdened by systemic, existential bottlenecks.
Capitalization Velocity and Governance Attrition
The firm's R&D burn rate mandated an aggressive capitalization timeline that severely diluted founder Wang Donglin. Initial capital stood at $1.39 million (10.00 million CNY) in June 2016. Capital injections scaled through a July 2024 round ($117.84 million), sequential February 2025 rounds ($44.52 million and $13.91 million), a December 2025 pre-IPO round ($160.62 million), and a March 2026 mega-round ($727.14 million). The pre-IPO implied registered capital sits at $66.29 million (476.47 million CNY).
Wang Donglin’s direct equity collapsed from 70.00% at founding to 46.46% by January 2023, falling to 19.21% post-JSC conversion (July 2025), and resting at 13.37% currently. Through six employee holding platforms (Langyan, Chengyue, Kuanglang, Zhaolang, Langyao, Fenyue) acting under GPs Qingjun, Qinghui, and Qingbin, alongside a concerted action agreement with CEO Zha Hao (who holds 7.60% indirectly), Wang retains 33.67% aggregate voting control. Following the planned 10% public float (issuing 52.94 million new shares), this control will compress to 30.30%, triggering explicit "Control Stability Risk." To retain talent, 79.89 million restricted shares (16.77% of total capital) were granted to 614 personnel, featuring a strict vesting schedule triggering at the IPO and the 3-year, 5-year, 7-year, and 8-year post-IPO marks.
Related-Party Transactions & Structural Compliance
Historical related-party transactions centered on Shanghai Zhongxin (procurement of $55.49 million in 2023, $48.91 million in 2024, and $2.69 million in 2025; sales of $13.11 million in 2024) and Yuanxin Satellite (sales of $0.07 million in 2025 and $0.52 million in Q1 2026). Wang Donglin also provided an $8.35 million working capital loan in 2022. To meet IPO compliance, all special shareholder rights (VAM agreements, liquidation preferences) were permanently terminated in April 2026. A 7-member board (including 3 independent directors: Chen Dawei, Zhang Wansu, Wu Hui) manages oversight, enforcing a post-IPO dividend policy strictly tiered at 80%, 40%, or 20% based on corporate maturity and capital expenditure.
IPO Capital Allocation Viability
The $635.45 million planned capital expenditure is entirely indexed toward breaking the Nvidia CUDA monopoly and circumventing geopolitical export controls. The firm seeks $615.83 million in IPO proceeds: $453.18 million directed to Project A (Next-Generation Scientific AI Chip R&D for the HPP2.0 and Xingqiong servers) and $162.65 million to Project B (High-Performance Converged Computing Systems).
If the HPP2.0 chip fails its initial tape-out—or if international sanctions abruptly sever access to the specialized EDA tools and advanced nodes utilized by Supplier A and Supplier F—the $453.18 million allocation will yield zero commercial ROI. The entity is currently functioning as an outsourced R&D department for Hubei province's localized compute mandates rather than a generalized semiconductor enterprise, evidenced by the 585.57% accounts receivable ratio. Until the firm can successfully migrate commercial B2B workloads away from legacy x86/CUDA architectures onto its proprietary MaPU instruction set without state-directed CAPEX, its financial sustainability remains entirely reliant on perpetual secondary equity financing.
Presentation Download & Video Access:
- Presentation Download: Click the PDF download link under 'Related Topics' to access the full institutional presentation of this report.
- Video Link: Click this link to watch the HDIN analyst briefing on YouTube.
About HDIN Research:
HDIN Research is a premier global market intelligence and strategic advisory firm specializing in institutional-grade financial analysis, supply chain audits, and macroeconomic forecasting. Our dedicated sector analysts deliver actionable, data-driven insights tailored for private equity, hedge funds, and corporate strategy teams. Visit us at http://www.hdinresearch.com.
2026 AI Transparency Footer:
"This intelligence report was authored by HDIN Research analysts following a rigorous audit of official corporate filings. AI was utilized for massive-scale data synthesis and structural drafting, ensuring 100% inclusion of reported data points. All strategic insights, financial modeling, and final verdicts were verified by our editorial board to ensure professional accuracy and compliance with 2026 Google Search E-E-A-T standards."