Atul Ltd: Retail Formulation Pivot Near Gujarat Infrastructure as 12.3% Consolidated Revenue Expansion Deflects Chinese Commodity Overcapacity
Date : 2026-07-10
Reading : 158
HDIN Executive Takeaways
1. Atul Ltd recorded a 12.3% consolidated revenue expansion, scaling from $776.84 million to $872.84 million, leveraging a zero-debt balance sheet (1.0x financial leverage) and an 82% domestic procurement baseline to neutralize Chinese pesticide dumping risks.
2. Management is engineering a margin-accretive migration from commoditized bulk chemical manufacturing toward retail channels across 88 countries, anchored by 8 global facilities including Ankleshwar, India, and Somerset, UK.
3. A deliberate 14-day extension in Days Payable Outstanding (DPO) perfectly insulated a 12-day expansion in Days Sales Outstanding (DSO), preserving a $117.36 million operating cash flow generation amidst Middle Eastern geopolitical supply chain volatility.
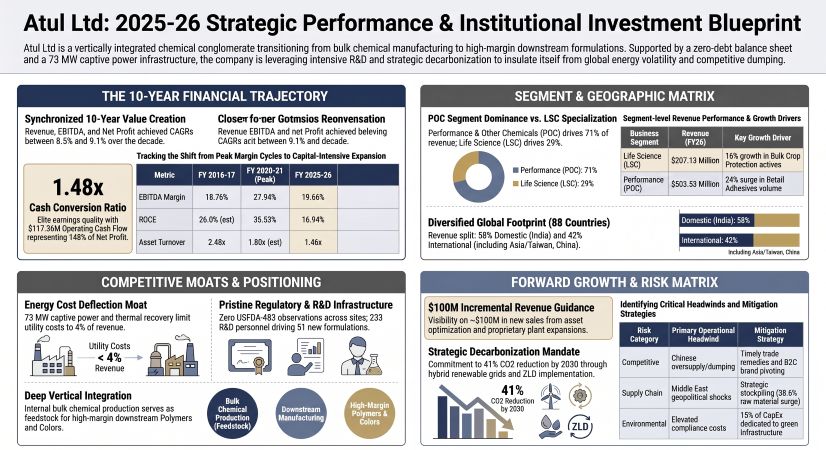
Figure Atul Ltd: 2025-26 Strategic Performance & institutional investment Blueprint
 Financial Architecture and Segmental Margin Realities
An audit of Atul Ltd [NSE: ATUL] reveals a structurally unlevered, cash-generative model currently navigating a capital-intensive phase. Over a 10-year horizon, consolidated revenue delivered an 8.56% Compound Annual Growth Rate (CAGR) scaling from $343.79 million to $719.93 million (₹6,273.54 crore) in segmented baseline reporting. EBITDA and Profit After Tax (PAT) tracked this trajectory at 9.13% ($141.60 million) and 8.78% ($79.06 million) CAGRs, respectively.
Operating metrics indicate a normalization of profitability. The EBITDA margin compressed from a historical FY21 peak of 27.34% to a structural baseline of 19.66%, while PAT margins recalibrated from a peak of 23.63% to a band between 10.78% and 10.98%. Consequently, capital efficiency has tightened: Return on Equity (ROE) compressed from a peak of 22.70% to 11.53%, and Return on Capital Employed (ROCE) moved from 35.53% to 16.94%. This compression is mathematically driven by declining asset velocity, with Asset Turnover dropping from 2.48x to 1.46x as the gross block scales faster than immediate revenue capture.
Despite ratio compression, cash conversion remains elite. Operating Cash Flow (OCF) to PAT conversion stands at 1.48x ($117.36 million OCF vs. $79.06 million PAT). The OCF-to-Revenue ratio improved from 13.22% a decade ago to 15.79%, underwriting approximately $117.39 million (₹1,023 crore) in Free Cash Flow (FCF) and maintaining a net borrowing position of merely $20.65 million against a $722.57 million total equity base.
Working Capital Velocity and Inventory Disclosures
The working capital cycle demonstrates deliberate supplier-financed liquidity. Days Sales Outstanding (DSO) expanded from 60 days to 72 days as standalone Trade Receivables reached $163.56 million (₹1,175.58 crore). To offset this, management extended Days Payable Outstanding (DPO) from 54 days to 68 days. Days Inventory Outstanding (DIO) stabilized between 47 to 52 days, constituting 13% to 14% of revenue.
Total consolidated inventory stands at $113.46 million (₹815.47 crore). Forensic inventory deconstruction reveals zero involuntary accumulation of finished goods; Finished Goods expanded by 10.6% ($42.90 million to $47.45 million), pacing slightly below the 12.3% consolidated revenue expansion ($776.84 million to $872.84 million). Work-In-Progress (WIP) velocity remained flat at $22.95 million (versus $23.16 million in FY25). Conversely, Raw Material and Packing Material inventories surged by 38.6% (from $23.28 million to $32.28 million) as a direct defensive hedge against Middle Eastern supply chain shocks.
Global Infrastructure Layout and Supply Chain Moats
Atul Ltd operates 8 physical manufacturing sites globally. The domestic base includes Atul, Ankleshwar, Panoli, Tarapur, Ambernath, and Jodhpur. The sole international manufacturing plant is operated by DPD Ltd in Somerset, UK.
Geographic revenue is anchored by the Indian domestic market at 58%. International sales (42%) are distributed across Asia excluding India (15%), North America (10%), Europe (9%), South America (5%), Africa (2%), and Australia (1%). International market penetration is executed via wholly owned subsidiaries: Atul China Ltd (Shanghai), Atul USA Inc (Charlotte), Atul Brasil Quimicos Ltda (São Paulo), Atul Europe Ltd (UK), Atul Ireland Ltd (Dublin), Atul Deutschland GmbH (Germany), and Atul Middle East FZ-LLC (Dubai). Note: All East Asian geographic designations strictly adhere to the UN 'Taiwan, China' standard.
The Total Addressable Market (TAM) parameters dictate capacity expansion. Atul targets the global p-Cresol market ($225 million by 2031, 3.5% CAGR), Resorcinol market ($440 million by 2025, 4.58% CAGR), and the vast Epoxy Resin market ($12.3 billion, 5.58% CAGR) supplemented by curing agents ($3.9 billion). The company services 4,000 customers across 32 industries, registering a customer quality complaint rate of 0.0009% and a 99.7% right-first-time production metric.
HDIN Institutional Verdict and Forward Capital Governance
HDIN’s forensic audit of the corporate umbrella exposes bifurcated subsidiary performance. The core 100%-owned entities act as debt-free cash engines: Atul USA Inc generated $66.24 million in revenue with a $1.44 million net profit, while Atul China Ltd procured $12.86 million in parent sales. However, specific joint ventures act as severe drags on consolidated ROCE. The 50% joint operation Anaven LLP (with Nouryon BV) reported a PBT loss of $5.01 million on $11.69 million in sales, defaulting on $4.00 million in obligations delayed by up to 821 days, forcing a 12-month extension on a $0.24 million tranche. Additionally, the non-core Valsad Institute of Medical Sciences operated at a 9% utilization rate, generating $2.78 million in sales with a PBT loss of $1.53 million.
The standalone parent acts as the primary procurement and manufacturing node, selling $82.05 million to subsidiaries (including $51.04 million to Atul USA Inc) while purchasing $44.57 million from backward-integrated entities (APL: $30.99 million, Amal Speciality Chemicals Ltd: $6.84 million). The Rudolf Atul Chemicals Ltd JV generated $18.67 million, yielding $10.20 million in goods procurement and up-streaming a $1.62 million dividend to the parent. Promoter entity transactions were contained at $0.07 million.
Capital deployment pipelines signal strict internal discipline. During FY26, the company deployed $16.18 million into fixed assets and $21.69 million into group investments. Unexecuted capital contracts stand at $6.73 million for property, plant, and equipment, with an additional $5.92 million (reported up to $7.18 million) in uncalled capital for unlisted entities. Off-balance-sheet exposure is isolated primarily to a $21.12 million corporate guarantee securing working capital for APL via HDFC Bank ($7.89 million) and Federal Bank ($13.23 million). Statutory disputes remain immaterial: Customs ($0.25 million), GST ($0.50 million), Labor ($0.46 million), and Income Tax ($0.13 million and a pending $0.87 million appeal).
Consolidated Capital Work-in-Progress (CWIP) remains tightly controlled at $12.64 million, with 63.4% ($8.01 million) aged under one year, and merely $2.06 million stalled beyond 3 years. Standalone CWIP declined from $10.48 million to $9.27 million, indicating rapid asset commercialization. Forward revenue target additions rely purely on asset optimization: management forecasts $50.03 million from existing capacity debottlenecking, $45.33 million from proprietary expansion, and $4.59 million from joint ventures, with a strategic mandate to scale B2B retail beyond its $13.88 million baseline.
Corporate governance is rigorously institutionalized. The 11-member Board features 7 Non-executive Directors (63.64% independent). Executive compensation remains conservative; Chairman Sunil Lalbhai’s pay ratio sits at 15.68x the median employee, while Managing Director Samveg Lalbhai’s ratio is 8.00x, with a base salary of $7,685.87 per month capped at $13,769.87. Capital expenditures between $0.57 million and $2.87 million are managed by the Investment Committee, with excesses escalated to the Board. Shareholder returns materialized via a 15% dividend payout ratio, escalating the distribution from $0.29 (₹25) to $0.34 (₹30) per share, resulting in a $10.14 million outflow against a $3.38 million equity base.
Presentation Download & Video Access:
- Presentation Download: Click the PDF download link under 'Related Topics' to access the full institutional presentation of this report.
- Video Link: Click this link to watch the HDIN analyst briefing on YouTube.
About HDIN Research:
HDIN Research is a premier global market intelligence and strategic advisory firm specializing in institutional-grade financial analysis, supply chain audits, and macroeconomic forecasting. Our dedicated sector analysts deliver actionable, data-driven insights tailored for private equity, hedge funds, and corporate strategy teams. Visit us at http://www.hdinresearch.com.
2026 AI Transparency Footer:
"This intelligence report was authored by HDIN Research analysts following a rigorous audit of official corporate filings. AI was utilized for massive-scale data synthesis and structural drafting, ensuring 100% inclusion of reported data points. All strategic insights, financial modeling, and final verdicts were verified by our editorial board to ensure professional accuracy and compliance with 2026 Google Search E-E-A-T standards."
1. Atul Ltd recorded a 12.3% consolidated revenue expansion, scaling from $776.84 million to $872.84 million, leveraging a zero-debt balance sheet (1.0x financial leverage) and an 82% domestic procurement baseline to neutralize Chinese pesticide dumping risks.
2. Management is engineering a margin-accretive migration from commoditized bulk chemical manufacturing toward retail channels across 88 countries, anchored by 8 global facilities including Ankleshwar, India, and Somerset, UK.
3. A deliberate 14-day extension in Days Payable Outstanding (DPO) perfectly insulated a 12-day expansion in Days Sales Outstanding (DSO), preserving a $117.36 million operating cash flow generation amidst Middle Eastern geopolitical supply chain volatility.
Figure Atul Ltd: 2025-26 Strategic Performance & institutional investment Blueprint
Financial Architecture and Segmental Margin RealitiesAn audit of Atul Ltd [NSE: ATUL] reveals a structurally unlevered, cash-generative model currently navigating a capital-intensive phase. Over a 10-year horizon, consolidated revenue delivered an 8.56% Compound Annual Growth Rate (CAGR) scaling from $343.79 million to $719.93 million (₹6,273.54 crore) in segmented baseline reporting. EBITDA and Profit After Tax (PAT) tracked this trajectory at 9.13% ($141.60 million) and 8.78% ($79.06 million) CAGRs, respectively.
Operating metrics indicate a normalization of profitability. The EBITDA margin compressed from a historical FY21 peak of 27.34% to a structural baseline of 19.66%, while PAT margins recalibrated from a peak of 23.63% to a band between 10.78% and 10.98%. Consequently, capital efficiency has tightened: Return on Equity (ROE) compressed from a peak of 22.70% to 11.53%, and Return on Capital Employed (ROCE) moved from 35.53% to 16.94%. This compression is mathematically driven by declining asset velocity, with Asset Turnover dropping from 2.48x to 1.46x as the gross block scales faster than immediate revenue capture.
Despite ratio compression, cash conversion remains elite. Operating Cash Flow (OCF) to PAT conversion stands at 1.48x ($117.36 million OCF vs. $79.06 million PAT). The OCF-to-Revenue ratio improved from 13.22% a decade ago to 15.79%, underwriting approximately $117.39 million (₹1,023 crore) in Free Cash Flow (FCF) and maintaining a net borrowing position of merely $20.65 million against a $722.57 million total equity base.
Table 1: Segmental Revenue Matrix (FY2026)
| Business Segment | Products / Formulations | Revenue Capture | Volume Variance | Pricing / Revenue Variance |
|---|---|---|---|---|
| Life Science Chemicals (LSC) – 29% of Total Revenue | $207.13M | |||
| Crop Protection (Bulk Actives) | 36 Products / 46 Formulations | $83.19M | +8.0% | Pricing: +7.0% / Revenue: +16.0% |
| Crop Protection (Retail / B2C) | 59 Brands / 71 Products | $32.13M | +13.0% | Revenue: +9.0% |
| Pharma & Aromatics-I | 90 APIs / Intermediates | $68.28M | -7.0% | Revenue: -6.0% |
| Atul Bioscience Ltd. (ABL) | 48 DMFs (0 USFDA-483 Observations) | $16.98M / $20.73M | N/A | Revenue: +9.0% / PBT: $2.09M |
| Performance & Other Chemicals (POC) – 71% of Total Revenue | $503.53M | |||
| Polymers (Performance Materials) | 49 Synthetic Products / 202 Grades | $196.22M | N/A | Revenue: +18.0% |
| Polymers (Retail / Adhesives) | 236 Products | $34.88M | +25.0% | Revenue: +24.0% |
| Colors | 525 Products | $78.83M | N/A | Revenue: +9.0% |
| Aromatics-II | 45 Products | $92.95M | N/A | Revenue: -3.0% |
| Bulk Chemicals | 23 Products | $31.21M | N/A | Revenue: +8.0% |
| Atul Products Ltd. (APL) (Subsidiary) | Peak Capacity Utilization | $54.39M / $65.95M | N/A | Revenue: +35.0% / PBT: $7.79M |
Working Capital Velocity and Inventory Disclosures
The working capital cycle demonstrates deliberate supplier-financed liquidity. Days Sales Outstanding (DSO) expanded from 60 days to 72 days as standalone Trade Receivables reached $163.56 million (₹1,175.58 crore). To offset this, management extended Days Payable Outstanding (DPO) from 54 days to 68 days. Days Inventory Outstanding (DIO) stabilized between 47 to 52 days, constituting 13% to 14% of revenue.
Total consolidated inventory stands at $113.46 million (₹815.47 crore). Forensic inventory deconstruction reveals zero involuntary accumulation of finished goods; Finished Goods expanded by 10.6% ($42.90 million to $47.45 million), pacing slightly below the 12.3% consolidated revenue expansion ($776.84 million to $872.84 million). Work-In-Progress (WIP) velocity remained flat at $22.95 million (versus $23.16 million in FY25). Conversely, Raw Material and Packing Material inventories surged by 38.6% (from $23.28 million to $32.28 million) as a direct defensive hedge against Middle Eastern supply chain shocks.
Global Infrastructure Layout and Supply Chain Moats
Atul Ltd operates 8 physical manufacturing sites globally. The domestic base includes Atul, Ankleshwar, Panoli, Tarapur, Ambernath, and Jodhpur. The sole international manufacturing plant is operated by DPD Ltd in Somerset, UK.
Geographic revenue is anchored by the Indian domestic market at 58%. International sales (42%) are distributed across Asia excluding India (15%), North America (10%), Europe (9%), South America (5%), Africa (2%), and Australia (1%). International market penetration is executed via wholly owned subsidiaries: Atul China Ltd (Shanghai), Atul USA Inc (Charlotte), Atul Brasil Quimicos Ltda (São Paulo), Atul Europe Ltd (UK), Atul Ireland Ltd (Dublin), Atul Deutschland GmbH (Germany), and Atul Middle East FZ-LLC (Dubai). Note: All East Asian geographic designations strictly adhere to the UN 'Taiwan, China' standard.
The Total Addressable Market (TAM) parameters dictate capacity expansion. Atul targets the global p-Cresol market ($225 million by 2031, 3.5% CAGR), Resorcinol market ($440 million by 2025, 4.58% CAGR), and the vast Epoxy Resin market ($12.3 billion, 5.58% CAGR) supplemented by curing agents ($3.9 billion). The company services 4,000 customers across 32 industries, registering a customer quality complaint rate of 0.0009% and a 99.7% right-first-time production metric.
Table 2: Environmental & Industrial Infrastructure Targets (FY2025–26 Performance Data)
| Environmental & Industrial Infrastructure Targets | FY2025–26 Performance Data |
|---|---|
| Research & Development Framework | Total R&D investment: $4.36M / $4.64M (0.73% of standalone revenue). Infrastructure includes 10 laboratories and 233 R&D personnel. Achievements: 24 new products and 51 formulations commercialized. Intellectual property: 1 patent granted and 6 patent applications filed. R&D allocation: 60% near-term, 30% mid-term, and 10% long-term projects. Process optimization generated $1.00M in cost savings. |
| Energy Decarbonization & Consumption | Total energy consumption: 6,942,624 GJ. Energy intensity improved from 16.38 GJ/MT to 12.87 GJ/MT. Captive power capacity: 73 MW. Coal consumption declined 41.9%, from 247,243 MT to 143,503 MT. Renewable energy contribution increased from 1.93% to 3.11%. Hybrid wind-solar capacity expanded from 4.96 MW to 7.86 MW, supplemented by 450 kW rooftop solar capacity. Advanced steam recovery systems captured 32,816 MT of steam (89 tonnes/day), avoiding 4,000 MT of CO₂ emissions. Total utility costs were contained at 4% of revenue. |
| Emissions & Effluent Control | Scope 1 emissions: 405,558 tCO₂e (-38% YoY). Scope 2 emissions: 202,993 tCO₂e. Combined Scope 1 + Scope 2 emissions intensity: 1.06 tCO₂e/MT. Scope 3 emissions: 1,911,879 tCO₂e (3.54 tCO₂e/MT). Carbon reduction target: 41% reduction by 2030. Chlor-Alkali CCTS emission cap: 2.9134 tCO₂e/tonne. Effluent treatment infrastructure capacity: 33 MLD. Water intensity reduced by 16%, with 91% water recycling at Ankleshwar, resulting in a 37% reduction in freshwater consumption. Total waste recycled: 125,372.07 MT; waste incinerated: 1,208.43 MT. |
HDIN Institutional Verdict and Forward Capital Governance
HDIN’s forensic audit of the corporate umbrella exposes bifurcated subsidiary performance. The core 100%-owned entities act as debt-free cash engines: Atul USA Inc generated $66.24 million in revenue with a $1.44 million net profit, while Atul China Ltd procured $12.86 million in parent sales. However, specific joint ventures act as severe drags on consolidated ROCE. The 50% joint operation Anaven LLP (with Nouryon BV) reported a PBT loss of $5.01 million on $11.69 million in sales, defaulting on $4.00 million in obligations delayed by up to 821 days, forcing a 12-month extension on a $0.24 million tranche. Additionally, the non-core Valsad Institute of Medical Sciences operated at a 9% utilization rate, generating $2.78 million in sales with a PBT loss of $1.53 million.
The standalone parent acts as the primary procurement and manufacturing node, selling $82.05 million to subsidiaries (including $51.04 million to Atul USA Inc) while purchasing $44.57 million from backward-integrated entities (APL: $30.99 million, Amal Speciality Chemicals Ltd: $6.84 million). The Rudolf Atul Chemicals Ltd JV generated $18.67 million, yielding $10.20 million in goods procurement and up-streaming a $1.62 million dividend to the parent. Promoter entity transactions were contained at $0.07 million.
Capital deployment pipelines signal strict internal discipline. During FY26, the company deployed $16.18 million into fixed assets and $21.69 million into group investments. Unexecuted capital contracts stand at $6.73 million for property, plant, and equipment, with an additional $5.92 million (reported up to $7.18 million) in uncalled capital for unlisted entities. Off-balance-sheet exposure is isolated primarily to a $21.12 million corporate guarantee securing working capital for APL via HDFC Bank ($7.89 million) and Federal Bank ($13.23 million). Statutory disputes remain immaterial: Customs ($0.25 million), GST ($0.50 million), Labor ($0.46 million), and Income Tax ($0.13 million and a pending $0.87 million appeal).
Consolidated Capital Work-in-Progress (CWIP) remains tightly controlled at $12.64 million, with 63.4% ($8.01 million) aged under one year, and merely $2.06 million stalled beyond 3 years. Standalone CWIP declined from $10.48 million to $9.27 million, indicating rapid asset commercialization. Forward revenue target additions rely purely on asset optimization: management forecasts $50.03 million from existing capacity debottlenecking, $45.33 million from proprietary expansion, and $4.59 million from joint ventures, with a strategic mandate to scale B2B retail beyond its $13.88 million baseline.
Corporate governance is rigorously institutionalized. The 11-member Board features 7 Non-executive Directors (63.64% independent). Executive compensation remains conservative; Chairman Sunil Lalbhai’s pay ratio sits at 15.68x the median employee, while Managing Director Samveg Lalbhai’s ratio is 8.00x, with a base salary of $7,685.87 per month capped at $13,769.87. Capital expenditures between $0.57 million and $2.87 million are managed by the Investment Committee, with excesses escalated to the Board. Shareholder returns materialized via a 15% dividend payout ratio, escalating the distribution from $0.29 (₹25) to $0.34 (₹30) per share, resulting in a $10.14 million outflow against a $3.38 million equity base.
Presentation Download & Video Access:
- Presentation Download: Click the PDF download link under 'Related Topics' to access the full institutional presentation of this report.
- Video Link: Click this link to watch the HDIN analyst briefing on YouTube.
About HDIN Research:
HDIN Research is a premier global market intelligence and strategic advisory firm specializing in institutional-grade financial analysis, supply chain audits, and macroeconomic forecasting. Our dedicated sector analysts deliver actionable, data-driven insights tailored for private equity, hedge funds, and corporate strategy teams. Visit us at http://www.hdinresearch.com.
2026 AI Transparency Footer:
"This intelligence report was authored by HDIN Research analysts following a rigorous audit of official corporate filings. AI was utilized for massive-scale data synthesis and structural drafting, ensuring 100% inclusion of reported data points. All strategic insights, financial modeling, and final verdicts were verified by our editorial board to ensure professional accuracy and compliance with 2026 Google Search E-E-A-T standards."