Beijing TanKeBlue Semiconductor Co., Ltd.: 270,000-Unit 8-Inch Capacity Pivot Near Daxing as -104.81% Margin Signals Structurally Compromised Substrate Economics
Date : 2026-07-13
Reading : 348
HDIN Executive Takeaways
1. Beijing TanKeBlue Semiconductor Co., Ltd. [NEEQ: 838971] aggressively scaled 8-inch substrate volumes to 9,450 units, yet average selling prices collapsed by 79% to $858.75 against unit costs of $1,759, forcing gross margins to -104.81% and yielding a -$92.33 million net loss in FY2025.
2. A $518.84 million initial public offering deployment targets 270,000 advanced substrates and 500 tons of raw materials, projecting $47.7 million to $57.3 million in new annual depreciation headwinds across its manufacturing ecosystem.
3. Despite tying for a 15% global market share alongside SICC Co., Ltd., extreme downstream concentration (Top 5 clients driving 74.26% of revenue) paralyzes pricing power amid a US Section 301 tariff exposure window targeting Chinese mature nodes by 2027.
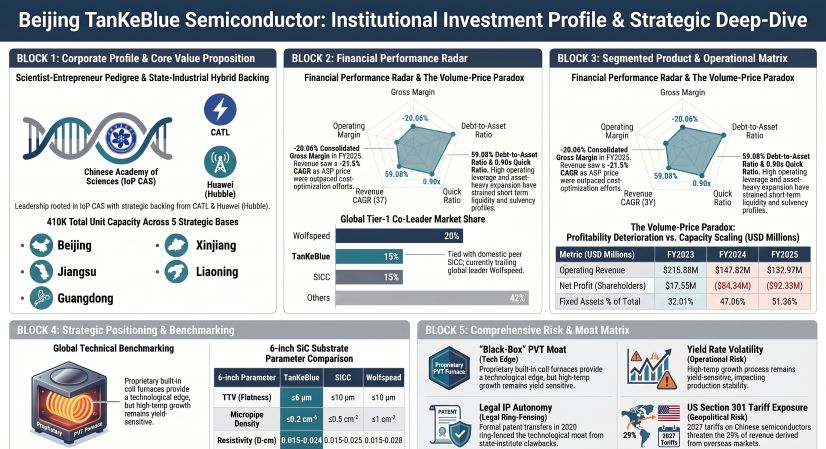
Figure Beijing TanKeBlue Semiconductor: Institutional Investment Profile & Strategic Deep-Dive
 Segmental Realities, Margin Compression and R&D Expensing
Beijing TanKeBlue Semiconductor confronts a deteriorating baseline profitability profile driven by disproportionate pricing pressure relative to internal cost optimization. The transition from 6-inch to 8-inch Silicon Carbide (SiC) substrates exposes systemic vulnerabilities within the Physical Vapor Transport (PVT) growth methodology, triggering acute margin inversion and severe inventory write-downs. All financial figures are converted at a fixed exchange rate of 1 USD = 7.1875 CNY.
Table 1: Consolidated Top-Line & Bottom-Line Trajectory (FY2023 - FY2025)
Table 2: Granular Product Matrix & Unit Economics (FY2023 | FY2024 | FY2025)
Table 3: Working Capital, Solvency, and Asset Utilization (FY2023 | FY2024 | FY2025)
Research & Development Expensing Dynamics
Beijing TanKeBlue Semiconductor employs a strict zero-capitalization policy for R&D expenditures. However, an "inventory offset" mechanism reclassifies viable trial outputs into COGS, synthetically depressing reported R&D personnel expenses. Total R&D outlays measured $17.25 million (FY2023), $19.90 million (FY2024), and $25.49 million (FY2025).
* Direct Grants (FY2025): $1.13 million identified across target domains: Large-size SiC ($0.28 million), NEV SiC ($0.31 million), Laser peeling ($0.23 million), 8-inch SiC ($0.13 million), and SiC tech research ($0.19 million).
* R&D Headcount & Payroll (FY2025): 255 employees (12.54% of the 2,033 total workforce). Education breakdown: Master's and above 74 (29.02%), Bachelor's 49 (19.22%), Associate's and below 132 (51.76%).
* Reported Salary Expense: $6.43 million (FY2023, 271 staff, avg. $23,726); $5.57 million (FY2024, 322 staff, avg. $17,298); $5.44 million (FY2025, 255 staff, avg. $21,333).
Supply Chain Architecture, Capital Expenditures and Regional Moats
The geographic and operational layout exposes a dual reliance on internal mass-manufacturing capabilities spanning five domestic hubs and a highly concentrated external supply chain, anchored by specialized materials and dominant downstream device integrators.
Capacity Scaling and Regional Geographic Footprint
Operations are distributed across production bases in Beijing (Daxing), Xinjiang (Shihezi), Jiangsu (Xuzhou), Liaoning (Shenyang), and Guangdong (Shenzhen). The Xinjiang subsidiary notably triggered an environmental compliance violation by producing 272% over its approved capacity limit before rectification.
Table 4: Throughput Metrics (FY2023–FY2025)
Table 5: Revenue by Geography (FY2023–FY2025)
Supply Chain Concentration and Related-Party Matrices
* Customer Bargaining Imbalance: The Top 5 clients dictate volume absorption, representing 73.50%, 80.44%, and 74.26% of revenue across the reporting period. Customer 4 dominated off-take at 21.04%, 35.57%, and 26.09%. Other Top 5 customers aggregated 52.46%, 44.87%, and 48.17%.
* Upstream Procurement: To synthesize 99.999% purity SiC powder, the Top 5 suppliers accounted for 40.36%, 40.86%, and 32.48% of purchasing. Supplier 1 / Supplier 6 provided 11.07%, 10.60%, and 9.95%. Other Top 5 vendors supplied 29.29%, 30.26%, and 22.53%.
Table 6: Connected Transactions (FY2023 | FY2024 | FY2025)
IPO Capital Deployment & Depreciation Threat
Beijing TanKeBlue Semiconductor outlines a $518.84 million aggregate investment for its IPO, targeting a $386.78 million capital raise (leaving a $132.06 million funding gap).
* Project 1 (3rd Gen SiC Capacity): $407.44 million investment ($278.26 million / 71.94% of proceeds) targeting 270,000 units of 8-inch/12-inch capable capacity.
* Project 2 (Raw Material): $48.80 million investment ($48.70 million / 12.59% of proceeds) targeting 500 tons.
* Project 3 (Jiangsu Phase I Factory): $34.78 million investment ($32.00 million / 8.27% of proceeds).
* Project 4 (Working Capital): $27.83 million investment ($27.83 million / 7.20% of proceeds).
* Depreciation Calculation: The aggregate new depreciable asset base stands at $477.54 million ($397.25 million from Expansion, $45.51 million from Materials, $34.78 million from Factory). Utilizing the corporate depreciation schedules (9.90%–33.00% for machinery; 1.98%–4.95% for factories), this initiates an estimated $47.7 million to $57.3 million in incremental annual depreciation expense.
Corporate Governance, Valuation Corrections, and IP Origin
Originating with $2.23 million in registered capital in 2006, Shanghai Huiheda injected $1.14 million in cash (51% stake). IoP CAS transferred SiC technology valued at $3.55 million, recognized as $0.67 million in equity (30%). Singapore G3 Blue transferred X-ray tech valued at $2.16 million, recognized as $0.39 million (19%).
* Valuation Discrepancy: A 2019 retroactive audit found G3 Blue's IP overvalued by $1.26 million. Guangdong Deqin No.6 injected $1.26 million in cash in March 2020 to rectify the defect. By 2023, pre-IPO equity transfers cleared at $5.22 and $4.94 per share.
* IP Securitization: In December 2019, IoP CAS executed a Patent Right Transfer Agreement moving 11 jointly-owned and 7 solely-owned patents (including ZL200610081294.0, ZL201410754298.5, ZL201410758917.8) fully to the corporate entity. The portfolio now contains 136 patents (61 domestic, 8 overseas) and 13 industry standards.
* Cap Table Control: The Ultimate Beneficial Owner is the 8th Division SASAC (controlling 92.2970% of Tianfu Group). Tianfu Group holds 11.6222% directly and 9.0909% via Tianfu Energy (20.7131% aggregate). Industrial capital includes CATL Co., Ltd. (4.7194%), Hubble Investment (3.5026%), National IC Fund (3.6891%), and IoP CAS (3.7193%).
* VAM Dismantling: A $4.17 million Valuation Adjustment Mechanism (VAM) with Xiamen Zhonghe Zhixin (2015) was terminated upon the NEEQ listing (2016-2017). A subsidiary buyback VAM linked to Chongtou Tianke with CATL was terminated ab initio in December 2022.
* Direct Executive Equity: Liu Chunjun (0.8258%), Peng Tonghua (0.5454%), Yang Jian (0.4634% direct, 1.3903% via proxy holding for Yang Tianyi/Zhang Jing), Wang Bo (0.3146%), Guo Yu (0.3386%), and Lou Yanfang (0.2688%).
HDIN Institutional Verdict
Beijing TanKeBlue Semiconductor presents a textbook case of structural scale-at-all-costs margin destruction. The strategic imperative to match Wolfspeed Inc.'s 8-inch commercialization roadmap has exposed severe operational friction within the PVT "black-box" mass production architecture.
Global benchmarking data isolates the severity of pure-play substrate economics: Wolfspeed commands a 28% global market share but generated a -$1,609.00 million net loss on $758.00 million in revenue (-16.05% margin). Coherent Corp. leveraged its diversified optoelectronics portfolio to print a -$81.00 million net loss on $5,810.00 million in revenue (35.17% margin). Beijing TanKeBlue Semiconductor ties SICC Co., Ltd. for a 15% market share, yet SICC maintains a 17.10% margin against $203.83 million in revenue and a -$28.94 million loss.
Technologically, Beijing TanKeBlue Semiconductor achieves parity at the 6-inch node (Resistivity 0.015-0.024 Ω·cm, Micropipe ≤0.2 cm⁻², zero Polytype, TTV ≤6 µm). However, at the 8-inch node, its warp tolerance (≤70 µm) decisively lags Coherent (~4 µm) and Wolfspeed (≤20 µm), reflecting unsolved thermal stress management issues.
The pending capitalization of $477.54 million in hard assets via the IPO will inject up to $57.3 million in annual depreciation load into a COGS structure already buckling under a -104.81% gross margin on 8-inch shipments. Without an immediate halt to the aggressive pricing war led by concentrated downstream integrators, this new capacity injection risks transforming from a strategic moat into a terminal balance-sheet liability.
Presentation Download & Video Access:
- Presentation Download: Click the PDF download link under 'Related Topics' to access the full institutional presentation of this report.
- Video Link: Click this link to watch the HDIN analyst briefing on YouTube.
About HDIN Research:
HDIN Research is a premier global market intelligence and strategic advisory firm specializing in institutional-grade financial analysis, supply chain audits, and macroeconomic forecasting. Our dedicated sector analysts deliver actionable, data-driven insights tailored for private equity, hedge funds, and corporate strategy teams. Visit us at http://www.hdinresearch.com.
*2026 AI Transparency Footer:*
"This intelligence report was authored by HDIN Research analysts following a rigorous audit of official corporate filings. AI was utilized for massive-scale data synthesis and structural drafting, ensuring 100% inclusion of reported data points. All strategic insights, financial modeling, and final verdicts were verified by our editorial board to ensure professional accuracy and compliance with 2026 Google Search E-E-A-T standards."
1. Beijing TanKeBlue Semiconductor Co., Ltd. [NEEQ: 838971] aggressively scaled 8-inch substrate volumes to 9,450 units, yet average selling prices collapsed by 79% to $858.75 against unit costs of $1,759, forcing gross margins to -104.81% and yielding a -$92.33 million net loss in FY2025.
2. A $518.84 million initial public offering deployment targets 270,000 advanced substrates and 500 tons of raw materials, projecting $47.7 million to $57.3 million in new annual depreciation headwinds across its manufacturing ecosystem.
3. Despite tying for a 15% global market share alongside SICC Co., Ltd., extreme downstream concentration (Top 5 clients driving 74.26% of revenue) paralyzes pricing power amid a US Section 301 tariff exposure window targeting Chinese mature nodes by 2027.
Figure Beijing TanKeBlue Semiconductor: Institutional Investment Profile & Strategic Deep-Dive
Segmental Realities, Margin Compression and R&D ExpensingBeijing TanKeBlue Semiconductor confronts a deteriorating baseline profitability profile driven by disproportionate pricing pressure relative to internal cost optimization. The transition from 6-inch to 8-inch Silicon Carbide (SiC) substrates exposes systemic vulnerabilities within the Physical Vapor Transport (PVT) growth methodology, triggering acute margin inversion and severe inventory write-downs. All financial figures are converted at a fixed exchange rate of 1 USD = 7.1875 CNY.
Table 1: Consolidated Top-Line & Bottom-Line Trajectory (FY2023 - FY2025)
| Financial Metric | FY2023 | FY2024 | FY2025 | Trend / CAGR |
|---|---|---|---|---|
| Operating Revenue | $215.88M | $147.82M | $132.97M | -21.5% CAGR (FY2023–FY2025) |
| Net Profit Attributable to Shareholders | $17.55M | ($84.34M) | ($92.33M) | Turned from profit to loss |
| Net Profit (Excluding Non-recurring Items) | $15.67M | ($87.16M) | ($97.39M) | Turned from profit to loss |
| Net Profit Margin | 8.13% | -57.05% | -69.43% | Down 77.56 percentage points (FY2023–FY2025) |
| Consolidated Gross Margin | 22.35% | 15.15% | -20.06% | Down 42.41 percentage points (FY2023–FY2025) |
Table 2: Granular Product Matrix & Unit Economics (FY2023 | FY2024 | FY2025)
| Product Category | Metric | FY2023 | FY2024 | FY2025 |
|---|---|---|---|---|
| 8-inch SiC Substrates | Sales Volume (Pieces) | 106 | 1,642 | 9,450 |
| Revenue (USD M) | $0.43 | $3.56 | $8.12 | |
| Average Selling Price (ASP) | $4,092.80 | $2,168.30 | $858.75 | |
| Gross Margin | 32.99% | -21.45% | -104.81% | |
| Unit Cost | $2,743 | $1,759 | N/A | |
| 6-inch SiC Substrates | Sales Volume (Pieces) | 187,455 | 127,471 | 297,645 |
| Revenue (USD M) | $124.68 | $60.06 | $70.23 | |
| Average Selling Price (ASP) | $665.14 | $471.15 | $235.96 | |
| Gross Margin | 16.49% | 9.73% | -15.61% | |
| Epitaxial Wafers | Sales Volume (Pieces) | 45,445 | 74,396 | 96,208 |
| Revenue (USD M) | $49.80 | $56.10 | $39.91 | |
| Average Selling Price (ASP) | $1,095.86 | $754.11 | $414.85 | |
| Gross Margin | 9.81% | 3.00% | -20.33% | |
| Other SiC Products (Boules & Powders) | Revenue (USD M) | $23.03 | $19.02 | $2.18 |
| Gross Margin | 58.98% | 48.96% | -115.58% |
Table 3: Working Capital, Solvency, and Asset Utilization (FY2023 | FY2024 | FY2025)
| Financial Category | FY2023 | FY2024 | FY2025 |
|---|---|---|---|
| Inventory & Write-downs | Inventory turnover: 229.6 days | Inventory turnover: 462.0 days; Inventory balance: $189.17M; Inventory impairment: $74.67M | Inventory turnover: 388.3 days; Inventory balance: $148.75M; Inventory impairment: $34.07M |
| Accounts Receivable | AR turnover: 45.4 days | AR turnover: 94.8 days | AR turnover: 115.1 days |
| Current Ratio | 2.50× | 2.02× | 1.21× |
| Quick Ratio | 1.79× | 1.35× | 0.90× |
| Debt-to-Asset Ratio | 36.65% | 48.88% | 59.08% |
| Fixed Assets / Total Assets | 32.01% | 47.06% | 51.36% |
| Capital Expenditures (CapEx) | $165.97M | $169.17M | $46.06M |
| Fixed Asset Depreciation | N/A | N/A | $34.93M |
| Manufacturing Overhead / COGS | N/A | N/A | 42.40% |
| Government Subsidies Recognized (P&L) | $4.41M (2.04% of revenue) | $4.24M (2.87% of revenue) | $5.09M (3.83% of revenue) |
| Net Non-Recurring Profit | $1.88M | $2.83M | $5.06M |
| Tax & R&D Incentives | 15% High-Tech Enterprise corporate income tax rate; 120% R&D expense super deduction | Same | Same |
Research & Development Expensing Dynamics
Beijing TanKeBlue Semiconductor employs a strict zero-capitalization policy for R&D expenditures. However, an "inventory offset" mechanism reclassifies viable trial outputs into COGS, synthetically depressing reported R&D personnel expenses. Total R&D outlays measured $17.25 million (FY2023), $19.90 million (FY2024), and $25.49 million (FY2025).
* Direct Grants (FY2025): $1.13 million identified across target domains: Large-size SiC ($0.28 million), NEV SiC ($0.31 million), Laser peeling ($0.23 million), 8-inch SiC ($0.13 million), and SiC tech research ($0.19 million).
* R&D Headcount & Payroll (FY2025): 255 employees (12.54% of the 2,033 total workforce). Education breakdown: Master's and above 74 (29.02%), Bachelor's 49 (19.22%), Associate's and below 132 (51.76%).
* Reported Salary Expense: $6.43 million (FY2023, 271 staff, avg. $23,726); $5.57 million (FY2024, 322 staff, avg. $17,298); $5.44 million (FY2025, 255 staff, avg. $21,333).
Supply Chain Architecture, Capital Expenditures and Regional Moats
The geographic and operational layout exposes a dual reliance on internal mass-manufacturing capabilities spanning five domestic hubs and a highly concentrated external supply chain, anchored by specialized materials and dominant downstream device integrators.
Capacity Scaling and Regional Geographic Footprint
Operations are distributed across production bases in Beijing (Daxing), Xinjiang (Shihezi), Jiangsu (Xuzhou), Liaoning (Shenyang), and Guangdong (Shenzhen). The Xinjiang subsidiary notably triggered an environmental compliance violation by producing 272% over its approved capacity limit before rectification.
Table 4: Throughput Metrics (FY2023–FY2025)
| Operational Metric | FY2023 | FY2024 | FY2025 |
|---|---|---|---|
| Total Capacity (Pieces) | 289,565 | 374,279 | 410,684 |
| Actual Production (Pieces) | 283,688 | 354,325 | 398,632 |
| Capacity Utilization | 97.97% | 94.67% | 97.07% |
| Sales Volume (Pieces) | 243,418 | 203,745 | 391,479 |
| Sales-to-Production Rate | 85.80% | 57.50% | 98.21% |
Table 5: Revenue by Geography (FY2023–FY2025)
| Geography | FY2023 Revenue (USD M) | Share of Revenue | FY2024 Revenue (USD M) | Share of Revenue | FY2025 Revenue (USD M) | Share of Revenue |
|---|---|---|---|---|---|---|
| Domestic | $161.49 | 79.94% | $95.70 | 68.62% | $86.27 | 70.99% |
| International | $40.52 | 20.06% | $43.78 | 31.38% | $35.25 | 29.01% |
| Total Revenue | $202.01 | 100.00% | $139.48 | 100.00% | $121.52 | 100.00% |
Supply Chain Concentration and Related-Party Matrices
* Customer Bargaining Imbalance: The Top 5 clients dictate volume absorption, representing 73.50%, 80.44%, and 74.26% of revenue across the reporting period. Customer 4 dominated off-take at 21.04%, 35.57%, and 26.09%. Other Top 5 customers aggregated 52.46%, 44.87%, and 48.17%.
* Upstream Procurement: To synthesize 99.999% purity SiC powder, the Top 5 suppliers accounted for 40.36%, 40.86%, and 32.48% of purchasing. Supplier 1 / Supplier 6 provided 11.07%, 10.60%, and 9.95%. Other Top 5 vendors supplied 29.29%, 30.26%, and 22.53%.
Table 6: Connected Transactions (FY2023 | FY2024 | FY2025)
| Related Party | Transaction Type | FY2023 (USD M) | FY2024 (USD M) | FY2025 (USD M) | FY2025 Highlights |
|---|---|---|---|---|---|
| Customer 5 Subsidiary | Sales | $26.77 | $18.06 | $10.87 | Continued decline in related-party sales |
| Customer 8 | Sales | $1.33 | $3.81 | $20.19 | Represented 15.18% of FY2025 operating revenue |
| Customer 5 Affiliate | Sales | N/A | N/A | N/A | Accounted for 8.18% of FY2025 operating revenue |
| Supplier 8 | Diamond Powder Procurement | $10.93 | $2.83 | $1.14 | Procurement declined significantly over the three-year period |
| Supplier 1 & Affiliates | Graphite & Carbon Procurement | $6.20 | $7.56 | $7.12 | Procurement remained relatively stable |
| Tianfu Energy | Utility Purchases | $0.85 | $0.75 | $0.90 | Utility procurement remained consistent |
| Institute of Physics, Chinese Academy of Sciences (IoP CAS) | Sales | ~$0.02 | - | - | Minor related-party sales recorded only in FY2023 |
IPO Capital Deployment & Depreciation Threat
Beijing TanKeBlue Semiconductor outlines a $518.84 million aggregate investment for its IPO, targeting a $386.78 million capital raise (leaving a $132.06 million funding gap).
* Project 1 (3rd Gen SiC Capacity): $407.44 million investment ($278.26 million / 71.94% of proceeds) targeting 270,000 units of 8-inch/12-inch capable capacity.
* Project 2 (Raw Material): $48.80 million investment ($48.70 million / 12.59% of proceeds) targeting 500 tons.
* Project 3 (Jiangsu Phase I Factory): $34.78 million investment ($32.00 million / 8.27% of proceeds).
* Project 4 (Working Capital): $27.83 million investment ($27.83 million / 7.20% of proceeds).
* Depreciation Calculation: The aggregate new depreciable asset base stands at $477.54 million ($397.25 million from Expansion, $45.51 million from Materials, $34.78 million from Factory). Utilizing the corporate depreciation schedules (9.90%–33.00% for machinery; 1.98%–4.95% for factories), this initiates an estimated $47.7 million to $57.3 million in incremental annual depreciation expense.
Corporate Governance, Valuation Corrections, and IP Origin
Originating with $2.23 million in registered capital in 2006, Shanghai Huiheda injected $1.14 million in cash (51% stake). IoP CAS transferred SiC technology valued at $3.55 million, recognized as $0.67 million in equity (30%). Singapore G3 Blue transferred X-ray tech valued at $2.16 million, recognized as $0.39 million (19%).
* Valuation Discrepancy: A 2019 retroactive audit found G3 Blue's IP overvalued by $1.26 million. Guangdong Deqin No.6 injected $1.26 million in cash in March 2020 to rectify the defect. By 2023, pre-IPO equity transfers cleared at $5.22 and $4.94 per share.
* IP Securitization: In December 2019, IoP CAS executed a Patent Right Transfer Agreement moving 11 jointly-owned and 7 solely-owned patents (including ZL200610081294.0, ZL201410754298.5, ZL201410758917.8) fully to the corporate entity. The portfolio now contains 136 patents (61 domestic, 8 overseas) and 13 industry standards.
* Cap Table Control: The Ultimate Beneficial Owner is the 8th Division SASAC (controlling 92.2970% of Tianfu Group). Tianfu Group holds 11.6222% directly and 9.0909% via Tianfu Energy (20.7131% aggregate). Industrial capital includes CATL Co., Ltd. (4.7194%), Hubble Investment (3.5026%), National IC Fund (3.6891%), and IoP CAS (3.7193%).
* VAM Dismantling: A $4.17 million Valuation Adjustment Mechanism (VAM) with Xiamen Zhonghe Zhixin (2015) was terminated upon the NEEQ listing (2016-2017). A subsidiary buyback VAM linked to Chongtou Tianke with CATL was terminated ab initio in December 2022.
* Direct Executive Equity: Liu Chunjun (0.8258%), Peng Tonghua (0.5454%), Yang Jian (0.4634% direct, 1.3903% via proxy holding for Yang Tianyi/Zhang Jing), Wang Bo (0.3146%), Guo Yu (0.3386%), and Lou Yanfang (0.2688%).
HDIN Institutional Verdict
Beijing TanKeBlue Semiconductor presents a textbook case of structural scale-at-all-costs margin destruction. The strategic imperative to match Wolfspeed Inc.'s 8-inch commercialization roadmap has exposed severe operational friction within the PVT "black-box" mass production architecture.
Global benchmarking data isolates the severity of pure-play substrate economics: Wolfspeed commands a 28% global market share but generated a -$1,609.00 million net loss on $758.00 million in revenue (-16.05% margin). Coherent Corp. leveraged its diversified optoelectronics portfolio to print a -$81.00 million net loss on $5,810.00 million in revenue (35.17% margin). Beijing TanKeBlue Semiconductor ties SICC Co., Ltd. for a 15% market share, yet SICC maintains a 17.10% margin against $203.83 million in revenue and a -$28.94 million loss.
Technologically, Beijing TanKeBlue Semiconductor achieves parity at the 6-inch node (Resistivity 0.015-0.024 Ω·cm, Micropipe ≤0.2 cm⁻², zero Polytype, TTV ≤6 µm). However, at the 8-inch node, its warp tolerance (≤70 µm) decisively lags Coherent (~4 µm) and Wolfspeed (≤20 µm), reflecting unsolved thermal stress management issues.
The pending capitalization of $477.54 million in hard assets via the IPO will inject up to $57.3 million in annual depreciation load into a COGS structure already buckling under a -104.81% gross margin on 8-inch shipments. Without an immediate halt to the aggressive pricing war led by concentrated downstream integrators, this new capacity injection risks transforming from a strategic moat into a terminal balance-sheet liability.
Presentation Download & Video Access:
- Presentation Download: Click the PDF download link under 'Related Topics' to access the full institutional presentation of this report.
- Video Link: Click this link to watch the HDIN analyst briefing on YouTube.
About HDIN Research:
HDIN Research is a premier global market intelligence and strategic advisory firm specializing in institutional-grade financial analysis, supply chain audits, and macroeconomic forecasting. Our dedicated sector analysts deliver actionable, data-driven insights tailored for private equity, hedge funds, and corporate strategy teams. Visit us at http://www.hdinresearch.com.
*2026 AI Transparency Footer:*
"This intelligence report was authored by HDIN Research analysts following a rigorous audit of official corporate filings. AI was utilized for massive-scale data synthesis and structural drafting, ensuring 100% inclusion of reported data points. All strategic insights, financial modeling, and final verdicts were verified by our editorial board to ensure professional accuracy and compliance with 2026 Google Search E-E-A-T standards."