20 Microns Limited: Backward Integration Pivot in Malaysia as 84.2% Cash Conversion Signals Post-Expansion Harvest Phase
Date : 2026-07-14
Reading : 125
HDIN Market Intelligence Brief
1. 20 Microns Limited [NSE: 20MICRONS] achieved an 84.2% EBITDA-to-operating cash flow conversion in FY26, generating $11.89 million in OCF, a 225% increase driven by tighter working capital management and reduced capital intensity.
2. The firm is executing a $11.47 million CapEx program over 24 months, earmarking 15% for energy optimization and bio-methanation to combat volatile power tariffs and support a 15% carbon reduction target.
3. Backward integration via 100% equity acquisitions in Malaysian quarries (GTLQ and IQ Marble) de-risks raw material procurement, supporting a "China+1" export positioning strategy.
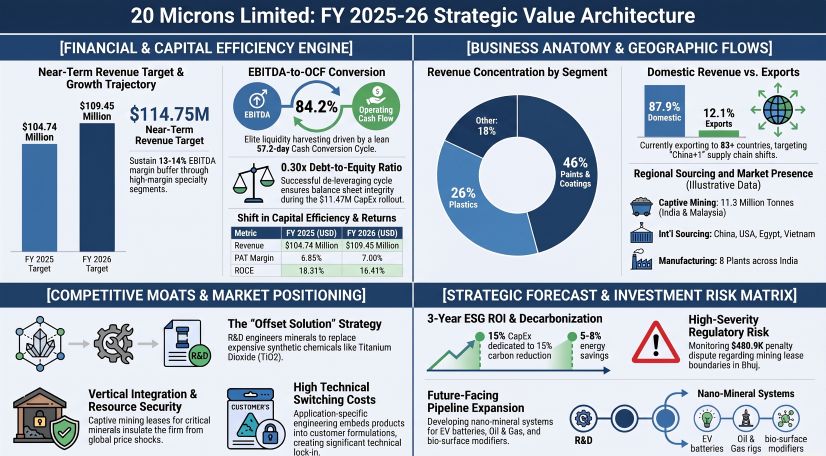
Figure 20 Microns Limited: FY 2025-26 Strategic Value Architecture
 Segmental Realities and Margin Optimization Performance
The financial profile of 20 Microns Limited is evaluated as a single operating segment: Industrial Micronized Minerals and Specialty Chemicals. Total consolidated revenue from operations stood at $109.45 million (₹95,383.26 Lakhs) in FY26, representing a 4.50% year-over-year (YoY) expansion compared to $104.74 million (₹91,278.52 Lakhs) in FY25.
Consolidated EBITDA grew by 4.85% YoY to $14.12 million (₹12,308.61 Lakhs), maintaining a stable EBITDA margin of 12.90%. Profit After Tax (PAT) from continuing operations grew by 6.70% YoY to $7.65 million (₹6,667.00 Lakhs), yielding a net profit margin of 7.00%. The company’s DuPont net profit ratio expanded to 6.99% in FY26 from 6.85% in FY25, while its standalone net profit reached $7.67 million (₹6,682.56 Lakhs).
Revenue Mix by End-Use Application Vertical
* Paints, Coatings & Printing Inks: 46% of total revenue. Functions as the largest vertical, focusing on Titanium Dioxide (TiO2) replacement, opacity enhancement, and rheological modification.
* Plastics & Polymers: 26% of total revenue. Consists of engineered fillers, flame retardants, and processing aids for PVC, masterbatches, and EV battery applications.
* Rubber: 10% of total revenue. Consists of engineered fillers and activators targeting partial replacement of carbon black and silica.
* Ceramics: 5% of total revenue. Comprises hydrous and calcined kaolin applications.
* Paper: 4% of total revenue. Anchored by barrier-enhancing talc.
* Others: 9% of total revenue. Consists of B2C Construction Chemicals (20 MCC division) and mineral-based fertilizers (MinFert division), providing a high-margin cyclical buffer.
Geographic Revenue Distribution
* Domestic Market (India): $96.19 million (₹83,826.57 Lakhs), representing 87.9% of the consolidated top line.
* International Markets: $12.29 million (₹10,711.65 Lakhs), representing 12.1% of consolidated revenue, covering exports to over 83 countries.
Operating Cost Structure Breakdown
* Cost of Materials Consumed: $56.61 million (₹49,336.85 Lakhs), representing 51.72% of operational revenue.
* Freight & Handling Expenses: $13.79 million (12.60% of revenue), split between domestic logistics of $11.62 million (₹10,127.09 Lakhs) and export logistics of $2.17 million (₹1,891.26 Lakhs).
* Employee Benefit Expenses: $9.76 million (₹8,508.23 Lakhs), representing 8.92% of revenue. The workforce consists of 413 permanent employees and 43 dedicated R&D personnel.
* Power and Fuel Costs: $6.35 million (₹5,538.27 Lakhs), representing 5.81% of revenue.
* Finance Costs: $1.97 million (₹1,714.15 Lakhs), representing 1.80% of revenue.
Working Capital Metrics (365-Day Cycle Assessment)
The consolidated cash conversion cycle (CCC) was calculated at approximately 57.2 days, reflecting high working capital velocity and zero evidence of cash trapping:
* Inventory Days: 44.1 days, supported by an accelerated inventory turnover ratio of 8.27x in FY26.
* Receivable Days: 61.2 days, based on a trade receivables turnover ratio of 5.96x.
* Payable Days: 48.1 days, backed by a trade payables turnover ratio of 7.59x.
Supply Chain Architecture, Capital Expenditures, and ESG Allocations
The supply chain of 20 Microns Limited relies on captive domestic mineral reserves, supplemented by international quarrying assets. The company's physical infrastructure includes 8 manufacturing plants across India (located in Bhuj, Hosur, Nagor, Haldwani, Tirunelveli, Alwar, Udaipur, and Parbatsar-Makrana) and 13 distribution warehouses. Captive mining capacity holds 11.3 Million tonnes of reserves, encompassing China Clay, Dolomite, Calcite, and Limestone across Gujarat, Rajasthan, Andhra Pradesh, and Tamil Nadu.
Sourcing Architecture & Joint Ventures
* Sourcing Footprint: 69% of raw materials are sourced domestically. Strategic imports are sourced from China, USA, Egypt, Vietnam, and Malaysia.
* Malaysian Backward Integration: The company acquired 100% equity in GTLQ SDN BHD and IQ Marble SDN BHD (Malaysia). Management targets an extraction capacity of 92,000 MTPA and processing capacity of 108,000 MTPA at these sites by FY30.
* Sievert Joint Venture: Plant capacity targets 22,500 MTPA by FY29. The parent company extended a $229.5K (₹200 Lakhs) inter-corporate loan to support development.
R&D Pipeline & Commercialized Innovations
R&D operations are centered at the DSIR-certified Waghodia facility in Vadodara, employing 35 scientists and engineers. Total R&D spend for FY26 was $267.36K (₹2.33 Crores), or 0.24% of operational revenue. This program utilizes a 6-stage innovation framework, commercializing four major functional products in FY26:
* TALC HFM 25 SD: A spray-dried anti-blocking solution for plastic films.
* White Kaolin Cosmetic Grade: Premium minerals targeting personal care and cosmetic applications.
* HYPERTHERM UT: An infrared management additive for agricultural greenhouse films.
* HYDROXYLGEL A1: A surface-engineered rheology modifier for coatings and construction chemicals.
Energy and ESG Capital Spending
* Waste-to-Fuel Bio-Methanation: The firm processes organic waste into biogas, upgraded to CNG and Compressed Bio Gas (CBG) to reduce reliance on furnace oil.
* CapEx Allocation: Out of the planned $11.47 million (₹100 Crore) CapEx pipeline deployed over 24 months, 15% ($1.72 million) is earmarked for green manufacturing and energy optimization. This investment targets a 15% reduction in carbon emissions over three years, which is projected to yield 5% to 8% in direct energy cost savings.
* CSR Allocation: Out of a statutory gross requirement of $161.14K (₹140.43 Lakhs), the firm spent $127.03K (₹110.70 Lakhs). The $33.32K (₹29.04 Lakhs) shortfall was offset using eligible excess CSR expenditures from prior fiscal years.
HDIN Institutional Verdict on Structural Transition and Regulatory Overhangs
An analysis of the balance sheet confirms that 20 Microns Limited is in a capital-harvesting phase. The reduction in CapEx from $8.80 million in FY25 to $3.02 million in FY26, combined with an 84.2% EBITDA-to-OCF conversion rate, demonstrates disciplined operational execution. The contraction in ROE (to 14.60%) and ROCE (to 16.41%) does not indicate deteriorating core profitability; instead, it reflects a lower equity multiplier from active debt reduction (debt-to-equity down to 0.30x) and the asset-velocity dilution of newly capitalized PPE.
The company's "offset solution" R&D strategy reduces its vulnerability to cheap imports. By co-engineering functional mineral additives that partially substitute expensive primary chemicals like TiO2 and carbon black, the company embeds itself directly into customer formulations, creating high switching costs.
However, several risk factors require monitoring by institutional investors:
* Customer Concentration: The company is exposed to customer concentration, with two tier-1 clients representing $26.51 million (₹23,102.03 Lakhs) or 24.2% of total consolidated revenue.
* Off-Balance Sheet Exposures: Consolidated contingent liabilities increased to $1.10 million (₹957.09 Lakhs) in FY26 from $968K in FY25.
* Mining Boundary Penalties: A dispute with the Geology and Mining Department involves a $480.9K (₹419.13 Lakhs) penalty for alleged over-extraction at Survey No. 483 in Mamuara, Bhuj. While the Commissioner has directed a reassessment, this remains a material, unprovisioned contingent liability.
* Statutory and Labor Claims: The firm is defending $277.9K (₹242.17 Lakhs) in labor disputes in the High Court of Gujarat. Standalone statutory claims total $512.81K (₹446.90 Lakhs), alongside direct tax claims of $227.4K (₹198.19 Lakhs) and indirect tax claims of $27.6K (₹24.02 Lakhs).
* Supreme Court Appellate Litigation: The NSE is appealing a SAT order that refunded governance fines levied on the company regarding the statutory age limit of former Independent Director Dr. Swaminathan Sivaram.
* Conservative Payout Model: Against a standalone PAT of $7.67 million, the total dividend payout of $506.13K (₹441.08 Lakhs)—representing a flat YoY dividend of $0.014 (₹1.25) per equity share—results in a low payout ratio of 6.6%. While this conservative approach supports the self-funded $11.47 million CapEx pipeline, it limits short-term shareholder yields.
Presentation Download & Video Access:
Presentation Download: Click the PDF download link under 'Related Topics' to access the full institutional presentation of this report.
Video Link: Click this link to watch the HDIN analyst briefing on YouTube.
About HDIN Research:
HDIN Research is a premier global market intelligence and strategic advisory firm specializing in institutional-grade financial analysis, supply chain audits, and macroeconomic forecasting. Our dedicated sector analysts deliver actionable, data-driven insights tailored for private equity, hedge funds, and corporate strategy teams. Visit us at http://www.hdinresearch.com.
2026 AI Transparency Footer:
"This intelligence report was authored by HDIN Research analysts following a rigorous audit of official corporate filings. AI was utilized for massive-scale data synthesis and structural drafting, ensuring 100% inclusion of reported data points. All strategic insights, financial modeling, and final verdicts were verified by our editorial board to ensure professional accuracy and compliance with 2026 Google Search E-E-A-T standards."
1. 20 Microns Limited [NSE: 20MICRONS] achieved an 84.2% EBITDA-to-operating cash flow conversion in FY26, generating $11.89 million in OCF, a 225% increase driven by tighter working capital management and reduced capital intensity.
2. The firm is executing a $11.47 million CapEx program over 24 months, earmarking 15% for energy optimization and bio-methanation to combat volatile power tariffs and support a 15% carbon reduction target.
3. Backward integration via 100% equity acquisitions in Malaysian quarries (GTLQ and IQ Marble) de-risks raw material procurement, supporting a "China+1" export positioning strategy.
Figure 20 Microns Limited: FY 2025-26 Strategic Value Architecture
Segmental Realities and Margin Optimization PerformanceThe financial profile of 20 Microns Limited is evaluated as a single operating segment: Industrial Micronized Minerals and Specialty Chemicals. Total consolidated revenue from operations stood at $109.45 million (₹95,383.26 Lakhs) in FY26, representing a 4.50% year-over-year (YoY) expansion compared to $104.74 million (₹91,278.52 Lakhs) in FY25.
Consolidated EBITDA grew by 4.85% YoY to $14.12 million (₹12,308.61 Lakhs), maintaining a stable EBITDA margin of 12.90%. Profit After Tax (PAT) from continuing operations grew by 6.70% YoY to $7.65 million (₹6,667.00 Lakhs), yielding a net profit margin of 7.00%. The company’s DuPont net profit ratio expanded to 6.99% in FY26 from 6.85% in FY25, while its standalone net profit reached $7.67 million (₹6,682.56 Lakhs).
Table Consolidated Financial Performance Metrics (FY2025–FY2026)
| Financial Metric | FY2025 Value (USD / INR) | FY2026 Value (USD / INR) | YoY Change / Basis Point Shift |
|---|---|---|---|
| Consolidated Revenue | $104.74M (₹91,278.52 Lakhs) | $109.45M (₹95,383.26 Lakhs) | +4.50% |
| Consolidated EBITDA | $13.47M (₹11,739.26 Lakhs) | $14.12M (₹12,308.61 Lakhs) | +4.85% |
| EBITDA Margin | 12.85% | 12.90% | +5 bps |
| Consolidated PAT | $7.17M (₹6,248.36 Lakhs) | $7.65M (₹6,667.00 Lakhs) | +6.70% |
| Net Profit Margin | 6.85% | 7.00% | +15 bps |
| Debt-to-Equity Ratio | 0.35× | 0.30× | -500 bps (De-leveraging) |
| Operating Cash Flow (OCF) | $3.65M (₹3,178.64 Lakhs) | $11.89M (₹10,359.49 Lakhs) | +225.00% |
| EBITDA-to-OCF Conversion | 27.10% | 84.21% | +5,711 bps |
| Capital Expenditure (CapEx) | $8.80M (₹7,668.00 Lakhs) | $3.02M (₹2,635.89 Lakhs) | -65.68% |
| Return on Equity (ROE) | 15.97% | 14.60% | -137 bps |
| Return on Capital Employed (ROCE) | 18.31% | 16.41% | -190 bps |
Revenue Mix by End-Use Application Vertical
* Paints, Coatings & Printing Inks: 46% of total revenue. Functions as the largest vertical, focusing on Titanium Dioxide (TiO2) replacement, opacity enhancement, and rheological modification.
* Plastics & Polymers: 26% of total revenue. Consists of engineered fillers, flame retardants, and processing aids for PVC, masterbatches, and EV battery applications.
* Rubber: 10% of total revenue. Consists of engineered fillers and activators targeting partial replacement of carbon black and silica.
* Ceramics: 5% of total revenue. Comprises hydrous and calcined kaolin applications.
* Paper: 4% of total revenue. Anchored by barrier-enhancing talc.
* Others: 9% of total revenue. Consists of B2C Construction Chemicals (20 MCC division) and mineral-based fertilizers (MinFert division), providing a high-margin cyclical buffer.
Geographic Revenue Distribution
* Domestic Market (India): $96.19 million (₹83,826.57 Lakhs), representing 87.9% of the consolidated top line.
* International Markets: $12.29 million (₹10,711.65 Lakhs), representing 12.1% of consolidated revenue, covering exports to over 83 countries.
Operating Cost Structure Breakdown
* Cost of Materials Consumed: $56.61 million (₹49,336.85 Lakhs), representing 51.72% of operational revenue.
* Freight & Handling Expenses: $13.79 million (12.60% of revenue), split between domestic logistics of $11.62 million (₹10,127.09 Lakhs) and export logistics of $2.17 million (₹1,891.26 Lakhs).
* Employee Benefit Expenses: $9.76 million (₹8,508.23 Lakhs), representing 8.92% of revenue. The workforce consists of 413 permanent employees and 43 dedicated R&D personnel.
* Power and Fuel Costs: $6.35 million (₹5,538.27 Lakhs), representing 5.81% of revenue.
* Finance Costs: $1.97 million (₹1,714.15 Lakhs), representing 1.80% of revenue.
Working Capital Metrics (365-Day Cycle Assessment)
The consolidated cash conversion cycle (CCC) was calculated at approximately 57.2 days, reflecting high working capital velocity and zero evidence of cash trapping:
* Inventory Days: 44.1 days, supported by an accelerated inventory turnover ratio of 8.27x in FY26.
* Receivable Days: 61.2 days, based on a trade receivables turnover ratio of 5.96x.
* Payable Days: 48.1 days, backed by a trade payables turnover ratio of 7.59x.
Supply Chain Architecture, Capital Expenditures, and ESG Allocations
The supply chain of 20 Microns Limited relies on captive domestic mineral reserves, supplemented by international quarrying assets. The company's physical infrastructure includes 8 manufacturing plants across India (located in Bhuj, Hosur, Nagor, Haldwani, Tirunelveli, Alwar, Udaipur, and Parbatsar-Makrana) and 13 distribution warehouses. Captive mining capacity holds 11.3 Million tonnes of reserves, encompassing China Clay, Dolomite, Calcite, and Limestone across Gujarat, Rajasthan, Andhra Pradesh, and Tamil Nadu.
Sourcing Architecture & Joint Ventures
* Sourcing Footprint: 69% of raw materials are sourced domestically. Strategic imports are sourced from China, USA, Egypt, Vietnam, and Malaysia.
* Malaysian Backward Integration: The company acquired 100% equity in GTLQ SDN BHD and IQ Marble SDN BHD (Malaysia). Management targets an extraction capacity of 92,000 MTPA and processing capacity of 108,000 MTPA at these sites by FY30.
* Sievert Joint Venture: Plant capacity targets 22,500 MTPA by FY29. The parent company extended a $229.5K (₹200 Lakhs) inter-corporate loan to support development.
R&D Pipeline & Commercialized Innovations
R&D operations are centered at the DSIR-certified Waghodia facility in Vadodara, employing 35 scientists and engineers. Total R&D spend for FY26 was $267.36K (₹2.33 Crores), or 0.24% of operational revenue. This program utilizes a 6-stage innovation framework, commercializing four major functional products in FY26:
* TALC HFM 25 SD: A spray-dried anti-blocking solution for plastic films.
* White Kaolin Cosmetic Grade: Premium minerals targeting personal care and cosmetic applications.
* HYPERTHERM UT: An infrared management additive for agricultural greenhouse films.
* HYDROXYLGEL A1: A surface-engineered rheology modifier for coatings and construction chemicals.
Energy and ESG Capital Spending
* Waste-to-Fuel Bio-Methanation: The firm processes organic waste into biogas, upgraded to CNG and Compressed Bio Gas (CBG) to reduce reliance on furnace oil.
* CapEx Allocation: Out of the planned $11.47 million (₹100 Crore) CapEx pipeline deployed over 24 months, 15% ($1.72 million) is earmarked for green manufacturing and energy optimization. This investment targets a 15% reduction in carbon emissions over three years, which is projected to yield 5% to 8% in direct energy cost savings.
* CSR Allocation: Out of a statutory gross requirement of $161.14K (₹140.43 Lakhs), the firm spent $127.03K (₹110.70 Lakhs). The $33.32K (₹29.04 Lakhs) shortfall was offset using eligible excess CSR expenditures from prior fiscal years.
HDIN Institutional Verdict on Structural Transition and Regulatory Overhangs
An analysis of the balance sheet confirms that 20 Microns Limited is in a capital-harvesting phase. The reduction in CapEx from $8.80 million in FY25 to $3.02 million in FY26, combined with an 84.2% EBITDA-to-OCF conversion rate, demonstrates disciplined operational execution. The contraction in ROE (to 14.60%) and ROCE (to 16.41%) does not indicate deteriorating core profitability; instead, it reflects a lower equity multiplier from active debt reduction (debt-to-equity down to 0.30x) and the asset-velocity dilution of newly capitalized PPE.
The company's "offset solution" R&D strategy reduces its vulnerability to cheap imports. By co-engineering functional mineral additives that partially substitute expensive primary chemicals like TiO2 and carbon black, the company embeds itself directly into customer formulations, creating high switching costs.
However, several risk factors require monitoring by institutional investors:
* Customer Concentration: The company is exposed to customer concentration, with two tier-1 clients representing $26.51 million (₹23,102.03 Lakhs) or 24.2% of total consolidated revenue.
* Off-Balance Sheet Exposures: Consolidated contingent liabilities increased to $1.10 million (₹957.09 Lakhs) in FY26 from $968K in FY25.
* Mining Boundary Penalties: A dispute with the Geology and Mining Department involves a $480.9K (₹419.13 Lakhs) penalty for alleged over-extraction at Survey No. 483 in Mamuara, Bhuj. While the Commissioner has directed a reassessment, this remains a material, unprovisioned contingent liability.
* Statutory and Labor Claims: The firm is defending $277.9K (₹242.17 Lakhs) in labor disputes in the High Court of Gujarat. Standalone statutory claims total $512.81K (₹446.90 Lakhs), alongside direct tax claims of $227.4K (₹198.19 Lakhs) and indirect tax claims of $27.6K (₹24.02 Lakhs).
* Supreme Court Appellate Litigation: The NSE is appealing a SAT order that refunded governance fines levied on the company regarding the statutory age limit of former Independent Director Dr. Swaminathan Sivaram.
* Conservative Payout Model: Against a standalone PAT of $7.67 million, the total dividend payout of $506.13K (₹441.08 Lakhs)—representing a flat YoY dividend of $0.014 (₹1.25) per equity share—results in a low payout ratio of 6.6%. While this conservative approach supports the self-funded $11.47 million CapEx pipeline, it limits short-term shareholder yields.
Presentation Download & Video Access:
Presentation Download: Click the PDF download link under 'Related Topics' to access the full institutional presentation of this report.
Video Link: Click this link to watch the HDIN analyst briefing on YouTube.
About HDIN Research:
HDIN Research is a premier global market intelligence and strategic advisory firm specializing in institutional-grade financial analysis, supply chain audits, and macroeconomic forecasting. Our dedicated sector analysts deliver actionable, data-driven insights tailored for private equity, hedge funds, and corporate strategy teams. Visit us at http://www.hdinresearch.com.
2026 AI Transparency Footer:
"This intelligence report was authored by HDIN Research analysts following a rigorous audit of official corporate filings. AI was utilized for massive-scale data synthesis and structural drafting, ensuring 100% inclusion of reported data points. All strategic insights, financial modeling, and final verdicts were verified by our editorial board to ensure professional accuracy and compliance with 2026 Google Search E-E-A-T standards."