Lupin Limited: Portfolio Complexity Pivot Towards High-Barrier Generics as 890 Basis Point EBITDA Margin Expansion Signals Capital Allocation Efficiency
Date : 2026-07-16
Reading : 88
HDIN Executive Takeaways
1. Lupin Limited shifted its product mix to high-barrier formulations, driving an 890 basis point EBITDA margin expansion to 33.6% in FY26, defying broader pricing pressures.
2. Regional execution delivered a 46% revenue increase in the U.S. and 10.5% in India, supported by exclusive launches like Tolvaptan and long-acting Risperidone.
3. Balance sheet risk was mitigated as cash reserves reached $1,215.65 million, moving the Net Debt-to-Equity ratio to (0.21) and establishing a net-cash position.
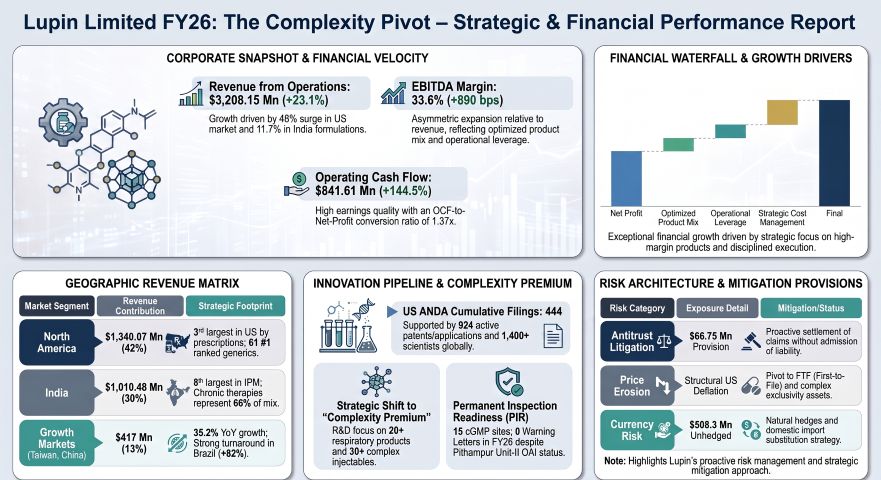
Figure Lupin Limited FY26: The Complexity Pivot- Strategic & Financial Performance Report
 Segmental Realities and Margin Expansion
Lupin Limited [NSE: LUPIN] delivered a major structural expansion in profitability during FY26, as asymmetric EBITDA growth outpaced top-line revenue gains. The group's consolidated revenue from operations reached $3,208.15 million (INR 279,580 million), representing a 23.1% increase compared to $2,605.71 million in FY25. This expansion was driven by a 46% surge in the North American market and a 10.5% rise in domestic Indian formulation sales.
EBITDA grew by 68.6% year-over-year to $1,060.34 million, up from $628.73 million in FY25. The resulting EBITDA margin expanded by 890 basis points to 33.6%, demonstrating significant operating leverage. Net profit after tax expanded 62.0% to $614.54 million, up from $379.39 million in FY25.
This margin performance was supported by a 410 basis point expansion in gross margin, which reached 73.3% in FY26 compared to 69.2% in FY25. Cost-saving initiatives generated $41.3 million through supply chain optimization, procurement efficiencies, and shifting freight from air to sea cargo.
Segmental Revenue Breakdown
Lupin Limited operates primarily as a formulation-driven enterprise:
* Pharmaceutical Formulations (Generics, Branded, and Specialty): Contributed $3,191.44 million (INR 278,123.6 million) in FY26. Total global volume output reached 22.54 billion units. Chronic therapies (cardiology, anti-diabetics, and respiratory) accounted for 66% of India formulation revenue, up from 64% in FY25.
* Healthcare Adjacencies: Generated $16.91 million (INR 1,473.9 million).
* Active Pharmaceutical Ingredients (APIs): Total output reached 3,372 Metric Tonnes (MT). External sales were driven by the API Plus business (Anti-TB and Cephalosporins) and custom outsourcing via Lupin Manufacturing Solutions (LMS).
Geographic Revenue Performance
* North America (U.S.): Contributed 42% of global revenue. Total North American sales reached $1,340.07 million (INR 116,783 million), representing a 46% increase. (The U.S. business reported $1,318 million in USD, up 40% YoY). Growth was driven by the exclusive launches of Tolvaptan (May 2025 launch with 180-day exclusivity), Mirabegron ER, Tiotropium Bromide (the first FDA-approved dry-powder inhaler from India), and Risperidone long-acting injectable (with 180-day Competitive Generic Therapy exclusivity). Xopenex HFA® remains the lead brand in the specialty respiratory segment. Lupin ranks 3rd in the U.S. generic market by prescriptions, with 61 products holding the 1 market rank and 112 products in the top three.
* India: Contributed 30% of global revenue. Domestic formulations generated $1,010.48 million (INR 88,060 Mn), representing a 10.5% increase, outperforming the Indian Pharmaceutical Market (IPM) growth rate of 9.9% by 60 basis points. Lupin ranks 8th in the IPM. Five of its domestic brands are ranked in the top 300.
* Emerging Markets (LATAM, APAC, South Africa): Contributed 13% of global revenue and expanded by 35.2%. Brazil grew by 82% to BRL 428 million, while Mexico and South Africa delivered solid performance.
* Other Developed Markets (Europe, Australia, Canada): Contributed 11% of global revenue, expanding 13.3%. This was accelerated by the acquisition of VISUfarma B.V. for $217.98 million (EUR 192.8 million), which added over 60 branded ophthalmology products across the UK, Germany, Italy, Spain, and France.
Infrastructure Layout and Regional Moats
Lupin Limited operates an integrated global manufacturing and R&D network comprising 15 global manufacturing sites, supported by more than 1,400 R&D scientists and 2,500 quality professionals.
Manufacturing Sites
* India (Core Manufacturing Hub): Includes 12 sites: Tarapur, Mandideep, Dabhasa, Ankleshwar, Chhatrapati Sambhajinagar, Vizag, Goa, Jammu, Pune, Pithampur, Nagpur, and Sikkim.
* International Facilities: Operates sites in Somerset, New Jersey; Coral Springs, Florida; alongside localized operations in Brazil and Mexico.
Regulatory Status and Quality Remediation
During FY26, the U.S. FDA conducted 9 inspections across Lupin's manufacturing footprint, resulting in 8 Form 483s and a total of 29 observations. The company received zero Warning Letters and zero Class 1 recalls. However, Pithampur Unit-II was classified as Official Action Indicated (OAI). Lupin deployed digital tools, including Electronic Batch Manufacturing Records and Centralized Data Acquisition Systems, to mitigate compliance risks and maintain On-Time In-Full (OTIF) delivery rates of 98% in the U.S. and 99% in India.
Strategic Partnerships and Licensing Activity
To expand its specialized therapeutics pipeline, Lupin entered into several key alliances:
* GLP-1 and Metabolic Space: Signed an exclusive agreement with Gan & Lee Pharmaceuticals to commercialize Bofanglutide (fortnightly GLP-1 receptor agonist) in India. Partnered with Zydus Lifesciences to co-market Semaglutide in India, and with Galenicum to distribute Semaglutide across 23 global markets. It also continues its co-marketing agreements with Boehringer Ingelheim for GIBTULIO® and AJADUO®.
* Biosimilars and Specialty: Partnered with Sandoz to market Ranibizumab across the EU (excluding Germany), Switzerland, and Norway, and with Zentiva for Certolizumab Pegol.
* Infectious Diseases: Partnered with TB Alliance for the clinical development of Telacebec (Q203). It maintains a non-exclusive license to supply Pretomanid (part of the BPaL regimen for drug-resistant TB) to over 140 countries.
* Corporate Carve-Outs and M&A: Acquired UK-based Renascience Pharma Ltd for $15.44 million (GBP 12.3 million) to secure branded cephalosporins and cardiovascular therapies. The company also carved out its domestic Over-The-Counter (OTC) business into LupinLife Consumer Healthcare Ltd and its trade generics into Lupin Life Sciences Ltd.
HDIN Institutional Verdict
Lupin Limited’s FY26 financial profile indicates high earnings quality, though certain structural tax and litigation factors require close analytical attention from institutional investors.
Tax Holiday Lifecycle Analysis
Lupin’s FY26 Effective Tax Rate (ETR) was 22.07% (on PBT of $788.62 million and tax expense of $174.08 million), which sits 1,287 basis points below India's statutory rate of 34.94%. Under the statutory rate, the tax burden would have been $275.57 million (INR 24,015.4 million). Favorable tax exemptions in Special Economic Zones (SEZ) like Pithampur and Nagpur saved the company $137.68 million in tax expenses (up from $97.89 million in FY25). This low tax rate was partially offset by non-deductible expenses of $13.74 million and the non-recognition of deferred tax assets of $28.13 million.
Additionally, the company recognized $31.62 million in Export Benefits and Other Incentives (including the Indian Government's PLI scheme). While this accounts for 4.0% of PBT, the core EBITDA margin remains robust and is primarily driven by high-margin complex launches rather than government subsidies.
R&D Capitalization and Asset Quality
Lupin maintains conservative R&D accounting practices. In FY26, the company expensed $236.74 million in R&D to the P&L, while capitalizing only $31.50 million as Intangible Assets Under Development (IAUD). This represents an 11.7% capitalization rate, which indicates that current-period earnings were not inflated by deferring research costs to the balance sheet.
The company also carried out proactive asset cleaning, recording a consolidated asset impairment charge of $12.97 million (INR 1,130.1 million) in FY26.
Total FY26 Impairment Charge: $12.97 Mn
├── Commercialized Intangible Assets: $9.84 Mn (DCF Recoverability failure)
├── Capital Work-In-Progress (CWIP): $2.77 Mn (CGU Recoverable shortfall)
└── Developmental Pipeline (IAUD): $0.36 Mn (Halted R&D Programs)
*(On a standalone basis, the parent company recorded a $8.03 million write-down in its subsidiary, Lupin Digital Health Limited).*
D&A expenses grew to $157.84 million (up from $134.17 million in FY25), driven by $33.15 million in right-of-use asset additions, capex, and M&A integration. A review of useful lives showed no changes.
Balance Sheet and Cash Flow Commitments
Operating Cash Flow rose to $841.61 million, supported by a reduction in Working Capital Days to 113 (down from 129 in FY25). This was aided by extending Accounts Payable Days by 25 days to 91 days, reflecting improved supplier terms. Total gross borrowings increased from $582.54 million to $678.18 million. Long-term non-current borrowings were reduced to $188.5 million (down from $202.6 million in FY25), while short-term debt was utilized to fund immediate operational scale. Supported by a cash reserve of $1,215.65 million, the company's Net Debt-to-Equity ratio reached (0.21).
Lupin also faces several off-balance sheet and contingent exposures:
* Litigation Provisions: Created a $66.75 million provision for U.S. Antitrust Price-Fixing allegations (*In Re Generic Pharmaceuticals Antitrust Litigation*), subsequently settling one claim for $30.46 million. It also settled a patent dispute with Astellas Pharma over Mirabegron ER for $97.26 million ($81.60 million prepaid option and a $15.66 million fee).
* Contingent Liabilities: Direct tax demands of $17.27 million, indirect tax demands of $1.74 million, unacknowledged claims of $7.75 million (including a power tariff dispute with MSEDCL), and $72.85 million in financial guarantees on behalf of subsidiaries (including Nanomi B.V.).
* Capital Commitments: Committed $55.54 million for tangible assets, $0.07 million for intangible assets, and $33.89 million for purchase commitments.
* Leases and Dividends: Non-cancellable low-value leases stand at $2.05 million and short-term leases at $0.001 million. The proposed dividend of INR 18 per share represents a probable cash outflow of $94.43 million.
* Unhedged Forex Exposure: The company holds unhedged USD net assets of $598.30 million. A 5% volatility swing of the INR against its foreign currency basket would yield an estimated $33.48 million impact on Profit Before Tax. (Derivative hedges include $48.00 million in forward exchange contracts, EUR 5.29 million and $6.31 million in fair value hedges, and a $140.00 million Interest Rate Swap paying a fixed 5.22% rate against receiving SOFR + 1.2%).
Board and Executive Compensation
The company's corporate governance structure consists of 10 directors, 6 of whom are independent (60%). Ms. Punita Lal and Mr. Anand Kripalu were appointed as Independent Directors to replace Jean-Luc Belingard and Dr. Punita Kumar-Sinha, with Mr. Mark D. McDade appointed as the Lead Independent Director. Women represent 30% of the board.
Executive compensation remained aligned with performance. Managing Director Nilesh D. Gupta’s total remuneration was $1.47 million (+15.9% YoY), Global CFO Ramesh Swaminathan received $1.22 million (+8.7% YoY), and CEO Vinita Gupta received $3.06 million (-1.6% YoY). Total KMP compensation stood at $7.90 million ($6.22 million short-term, $1.52 million post-employment, and $0.16 million in share-based payments). Dividend payout to the promoter entity, Lupin Investments Private Limited (holding a 45.32% stake), was $28.53 million.
Lupin also ranks 1 globally in the S&P Global ESG Ratings with a score of 91/100, and holds a Double 'A' CDP leadership rating. The company achieved a 41% absolute reduction in Scope-1 and Scope-2 emissions from its FY23 baseline, supported by its 48% renewable energy mix (including 22 MW of new solar/hybrid capacity). It maintained its "water-positive" status for the fifth consecutive year, reducing absolute freshwater withdrawal in India by 10% vs. FY21 and recycling 45% of total water across its 6 Zero Liquid Discharge (ZLD) sites. It also diverted 91.3% of hazardous waste to cement kilns and is transitioning its respiratory portfolio to "green inhalers" using low Global Warming Potential propellants, which currently represent 35% of its Scope-3 emissions.
Presentation Download & Video Access:
Presentation Download: Click the PDF download link under 'Related Topics' to access the full institutional presentation of this report.
Video Link: Click this link to watch the HDIN analyst briefing on YouTube.
About HDIN Research:
HDIN Research is a premier global market intelligence and strategic advisory firm specializing in institutional-grade financial analysis, supply chain audits, and macroeconomic forecasting. Our dedicated sector analysts deliver actionable, data-driven insights tailored for private equity, hedge funds, and corporate strategy teams. Visit us at http://www.hdinresearch.com.
2026 AI Transparency Footer:
"This intelligence report was authored by HDIN Research analysts following a rigorous audit of official corporate filings. AI was utilized for massive-scale data synthesis and structural drafting, ensuring 100% inclusion of reported data points. All strategic insights, financial modeling, and final verdicts were verified by our editorial board to ensure professional accuracy and compliance with 2026 Google Search E-E-A-T standards."
1. Lupin Limited shifted its product mix to high-barrier formulations, driving an 890 basis point EBITDA margin expansion to 33.6% in FY26, defying broader pricing pressures.
2. Regional execution delivered a 46% revenue increase in the U.S. and 10.5% in India, supported by exclusive launches like Tolvaptan and long-acting Risperidone.
3. Balance sheet risk was mitigated as cash reserves reached $1,215.65 million, moving the Net Debt-to-Equity ratio to (0.21) and establishing a net-cash position.
Figure Lupin Limited FY26: The Complexity Pivot- Strategic & Financial Performance Report
Segmental Realities and Margin ExpansionLupin Limited [NSE: LUPIN] delivered a major structural expansion in profitability during FY26, as asymmetric EBITDA growth outpaced top-line revenue gains. The group's consolidated revenue from operations reached $3,208.15 million (INR 279,580 million), representing a 23.1% increase compared to $2,605.71 million in FY25. This expansion was driven by a 46% surge in the North American market and a 10.5% rise in domestic Indian formulation sales.
EBITDA grew by 68.6% year-over-year to $1,060.34 million, up from $628.73 million in FY25. The resulting EBITDA margin expanded by 890 basis points to 33.6%, demonstrating significant operating leverage. Net profit after tax expanded 62.0% to $614.54 million, up from $379.39 million in FY25.
Table Consolidated Financial Performance Metrics (FY2025–FY2026)
| Metric (USD at INR 87.1468/USD) | FY2025 (Prior Year) | FY2026 (Current Year) | YoY Variance / Operational Analysis |
|---|---|---|---|
| Revenue from Operations | $2,605.71M | $3,208.15M | +23.1% (Driven by 46% growth in the U.S. market and 11.7% growth in India formulations) |
| EBITDA | $628.73M | $1,060.34M | +68.6% (Reflecting strong operating leverage and contribution from high-margin product launches) |
| EBITDA Margin | 24.7% | 33.6% | +890 bps (Supported by optimized product mix and scale efficiencies) |
| Net Profit (After Tax) | $379.39M | $614.54M | +62.0% (Strong conversion of operating gains into bottom-line growth) |
| Gross Margin | 69.2% | 73.3% | +410 bps (Driven by lower raw material costs as a percentage of sales) |
| R&D Expenses | $206.18M | $236.74M | +14.8% (Absolute R&D investment growth while maintaining efficiency) |
| R&D as % of Revenue | 7.9% | 7.5% | -40 bps (Maintained within the industry benchmark range of 7.0%–9.0%) |
| Operating Cash Flow (OCF) | $344.24M | $841.61M | +144.5% (Driven by improved working capital efficiency and cash conversion) |
| OCF / Net Profit Ratio | 0.91× | 1.37× | +0.46× (Indicating stronger earnings quality and cash realization) |
| Accounts Payable Days | 66 Days | 91 Days | +25 Days (Reflecting extended supplier credit utilization) |
| Working Capital Days | 129 Days | 113 Days | -16 Days (Improved working capital velocity) |
| Net Debt-to-Equity Ratio | (0.02×) | (0.21×) | -0.19× (Further strengthening of net cash position) |
| Return on Capital Employed (ROCE) | 21.6% | 28.4% | +680 bps (Improved capital allocation efficiency on an unlevered asset base) |
This margin performance was supported by a 410 basis point expansion in gross margin, which reached 73.3% in FY26 compared to 69.2% in FY25. Cost-saving initiatives generated $41.3 million through supply chain optimization, procurement efficiencies, and shifting freight from air to sea cargo.
Segmental Revenue Breakdown
Lupin Limited operates primarily as a formulation-driven enterprise:
* Pharmaceutical Formulations (Generics, Branded, and Specialty): Contributed $3,191.44 million (INR 278,123.6 million) in FY26. Total global volume output reached 22.54 billion units. Chronic therapies (cardiology, anti-diabetics, and respiratory) accounted for 66% of India formulation revenue, up from 64% in FY25.
* Healthcare Adjacencies: Generated $16.91 million (INR 1,473.9 million).
* Active Pharmaceutical Ingredients (APIs): Total output reached 3,372 Metric Tonnes (MT). External sales were driven by the API Plus business (Anti-TB and Cephalosporins) and custom outsourcing via Lupin Manufacturing Solutions (LMS).
Geographic Revenue Performance
* North America (U.S.): Contributed 42% of global revenue. Total North American sales reached $1,340.07 million (INR 116,783 million), representing a 46% increase. (The U.S. business reported $1,318 million in USD, up 40% YoY). Growth was driven by the exclusive launches of Tolvaptan (May 2025 launch with 180-day exclusivity), Mirabegron ER, Tiotropium Bromide (the first FDA-approved dry-powder inhaler from India), and Risperidone long-acting injectable (with 180-day Competitive Generic Therapy exclusivity). Xopenex HFA® remains the lead brand in the specialty respiratory segment. Lupin ranks 3rd in the U.S. generic market by prescriptions, with 61 products holding the 1 market rank and 112 products in the top three.
* India: Contributed 30% of global revenue. Domestic formulations generated $1,010.48 million (INR 88,060 Mn), representing a 10.5% increase, outperforming the Indian Pharmaceutical Market (IPM) growth rate of 9.9% by 60 basis points. Lupin ranks 8th in the IPM. Five of its domestic brands are ranked in the top 300.
* Emerging Markets (LATAM, APAC, South Africa): Contributed 13% of global revenue and expanded by 35.2%. Brazil grew by 82% to BRL 428 million, while Mexico and South Africa delivered solid performance.
* Other Developed Markets (Europe, Australia, Canada): Contributed 11% of global revenue, expanding 13.3%. This was accelerated by the acquisition of VISUfarma B.V. for $217.98 million (EUR 192.8 million), which added over 60 branded ophthalmology products across the UK, Germany, Italy, Spain, and France.
Infrastructure Layout and Regional Moats
Lupin Limited operates an integrated global manufacturing and R&D network comprising 15 global manufacturing sites, supported by more than 1,400 R&D scientists and 2,500 quality professionals.
Manufacturing Sites
* India (Core Manufacturing Hub): Includes 12 sites: Tarapur, Mandideep, Dabhasa, Ankleshwar, Chhatrapati Sambhajinagar, Vizag, Goa, Jammu, Pune, Pithampur, Nagpur, and Sikkim.
* International Facilities: Operates sites in Somerset, New Jersey; Coral Springs, Florida; alongside localized operations in Brazil and Mexico.
Regulatory Status and Quality Remediation
During FY26, the U.S. FDA conducted 9 inspections across Lupin's manufacturing footprint, resulting in 8 Form 483s and a total of 29 observations. The company received zero Warning Letters and zero Class 1 recalls. However, Pithampur Unit-II was classified as Official Action Indicated (OAI). Lupin deployed digital tools, including Electronic Batch Manufacturing Records and Centralized Data Acquisition Systems, to mitigate compliance risks and maintain On-Time In-Full (OTIF) delivery rates of 98% in the U.S. and 99% in India.
Strategic Partnerships and Licensing Activity
To expand its specialized therapeutics pipeline, Lupin entered into several key alliances:
* GLP-1 and Metabolic Space: Signed an exclusive agreement with Gan & Lee Pharmaceuticals to commercialize Bofanglutide (fortnightly GLP-1 receptor agonist) in India. Partnered with Zydus Lifesciences to co-market Semaglutide in India, and with Galenicum to distribute Semaglutide across 23 global markets. It also continues its co-marketing agreements with Boehringer Ingelheim for GIBTULIO® and AJADUO®.
* Biosimilars and Specialty: Partnered with Sandoz to market Ranibizumab across the EU (excluding Germany), Switzerland, and Norway, and with Zentiva for Certolizumab Pegol.
* Infectious Diseases: Partnered with TB Alliance for the clinical development of Telacebec (Q203). It maintains a non-exclusive license to supply Pretomanid (part of the BPaL regimen for drug-resistant TB) to over 140 countries.
* Corporate Carve-Outs and M&A: Acquired UK-based Renascience Pharma Ltd for $15.44 million (GBP 12.3 million) to secure branded cephalosporins and cardiovascular therapies. The company also carved out its domestic Over-The-Counter (OTC) business into LupinLife Consumer Healthcare Ltd and its trade generics into Lupin Life Sciences Ltd.
HDIN Institutional Verdict
Lupin Limited’s FY26 financial profile indicates high earnings quality, though certain structural tax and litigation factors require close analytical attention from institutional investors.
Tax Holiday Lifecycle Analysis
Lupin’s FY26 Effective Tax Rate (ETR) was 22.07% (on PBT of $788.62 million and tax expense of $174.08 million), which sits 1,287 basis points below India's statutory rate of 34.94%. Under the statutory rate, the tax burden would have been $275.57 million (INR 24,015.4 million). Favorable tax exemptions in Special Economic Zones (SEZ) like Pithampur and Nagpur saved the company $137.68 million in tax expenses (up from $97.89 million in FY25). This low tax rate was partially offset by non-deductible expenses of $13.74 million and the non-recognition of deferred tax assets of $28.13 million.
Additionally, the company recognized $31.62 million in Export Benefits and Other Incentives (including the Indian Government's PLI scheme). While this accounts for 4.0% of PBT, the core EBITDA margin remains robust and is primarily driven by high-margin complex launches rather than government subsidies.
R&D Capitalization and Asset Quality
Lupin maintains conservative R&D accounting practices. In FY26, the company expensed $236.74 million in R&D to the P&L, while capitalizing only $31.50 million as Intangible Assets Under Development (IAUD). This represents an 11.7% capitalization rate, which indicates that current-period earnings were not inflated by deferring research costs to the balance sheet.
The company also carried out proactive asset cleaning, recording a consolidated asset impairment charge of $12.97 million (INR 1,130.1 million) in FY26.
Total FY26 Impairment Charge: $12.97 Mn
├── Commercialized Intangible Assets: $9.84 Mn (DCF Recoverability failure)
├── Capital Work-In-Progress (CWIP): $2.77 Mn (CGU Recoverable shortfall)
└── Developmental Pipeline (IAUD): $0.36 Mn (Halted R&D Programs)
*(On a standalone basis, the parent company recorded a $8.03 million write-down in its subsidiary, Lupin Digital Health Limited).*
D&A expenses grew to $157.84 million (up from $134.17 million in FY25), driven by $33.15 million in right-of-use asset additions, capex, and M&A integration. A review of useful lives showed no changes.
Balance Sheet and Cash Flow Commitments
Operating Cash Flow rose to $841.61 million, supported by a reduction in Working Capital Days to 113 (down from 129 in FY25). This was aided by extending Accounts Payable Days by 25 days to 91 days, reflecting improved supplier terms. Total gross borrowings increased from $582.54 million to $678.18 million. Long-term non-current borrowings were reduced to $188.5 million (down from $202.6 million in FY25), while short-term debt was utilized to fund immediate operational scale. Supported by a cash reserve of $1,215.65 million, the company's Net Debt-to-Equity ratio reached (0.21).
Lupin also faces several off-balance sheet and contingent exposures:
* Litigation Provisions: Created a $66.75 million provision for U.S. Antitrust Price-Fixing allegations (*In Re Generic Pharmaceuticals Antitrust Litigation*), subsequently settling one claim for $30.46 million. It also settled a patent dispute with Astellas Pharma over Mirabegron ER for $97.26 million ($81.60 million prepaid option and a $15.66 million fee).
* Contingent Liabilities: Direct tax demands of $17.27 million, indirect tax demands of $1.74 million, unacknowledged claims of $7.75 million (including a power tariff dispute with MSEDCL), and $72.85 million in financial guarantees on behalf of subsidiaries (including Nanomi B.V.).
* Capital Commitments: Committed $55.54 million for tangible assets, $0.07 million for intangible assets, and $33.89 million for purchase commitments.
* Leases and Dividends: Non-cancellable low-value leases stand at $2.05 million and short-term leases at $0.001 million. The proposed dividend of INR 18 per share represents a probable cash outflow of $94.43 million.
* Unhedged Forex Exposure: The company holds unhedged USD net assets of $598.30 million. A 5% volatility swing of the INR against its foreign currency basket would yield an estimated $33.48 million impact on Profit Before Tax. (Derivative hedges include $48.00 million in forward exchange contracts, EUR 5.29 million and $6.31 million in fair value hedges, and a $140.00 million Interest Rate Swap paying a fixed 5.22% rate against receiving SOFR + 1.2%).
Board and Executive Compensation
The company's corporate governance structure consists of 10 directors, 6 of whom are independent (60%). Ms. Punita Lal and Mr. Anand Kripalu were appointed as Independent Directors to replace Jean-Luc Belingard and Dr. Punita Kumar-Sinha, with Mr. Mark D. McDade appointed as the Lead Independent Director. Women represent 30% of the board.
Executive compensation remained aligned with performance. Managing Director Nilesh D. Gupta’s total remuneration was $1.47 million (+15.9% YoY), Global CFO Ramesh Swaminathan received $1.22 million (+8.7% YoY), and CEO Vinita Gupta received $3.06 million (-1.6% YoY). Total KMP compensation stood at $7.90 million ($6.22 million short-term, $1.52 million post-employment, and $0.16 million in share-based payments). Dividend payout to the promoter entity, Lupin Investments Private Limited (holding a 45.32% stake), was $28.53 million.
Lupin also ranks 1 globally in the S&P Global ESG Ratings with a score of 91/100, and holds a Double 'A' CDP leadership rating. The company achieved a 41% absolute reduction in Scope-1 and Scope-2 emissions from its FY23 baseline, supported by its 48% renewable energy mix (including 22 MW of new solar/hybrid capacity). It maintained its "water-positive" status for the fifth consecutive year, reducing absolute freshwater withdrawal in India by 10% vs. FY21 and recycling 45% of total water across its 6 Zero Liquid Discharge (ZLD) sites. It also diverted 91.3% of hazardous waste to cement kilns and is transitioning its respiratory portfolio to "green inhalers" using low Global Warming Potential propellants, which currently represent 35% of its Scope-3 emissions.
Presentation Download & Video Access:
Presentation Download: Click the PDF download link under 'Related Topics' to access the full institutional presentation of this report.
Video Link: Click this link to watch the HDIN analyst briefing on YouTube.
About HDIN Research:
HDIN Research is a premier global market intelligence and strategic advisory firm specializing in institutional-grade financial analysis, supply chain audits, and macroeconomic forecasting. Our dedicated sector analysts deliver actionable, data-driven insights tailored for private equity, hedge funds, and corporate strategy teams. Visit us at http://www.hdinresearch.com.
2026 AI Transparency Footer:
"This intelligence report was authored by HDIN Research analysts following a rigorous audit of official corporate filings. AI was utilized for massive-scale data synthesis and structural drafting, ensuring 100% inclusion of reported data points. All strategic insights, financial modeling, and final verdicts were verified by our editorial board to ensure professional accuracy and compliance with 2026 Google Search E-E-A-T standards."