Biotricity Inc.: Accelerated Transition to AI-Driven TaaS Model in U.S. and Canadian Markets as 90.1% Q4 Segment Gross Margin Signals Operational Leverage Amid Severely Constrained Liquidity
Date : 2026-07-17
Reading : 268
HDIN Executive Takeaways
1. Biotricity Inc. [OTC: BTCY] expanded FY 2026 revenue 16.0% YoY to $15,998,239, achieving its first positive EBITDA of $1,709,660 via an 84.3% margin TaaS model that reduces clinical data review times by 90%.
2. High default risk looms as a $31,284,762 working capital deficiency and a tiny $149,789 cash balance restrict organic runway to 2.5 months, triggering an active going concern warning.
3. A May 2026 capital restructure established super-voting Series C Preferred shares with a 40-to-1 vote ratio, consolidating 33.25% insider control and insulating management from takeover pressure.
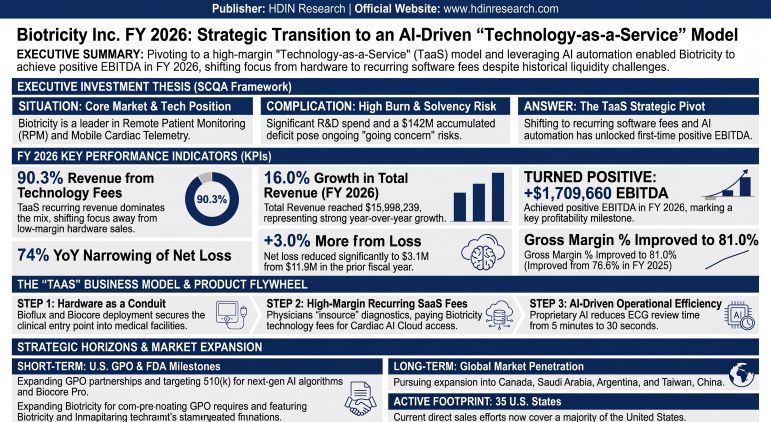
Figure Biotricity Inc FY 2026: Strategic Transition to an Al-Driven 'Technology-as-a-Service' Model
 Segmental Realities, AI-Driven Operating Leverage, and Cash Runway
During fiscal year (FY) 2026, Biotricity Inc. [OTC: BTCY] generated total revenue of $15,998,239, a 16.0% expansion compared to the $13,790,294 reported in FY 2025. Gross profit reached $12,948,798, yielding an overall gross margin of 81.0%, representing an expansion of 440 basis points (bps) from the 76.6% gross margin of the prior fiscal year.
This margin expansion was structurally driven by a decisive shift in the corporate revenue mix toward high-margin software services. The company's "Technology-as-a-Service" (TaaS) recurring revenue model generated $14,440,900 in Technology Fees, accounting for 90.3% of total revenue. Meanwhile, Device Sales (hardware) fell to $1,557,339, or 9.7% of the total.
The structural gross margin on technology fees expanded to 84.3% in FY 2026, up from 79.8% in FY 2025, and peaked at 90.1% during Q4 FY 2026. This operational leverage was driven by the deployment of the FDA-cleared Bioflux Software II System and proprietary AI capabilities, which compressed the estimated manual ECG data review time per study from 5 minutes to 30 seconds. Consequently, despite top-line growth, the absolute Cost of Revenue declined 5.5% to $3,049,441 in FY 2026 from $3,225,803 in FY 2025.
Due to improved top-line performance and workflow automation, Biotricity Inc. posted a positive EBITDA of $1,709,660, a structural turnaround from the negative EBITDA of $3,213,372 recorded in FY 2025. The net loss attributable to common stockholders narrowed by 73.8% to $3,128,458 (a loss of $0.115 per share), down from a net loss of $11,942,000 (a loss of $0.555 per share) in FY 2025.
Despite these operational efficiencies, Biotricity Inc. faces a critical liquidity bottleneck. As of March 31, 2026, the company reported cash and cash equivalents of only $149,789. Net cash used in operating activities was disciplined at $718,955 for FY 2026, down from $2,380,177 in FY 2025, yielding an average monthly operational cash burn rate of $59,913.
Dividing the ending cash balance by this burn rate indicates an organic operational runway of approximately 2.5 months. Consequently, independent auditors have issued an explanatory going concern warning.
The company's balance sheet exhibits a distressed capitalization structure:
* Total Assets: $6,446,488 (including $346,214 in Right-of-Use assets and a nominal $3,646 in physical PP&E).
* Total Liabilities: $39,408,954.
* Accumulated Deficit: $142,570,243.
* Negative Stockholders’ Equity: $34,676,942.
* Working Capital Deficiency: $31,284,762 (Current Assets of $5,856,484 against Current Liabilities of $37,141,246).
The current liability structure is heavily weighted toward short-term obligations:
* Current Portion of Term Loans: $14,680,914 (primarily SWK Funding LLC).
* Convertible Notes & Short-Term Loans: $11,114,209.
* Accounts Payable & Accrued Liabilities: $8,970,870.
* Long-Term Liabilities: Consist of $870,800 in federally guaranteed loans and $1,396,908 in derivative liabilities. Outstanding indebtedness totals $26.7 million, with management estimating that an additional $10 million in capital is required to support US commercialization and prevent potential debt default.
Clinical-Grade Ecosystem, Infrastructure Moats, and IP Protection
Biotricity Inc.’s technology ecosystem spans clinical diagnostic devices and chronic disease management:
* Bioflux / Bioflux COM: FDA-cleared Mobile Cardiac Outpatient Telemetry (COM) solution released in April 2019. It operates as a one-piece device with 3-channel ECG capabilities and built-in cellular connectivity, bypassing traditional 2-piece, 2-channel competitor offerings.
* Biocore / Biocore Pro: Connected 3-channel patch platform targeting lower-risk Holter and Extended Holter monitor markets. It reduces diagnosis times from the industry standard of two weeks to under 3 days. The Biocore Pro, featuring global cellular chipset compatibility and up to 5 days of battery life, launched in October 2023 as the flagship technology.
* Bioheart: Direct-to-Consumer (D2C) continuous heart monitor launched between late 2021 and early 2022 for post-diagnostic management.
* Biocare & Biokit: Released in October 2022, this integration bundles a blood pressure cuff, pulse oximeter, and digital thermometer with diagnostic software to manage comorbidities such as hypertension and COPD.
Physically, the company operates out of Redwood City, California, and Toronto, Ontario. No operational facilities or distribution layouts are established in Saudi Arabia, Argentina, or Taiwan, China.
Biotricity Inc. relies on a single-source contract manufacturer, Providence Enterprises, creating concentration risks in the hardware supply chain. Hardware units utilize global cellular networks (such as AT&T and Verizon equivalents) to transmit continuous ECG data to Google TensorFlow and Amazon Web Services (AWS) cloud-based AI engines.
The company's intellectual property and regulatory status are summarized below:
* Patent and Trademark Deficiencies: Biotricity Inc. holds zero utility patents. Its patent portfolio is limited to a single industrial design patent filed in Canada and the United States. Its core AI software algorithms (Bioflux Software II) and data assets rely entirely on trade secret protection, unpatented know-how, and unregistered copyrights.
* Regulatory Timeline: The company holds active FDA 510(k) clearances for Bioflux (2018/2019), Bioflux Software II (2021), and Biocore (January 2022). Its next-generation "Biocore Pro 2.0" and advanced ECG algorithms are in the pre-submission development phase, with target FDA applications slated for the next 12 months. The pipeline has not faced active regulatory inquiries or clinical holds.
* R&D Allocations: FY 2026 R&D expenses increased 28.2% (+$608,537) to $2,764,197, or 17.3% of revenue, up from $2,155,660 (15.6% of revenue) in FY 2025. This capital is expensed immediately, preventing capitalized software assets from inflating the balance sheet. R&D is partially offset by a National Institutes of Health (NIH) grant awarded in September 2022, with $238,703 utilized in March 2023 for stroke prediction models.
HDIN Institutional Verdict
An analysis of Biotricity Inc.'s financial structures indicates a divergence between its positive operating metrics and its structural capital market risks. While the "insourcing" TaaS model successfully captures direct healthcare reimbursements (~$850 per COM study and ~$200 per Holter read) across 35 U.S. states, the company's financial foundation remains highly fragile.
First, the company's credit provisioning exhibits an aggressive accounting profile. Gross accounts receivable totaled $3,003,725 (comprising $1,911,354 in trade receivables and $1,092,371 in other receivables) as of March 31, 2026. Trade receivables past due for more than 90 days totaled $360,883 ($329,511 in the 91-180 days bracket, and $31,372 over 180 days).
The allowance for expected credit losses stands at only $70,826, covering less than 20% of these past-due accounts. Furthermore, the company wrote off $74,780 in bad debt in FY 2026 but provisioned only $14,746. High customer concentration—with two clients accounting for 20% and 10% of total FY 2026 revenues (and one customer accounting for 29% in FY 2025)—amplifies the risk of material asset write-downs.
Second, the company's lease liabilities utilize a weighted-average incremental borrowing rate of 11.4% on its Operating Lease Liability of $397,830 (ROU asset of $346,214). This double-digit discount rate reflects a high cost of capital. Total cash lease commitments of $411,170 are due in 2026, dropping to $0 in 2027, highlighting a short-term operational posture.
Third, the company’s capital structure presents significant dilution and solvency risks. The SWK Funding LLC Credit Agreement is secured by a blanket lien on all corporate assets, including its entire intellectual property portfolio. Outstanding warrants total 3,263,169 shares:
* Broker Warrants: 956,077 outstanding ($0.37 to $37.56 strike prices, expiring August 2026 - October 2033).
* Consultant & Noteholder Warrants: 1,438,994 outstanding ($0.43 to $14.40 strike, expiring March 2029 - December 2032).
* Convertible Note Warrants: 868,098 outstanding ($4.18 strike, expiring October 2027).
Management has routinely repriced these instruments. On February 14, 2025, warrants held by executives (including CFO John Ayanoglou) were repriced to a floor of $0.43. On the same date, CEO Waqaas Al-Siddiq had 933,000 options canceled and replaced with 900,000 immediately-vesting options at $0.43. Outstanding options total 3,048,663 shares (weighted average strike of $1.13, 6.01 years remaining). Equity incentive plans maintain aggressive "evergreen" dilution limits, with automatic annual pool expansions of 15% (2016 Plan) and 10% (2023 Plan).
Convertible instruments introduce additional volatility. The $621,500 Series A Replacement Note converts at a 25% discount to market prices (specifically, 75% of the average of the three lowest closing prices in the ten trading days preceding conversion), creating a potential dilutive spiral. Conversion of only 30 shares of Series B Preferred Stock in FY 2026 triggered the issuance of 2,506,020 common shares.
Fourth, corporate governance changes have insulated management from market forces. On May 1, 2026, officers and directors executed exchange agreements, converting 14,144,325 common shares, 3,992,427 options, and 1,436,216 warrants into 1,957,297 shares of a newly created Series C Preferred Stock (10-to-1 ratio). This Series C stock carries super-voting rights of 40 votes per share.
Following this transaction, insiders control 33.25% of the Series C tranche (with CEO Waqaas Al-Siddiq independently holding 25.2%), and the remaining shares are held by related parties (the Siddiqui/Rahman families). This concentration of voting power effectively protects current management from hostile acquisitions.
Furthermore, related-party balances are utilized to support working capital. Accounts payable as of March 31, 2026, included $1,053,228 owed to a shareholder-director-executive, up from $373,744 in FY 2025. In the prior year, the company issued 1,000,413 common shares to settle $741,316 of accounts payable owed to this individual.
Finally, compliance failures persist: CEO Waqaas Al-Siddiq, CFO John Ayanoglou, and Director David Rosa each failed to file Form 4 beneficial ownership disclosures on time in May 2026, and newly appointed Director Jainal Bhuiyan failed to file his initial Form 3. Although Biotricity Inc. is not currently party to any material legal or regulatory proceedings, its combination of high operational leverage and constrained liquidity presents a complex risk profile for institutional investors.
Presentation Download & Video Access:
- Presentation Download: Click the PDF download link under 'Related Topics' to access the full institutional presentation of this report.
- Video Link: Click this link to watch the HDIN analyst briefing on YouTube.
About HDIN Research:
HDIN Research is a premier global market intelligence and strategic advisory firm specializing in institutional-grade financial analysis, supply chain audits, and macroeconomic forecasting. Our dedicated sector analysts deliver actionable, data-driven insights tailored for private equity, hedge funds, and corporate strategy teams. Visit us at http://www.hdinresearch.com.
2026 AI Transparency Footer:
"This intelligence report was authored by HDIN Research analysts following a rigorous audit of official corporate filings. AI was utilized for massive-scale data synthesis and structural drafting, ensuring 100% inclusion of reported data points. All strategic insights, financial modeling, and final verdicts were verified by our editorial board to ensure professional accuracy and compliance with 2026 Google Search E-E-A-T standards."
1. Biotricity Inc. [OTC: BTCY] expanded FY 2026 revenue 16.0% YoY to $15,998,239, achieving its first positive EBITDA of $1,709,660 via an 84.3% margin TaaS model that reduces clinical data review times by 90%.
2. High default risk looms as a $31,284,762 working capital deficiency and a tiny $149,789 cash balance restrict organic runway to 2.5 months, triggering an active going concern warning.
3. A May 2026 capital restructure established super-voting Series C Preferred shares with a 40-to-1 vote ratio, consolidating 33.25% insider control and insulating management from takeover pressure.
Figure Biotricity Inc FY 2026: Strategic Transition to an Al-Driven 'Technology-as-a-Service' Model
Segmental Realities, AI-Driven Operating Leverage, and Cash RunwayDuring fiscal year (FY) 2026, Biotricity Inc. [OTC: BTCY] generated total revenue of $15,998,239, a 16.0% expansion compared to the $13,790,294 reported in FY 2025. Gross profit reached $12,948,798, yielding an overall gross margin of 81.0%, representing an expansion of 440 basis points (bps) from the 76.6% gross margin of the prior fiscal year.
This margin expansion was structurally driven by a decisive shift in the corporate revenue mix toward high-margin software services. The company's "Technology-as-a-Service" (TaaS) recurring revenue model generated $14,440,900 in Technology Fees, accounting for 90.3% of total revenue. Meanwhile, Device Sales (hardware) fell to $1,557,339, or 9.7% of the total.
The structural gross margin on technology fees expanded to 84.3% in FY 2026, up from 79.8% in FY 2025, and peaked at 90.1% during Q4 FY 2026. This operational leverage was driven by the deployment of the FDA-cleared Bioflux Software II System and proprietary AI capabilities, which compressed the estimated manual ECG data review time per study from 5 minutes to 30 seconds. Consequently, despite top-line growth, the absolute Cost of Revenue declined 5.5% to $3,049,441 in FY 2026 from $3,225,803 in FY 2025.
Due to improved top-line performance and workflow automation, Biotricity Inc. posted a positive EBITDA of $1,709,660, a structural turnaround from the negative EBITDA of $3,213,372 recorded in FY 2025. The net loss attributable to common stockholders narrowed by 73.8% to $3,128,458 (a loss of $0.115 per share), down from a net loss of $11,942,000 (a loss of $0.555 per share) in FY 2025.
Table Financial Performance Metrics (FY2025–FY2026)
| Financial Metric | FY2025 Value (USD) | FY2026 Value (USD) | YoY Change / Key Ratios |
|---|---|---|---|
| Total Revenue | $13.79M | $16.00M | +16.0% |
| Technology Fees (TaaS) | $11.00M (Estimated) | $14.44M | 90.3% of Total Revenue |
| Device Sales (Hardware) | $2.79M (Estimated) | $1.56M | 9.7% of Total Revenue |
| Gross Profit | $10.56M | $12.95M | 81.0% Gross Margin (+440 bps) |
| Technology Gross Margin | 79.8% | 84.3% | Peak Q4 Margin: 90.1% |
| EBITDA | ($3.21M) | $1.71M | +$4.92M Improvement (Turnaround) |
| Net Loss Attributable to Common Shareholders | ($11.94M) | ($3.13M) | -73.8% (Loss Narrowed) |
| Diluted Loss Per Share | ($0.555) | ($0.115) | Loss reduced by $0.440 per share |
| R&D Expense | $2.16M | $2.76M | +28.2% YoY; 17.3% of Revenue |
| Cost of Revenue | $3.23M | $3.05M | -5.5% (Absolute Reduction) |
Despite these operational efficiencies, Biotricity Inc. faces a critical liquidity bottleneck. As of March 31, 2026, the company reported cash and cash equivalents of only $149,789. Net cash used in operating activities was disciplined at $718,955 for FY 2026, down from $2,380,177 in FY 2025, yielding an average monthly operational cash burn rate of $59,913.
Dividing the ending cash balance by this burn rate indicates an organic operational runway of approximately 2.5 months. Consequently, independent auditors have issued an explanatory going concern warning.
The company's balance sheet exhibits a distressed capitalization structure:
* Total Assets: $6,446,488 (including $346,214 in Right-of-Use assets and a nominal $3,646 in physical PP&E).
* Total Liabilities: $39,408,954.
* Accumulated Deficit: $142,570,243.
* Negative Stockholders’ Equity: $34,676,942.
* Working Capital Deficiency: $31,284,762 (Current Assets of $5,856,484 against Current Liabilities of $37,141,246).
The current liability structure is heavily weighted toward short-term obligations:
* Current Portion of Term Loans: $14,680,914 (primarily SWK Funding LLC).
* Convertible Notes & Short-Term Loans: $11,114,209.
* Accounts Payable & Accrued Liabilities: $8,970,870.
* Long-Term Liabilities: Consist of $870,800 in federally guaranteed loans and $1,396,908 in derivative liabilities. Outstanding indebtedness totals $26.7 million, with management estimating that an additional $10 million in capital is required to support US commercialization and prevent potential debt default.
Clinical-Grade Ecosystem, Infrastructure Moats, and IP Protection
Biotricity Inc.’s technology ecosystem spans clinical diagnostic devices and chronic disease management:
* Bioflux / Bioflux COM: FDA-cleared Mobile Cardiac Outpatient Telemetry (COM) solution released in April 2019. It operates as a one-piece device with 3-channel ECG capabilities and built-in cellular connectivity, bypassing traditional 2-piece, 2-channel competitor offerings.
* Biocore / Biocore Pro: Connected 3-channel patch platform targeting lower-risk Holter and Extended Holter monitor markets. It reduces diagnosis times from the industry standard of two weeks to under 3 days. The Biocore Pro, featuring global cellular chipset compatibility and up to 5 days of battery life, launched in October 2023 as the flagship technology.
* Bioheart: Direct-to-Consumer (D2C) continuous heart monitor launched between late 2021 and early 2022 for post-diagnostic management.
* Biocare & Biokit: Released in October 2022, this integration bundles a blood pressure cuff, pulse oximeter, and digital thermometer with diagnostic software to manage comorbidities such as hypertension and COPD.
Physically, the company operates out of Redwood City, California, and Toronto, Ontario. No operational facilities or distribution layouts are established in Saudi Arabia, Argentina, or Taiwan, China.
Biotricity Inc. relies on a single-source contract manufacturer, Providence Enterprises, creating concentration risks in the hardware supply chain. Hardware units utilize global cellular networks (such as AT&T and Verizon equivalents) to transmit continuous ECG data to Google TensorFlow and Amazon Web Services (AWS) cloud-based AI engines.
The company's intellectual property and regulatory status are summarized below:
* Patent and Trademark Deficiencies: Biotricity Inc. holds zero utility patents. Its patent portfolio is limited to a single industrial design patent filed in Canada and the United States. Its core AI software algorithms (Bioflux Software II) and data assets rely entirely on trade secret protection, unpatented know-how, and unregistered copyrights.
* Regulatory Timeline: The company holds active FDA 510(k) clearances for Bioflux (2018/2019), Bioflux Software II (2021), and Biocore (January 2022). Its next-generation "Biocore Pro 2.0" and advanced ECG algorithms are in the pre-submission development phase, with target FDA applications slated for the next 12 months. The pipeline has not faced active regulatory inquiries or clinical holds.
* R&D Allocations: FY 2026 R&D expenses increased 28.2% (+$608,537) to $2,764,197, or 17.3% of revenue, up from $2,155,660 (15.6% of revenue) in FY 2025. This capital is expensed immediately, preventing capitalized software assets from inflating the balance sheet. R&D is partially offset by a National Institutes of Health (NIH) grant awarded in September 2022, with $238,703 utilized in March 2023 for stroke prediction models.
HDIN Institutional Verdict
An analysis of Biotricity Inc.'s financial structures indicates a divergence between its positive operating metrics and its structural capital market risks. While the "insourcing" TaaS model successfully captures direct healthcare reimbursements (~$850 per COM study and ~$200 per Holter read) across 35 U.S. states, the company's financial foundation remains highly fragile.
First, the company's credit provisioning exhibits an aggressive accounting profile. Gross accounts receivable totaled $3,003,725 (comprising $1,911,354 in trade receivables and $1,092,371 in other receivables) as of March 31, 2026. Trade receivables past due for more than 90 days totaled $360,883 ($329,511 in the 91-180 days bracket, and $31,372 over 180 days).
The allowance for expected credit losses stands at only $70,826, covering less than 20% of these past-due accounts. Furthermore, the company wrote off $74,780 in bad debt in FY 2026 but provisioned only $14,746. High customer concentration—with two clients accounting for 20% and 10% of total FY 2026 revenues (and one customer accounting for 29% in FY 2025)—amplifies the risk of material asset write-downs.
Second, the company's lease liabilities utilize a weighted-average incremental borrowing rate of 11.4% on its Operating Lease Liability of $397,830 (ROU asset of $346,214). This double-digit discount rate reflects a high cost of capital. Total cash lease commitments of $411,170 are due in 2026, dropping to $0 in 2027, highlighting a short-term operational posture.
Third, the company’s capital structure presents significant dilution and solvency risks. The SWK Funding LLC Credit Agreement is secured by a blanket lien on all corporate assets, including its entire intellectual property portfolio. Outstanding warrants total 3,263,169 shares:
* Broker Warrants: 956,077 outstanding ($0.37 to $37.56 strike prices, expiring August 2026 - October 2033).
* Consultant & Noteholder Warrants: 1,438,994 outstanding ($0.43 to $14.40 strike, expiring March 2029 - December 2032).
* Convertible Note Warrants: 868,098 outstanding ($4.18 strike, expiring October 2027).
Management has routinely repriced these instruments. On February 14, 2025, warrants held by executives (including CFO John Ayanoglou) were repriced to a floor of $0.43. On the same date, CEO Waqaas Al-Siddiq had 933,000 options canceled and replaced with 900,000 immediately-vesting options at $0.43. Outstanding options total 3,048,663 shares (weighted average strike of $1.13, 6.01 years remaining). Equity incentive plans maintain aggressive "evergreen" dilution limits, with automatic annual pool expansions of 15% (2016 Plan) and 10% (2023 Plan).
Convertible instruments introduce additional volatility. The $621,500 Series A Replacement Note converts at a 25% discount to market prices (specifically, 75% of the average of the three lowest closing prices in the ten trading days preceding conversion), creating a potential dilutive spiral. Conversion of only 30 shares of Series B Preferred Stock in FY 2026 triggered the issuance of 2,506,020 common shares.
Fourth, corporate governance changes have insulated management from market forces. On May 1, 2026, officers and directors executed exchange agreements, converting 14,144,325 common shares, 3,992,427 options, and 1,436,216 warrants into 1,957,297 shares of a newly created Series C Preferred Stock (10-to-1 ratio). This Series C stock carries super-voting rights of 40 votes per share.
Following this transaction, insiders control 33.25% of the Series C tranche (with CEO Waqaas Al-Siddiq independently holding 25.2%), and the remaining shares are held by related parties (the Siddiqui/Rahman families). This concentration of voting power effectively protects current management from hostile acquisitions.
Furthermore, related-party balances are utilized to support working capital. Accounts payable as of March 31, 2026, included $1,053,228 owed to a shareholder-director-executive, up from $373,744 in FY 2025. In the prior year, the company issued 1,000,413 common shares to settle $741,316 of accounts payable owed to this individual.
Finally, compliance failures persist: CEO Waqaas Al-Siddiq, CFO John Ayanoglou, and Director David Rosa each failed to file Form 4 beneficial ownership disclosures on time in May 2026, and newly appointed Director Jainal Bhuiyan failed to file his initial Form 3. Although Biotricity Inc. is not currently party to any material legal or regulatory proceedings, its combination of high operational leverage and constrained liquidity presents a complex risk profile for institutional investors.
Presentation Download & Video Access:
- Presentation Download: Click the PDF download link under 'Related Topics' to access the full institutional presentation of this report.
- Video Link: Click this link to watch the HDIN analyst briefing on YouTube.
About HDIN Research:
HDIN Research is a premier global market intelligence and strategic advisory firm specializing in institutional-grade financial analysis, supply chain audits, and macroeconomic forecasting. Our dedicated sector analysts deliver actionable, data-driven insights tailored for private equity, hedge funds, and corporate strategy teams. Visit us at http://www.hdinresearch.com.
2026 AI Transparency Footer:
"This intelligence report was authored by HDIN Research analysts following a rigorous audit of official corporate filings. AI was utilized for massive-scale data synthesis and structural drafting, ensuring 100% inclusion of reported data points. All strategic insights, financial modeling, and final verdicts were verified by our editorial board to ensure professional accuracy and compliance with 2026 Google Search E-E-A-T standards."