Artificial Intelligence Technology Solutions Inc.: Hardware-Enabled SaaS Fleet Expansion Near Michigan Assembly Facility as 7.1x Liability-to-Asset Multiple Signals Insolvency Risk
Date : 2026-07-21
Reading : 225
HDIN Market Intelligence Brief
1. Insolvency Risk: Artificial Intelligence Technology Solutions Inc. [OTCPK: AITX] exhibits a 7.1x liability-to-asset multiple, driven by a $41.89M working capital deficit and $94,643 in cash.
2. Uncapitalized R&D Burn: A $20M uncapitalized investment in the ROAMEO mobile platform relies on 91% related-party debt concentration.
3. Hyper-Dilutive Structure: Unexercised convertible equivalents represent 4.55B shares, threatening a 1,080% dilution insulated by the CEO's 66.67% voting monopoly.
Figure AITX CORPORATE ANALYSIS: OPERATIONAL MATRIX & STRUCTURAL RISK ASSESSMENT
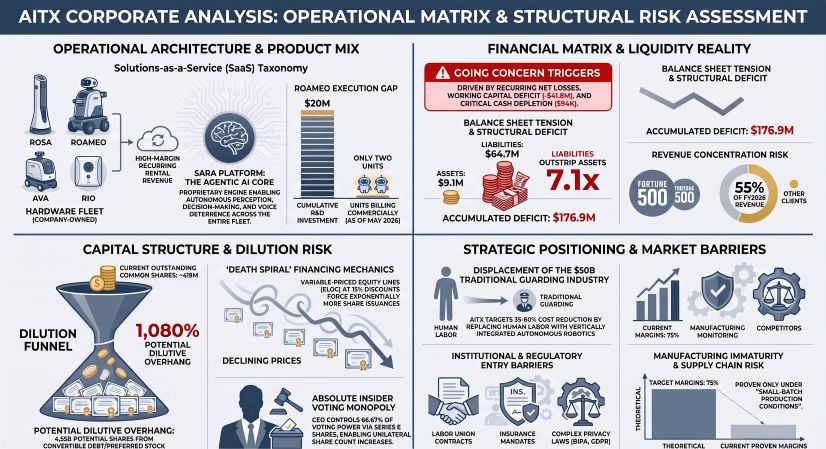 Segmental Realities, Subscription Economics, and Balance Sheet Insolvency
A forensic audit of the balance sheet of Artificial Intelligence Technology Solutions Inc. reveals a classic insolvency profile. Total liabilities outstrip total assets by a multiple of 7.1x, and current obligations dwarf available liquidity. The independent registered public accounting firm, L J Soldinger Associates, LLC, issued an explanatory going concern warning, which is supported by negative operating cash flows and an inability to internally fund operations.
The physical asset base of the company contracted by 17.3% over a 15-month period, reflecting capital starvation. Meanwhile, total liabilities expanded by 6.9%, driving the Liability-to-Asset ratio from 5.5x in FY25 to 7.1x in Q1 FY27.
Table: Financial Position, Liquidity Profile, and Balance Sheet Risk Analysis (FY2025–Q1 FY2027)
*Note: Q1 FY27 Net Loss represents a three-month period.
The commercial architecture of the company is built on a "Solutions-as-a-Service" (SaaS) model. Instead of outright equipment sales, the transaction structure is treated as an operating lease. The company retains ownership of the deployed hardware, capitalizing raw parts from "device parts inventory" to "revenue-earning devices" on the balance sheet, depreciating them on a straight-line basis over an estimated useful life of 48 months.
To expand its fleet, the company transferred $2,632,720 from inventory to revenue-earning devices in FY26, and capitalized an additional $276,717 in Q1 FY27. Total capitalized revenue-earning devices stood at $4,850,345 (net of $3,781,667 in accumulated depreciation, representing a gross fleet value of $8,632,012) as of May 31, 2026.
The revenue mix demonstrates an overwhelming reliance on recurring device rentals over outright hardware sales:
* FY26 Revenue Mix: Device rentals comprised 89.3% ($6,920,336) of the $7,745,336 total revenue; direct sales contributed 10.7% ($825,000).
* Q1 FY27 Revenue Mix: Rentals accounted for 88.1% ($1,613,095) of the $1,831,202 total; direct sales comprised 11.9% ($218,107).
While management projects subscription gross margins exceeding 75% over unit deployment lifecycles and direct sales margins exceeding 50%, these targets are modeled under small-batch production conditions. Blended gross margin stood at approximately 61% in FY25, expanded to 71% in FY26, and contracted to 65% in Q1 FY27 (down from 67% in Q1 FY26).
This margin volatility is exacerbated by customer concentration. Two customers accounted for 55% of total revenue in FY26. In Q1 FY27, two customers accounted for 36% of total revenue, following a reduction in orders from a major logistics customer that previously represented 48% of the company's revenue in Q1 FY26 (contracting to 21% in Q1 FY27).
Infrastructure Architecture, Offshore Engineering, and Distribution Channels
The company operates a vertically integrated model that separates physical hardware manufacturing from advanced software engineering across distinct global jurisdictions.
* Manufacturing Footprint: Final assembly, system integration, software loading, and quality assurance are centralized at a dedicated facility in Ferndale, Michigan, United States. Sub-components—including machined metals, plastics, and printed circuit boards—are sourced from a distributed network of domestic and international suppliers.
* R&D Footprint: Advanced AI modeling, SARA software engineering, and technical operations are conducted through a wholly-owned subsidiary, RAD Lanka (Private) Limited, located in the Port City Colombo special economic zone in Sri Lanka. This offshore structure provides tax efficiencies but exposes the company to international trade secret enforcement risks.
* Global Personnel: The company maintains a total headcount of approximately 135 employees distributed across the United States, Canada, the United Kingdom, and Asia.
The product and software portfolio targets the $50 billion traditional guarding and physical security market in North America (the United States and Canada), offering cost savings of 35% to 80% compared to human guards.
* SARA™ (Speaking Autonomous Responsive Agent): The proprietary, agentic AI platform that enables autonomous perception, decision-making, and communication. SARA is licensed to central station monitoring software platforms like Immix.
* Stationary Solutions (RAD-I): The largest and most mature segment, with approximately 1,000 total devices deployed. Core products include ROSA™ (stationary perimeter monitoring), RIO™ (portable, solar-powered security towers utilizing ROSA, with hundreds deployed), AVA™ (vehicle gate access with license plate recognition), and TOM™ (credentialed pedestrian visitor management, driven by a major third-party logistics provider). The company also markets ROSS™ and RAM™ modules to augment third-party IP security cameras.
* Mobile Autonomous Platforms (RAD-M): Centered on ROAMEO™, an outdoor, fully autonomous mobile security vehicle. Despite a cumulative development investment of approximately $20 million, commercial billing had only commenced on exactly two (2) ROAMEO units in May 2026 (deployed at a logistics operator and a healthcare group).
* Residential Solutions (RAD-R): Centered on RADCam™, an AI-powered residential security camera. This segment generated an immaterial amount of revenue in FY26, substantially underperforming due to high consumer marketing customer acquisition costs (CAC).
* Distribution Channels: While direct enterprise accounts are managed by a Senior VP of Sales and the CEO, the company relies on an authorized dealer network of over 100 dealers across the US, Canada, and the EU to penetrate middle-market accounts. No sales, deployments, or operations are conducted in the Taiwan region.
HDIN Institutional Verdict
The company's commercial claims of high-margin, disruptive Industry 4.0 physical security are contradicted by a capital-starved balance sheet and a highly dilutive financing structure. The $20 million investment in the ROAMEO platform cannot be capitalized under ASC 730 and remains a sunk operating cost.
The company's survival depends on a "death spiral" financing loop, supported by a 12-billion authorized share ceiling (effective July 15, 2026, following a 1-for-100 reverse stock split effective March 12, 2026). This authorized ceiling represents a 2,700% expansion capacity over the 419,371,776 common shares outstanding as of July 15, 2026 (outstanding shares grew from 144,124,538 on Feb 28, 2025, to 267,872,804 on Feb 28, 2026, and 388,482,589 on May 31, 2026).
As of May 31, 2026, the company's unexercised convertible instruments represented a latent supply of 4,546,766,258 common shares, threatening a 1,080% dilution of current public equity holders:
* Convertible/Exchangeable Debt: 3,173,350,733 shares.
* Series F Preferred Shares: 1,340,264,933 shares (convertible via a multiplier formula that grants the holder 3.45 times the company's total issued and outstanding common shares at the time of conversion).
* Series C Preferred Shares: 30,948,471 shares (354 shares outstanding, down from 417 on Feb 28, 2026, carrying a 12% annual dividend and a 10% discount conversion rate).
* Stock Options and Warrants: 2,202,121 shares (470,000 warrants at a $0.02 exercise price, 939 Series F warrants at $1.00, and 1,732,121 employee options at $2.00).
This structural dilution is funded through variable-priced financing, such as the June 23, 2026 Trillium Partners LP Equity Line of Credit (ELOC), registering up to 1,550,000,000 Put Shares and 5,000,000 Commitment Shares to draw down up to $10 million over 36 months at a 15% discount.
The debt profile is highly concentrated and carries severe refinancing risk. Total loans payable of $35,722,327 are structured as follows:
* Short-Term Debt: $27,769,326 gross (77.7% of total principal) is due within 12 months.
* Long-Term Debt: $7,953,001 net of discount, maturing in the fiscal year ending February 29, 2028, following an April 16, 2025 blanket extension that pushed maturities from March 1, 2025, to March 1, 2027.
* Related-Party Concentration: 91% ($32,466,506) of loans payable are owed to companies controlled by CEO Steven Reinharz (down from 95.6% or $32,178,506 on Feb 28, 2026). Promissory notes carry standard interest rates of 12% to 15%, which shifted from simple interest to compounding annually on March 1, 2026 (per a June 15, 2026 amendment).
* Exotic Debt Instruments: The company utilizes Future Receivables Purchase Agreements carrying effective interest rates of 35% and 108% per annum, alongside Deferred Variable Payment Obligations that skim quarterly revenue (e.g., 9.65%). During Q1 FY27, the related-party lender converted $336,000 in accrued interest into 14,000,000 common shares, causing a loss on debt settlement of $574,700.
Corporate governance lacks standard public company protections. Steven Reinharz (age 50) serves as CEO, Secretary, CTO, and the sole Director. Anthony Brenz (age 64) serves as CFO. There are zero independent directors, and there are no separate audit, compensation, or governance committees.
Steven Reinharz holds 3,350,000 shares of Series E Preferred Stock, granting him super-voting rights equal to twice the votes of all outstanding equity combined—effectively a permanent 66.67% voting monopoly. This allows the CEO to unilaterally approve his own compensation, which includes:
* Steven Reinharz Compensation: FY26 total compensation of $2,920,000 ($420,000 base, $0 bonus, $1,500,000 stock, $1,000,000 deferred compensation); FY25 total of $4,320,000 ($320,000 base, $836,167 bonus, $1,500,000 stock, $1,663,833 deferred compensation). Original April 2021 employment base was $240,000, with subsequent board discretionary compensation approvals of $1.0 million in December 2023 and $1.5 million in February 2026.
* Anthony Brenz Compensation: FY26 total of $213,055 ($211,865 base, $0 bonus, $0 stock, $1,200 other); FY25 total of $208,988 ($200,408 base, $1,000 bonus, $17,975 stock, $1,200 other).
* CEO-Affiliated Direct Liabilities: $331,946 direct loan (including $255,414 deferred salary and interest, with $157,513 accruing 12% interest); deferred compensation liability of $1,990,751; Series G Preferred Shares Incentive Plan liability of $5,500,000 (redeemable at $1,000 per share).
* R&D Related-Party Consulting Fees: Paid to an external company partially owned by Steven Reinharz, totaling $2,576,111 in FY26, $2,541,180 in FY25, and $390,130 in Q1 FY27. The outstanding balance owed to this entity was $160,557 at Feb 28, 2026, and $76,532 at May 31, 2026.
Operating without direct patent protection, the company relies solely on trade secrets and copyrights to protect SARA, RADSoC, and ROAMEO. This leaves it vulnerable to reverse engineering by better-capitalized competitors. Furthermore, displacing traditional human guards is constrained by non-technological barriers, including labor union collective bargaining agreements, corporate insurance mandates for physical guards, and strict data privacy regulations like the Illinois Biometric Information Privacy Act (BIPA), California Consumer Privacy Act (CCPA), and European GDPR.
Presentation Download & Video Access:
Presentation Download: Click the PDF download link under 'Related Topics' to access the full institutional presentation of this report.
Video Link: Click this link to watch the HDIN analyst briefing on YouTube.
About HDIN Research:
HDIN Research is a premier global market intelligence and strategic advisory firm specializing in institutional-grade financial analysis, supply chain audits, and macroeconomic forecasting. Our dedicated sector analysts deliver actionable, data-driven insights tailored for private equity, hedge funds, and corporate strategy teams. Visit us at http://www.hdinresearch.com.
2026 AI Transparency Footer:
"This intelligence report was authored by HDIN Research analysts following a rigorous audit of official corporate filings. AI was utilized for massive-scale data synthesis and structural drafting, ensuring 100% inclusion of reported data points. All strategic insights, financial modeling, and final verdicts were verified by our editorial board to ensure professional accuracy and compliance with 2026 Google Search E-E-A-T standards."
1. Insolvency Risk: Artificial Intelligence Technology Solutions Inc. [OTCPK: AITX] exhibits a 7.1x liability-to-asset multiple, driven by a $41.89M working capital deficit and $94,643 in cash.
2. Uncapitalized R&D Burn: A $20M uncapitalized investment in the ROAMEO mobile platform relies on 91% related-party debt concentration.
3. Hyper-Dilutive Structure: Unexercised convertible equivalents represent 4.55B shares, threatening a 1,080% dilution insulated by the CEO's 66.67% voting monopoly.
Figure AITX CORPORATE ANALYSIS: OPERATIONAL MATRIX & STRUCTURAL RISK ASSESSMENT
Segmental Realities, Subscription Economics, and Balance Sheet InsolvencyA forensic audit of the balance sheet of Artificial Intelligence Technology Solutions Inc. reveals a classic insolvency profile. Total liabilities outstrip total assets by a multiple of 7.1x, and current obligations dwarf available liquidity. The independent registered public accounting firm, L J Soldinger Associates, LLC, issued an explanatory going concern warning, which is supported by negative operating cash flows and an inability to internally fund operations.
The physical asset base of the company contracted by 17.3% over a 15-month period, reflecting capital starvation. Meanwhile, total liabilities expanded by 6.9%, driving the Liability-to-Asset ratio from 5.5x in FY25 to 7.1x in Q1 FY27.
Table: Financial Position, Liquidity Profile, and Balance Sheet Risk Analysis (FY2025–Q1 FY2027)
| Metric (USD) | FY Ended Feb. 28, 2025 | FY Ended Feb. 28, 2026 | Q1 Ended May 31, 2026 | Trend / Variance Analysis |
|---|---|---|---|---|
| Total Assets | $10,985,797 | $9,302,228 | $9,079,874 | Declined 17.3% over 15 months, indicating limited reinvestment capacity |
| Total Liabilities | $60,514,725 | $61,965,374 | $64,719,119 | Increased 6.9%, pushing leverage to a 7.1x ratio in Q1 FY2027 |
| Net Loss | $(18,935,592) | $(14,510,251) | $(5,715,838)* | Annualized loss run rate of approximately $22.8M against a $1.8M Q1 revenue base |
| Accumulated Deficit | $(156,496,930) | $(171,121,742) | $(176,931,052) | Continued capital erosion with no historical profitability achieved |
| Cash Reserves | — | $109,043 | $94,643 | Severely constrained liquidity, declining further from FY2026 levels |
| Working Capital | — | $(17,017,745) | $(41,885,156) | Deficit widened by 146.1% within three months |
| Current Assets | — | — | $3,005,227 | Includes cash, parts inventory, and other short-term assets |
| Current Liabilities | — | — | $44,890,383 | Near-term obligations resulting in a current ratio of only 0.067x |
| Operating Cash Flow | $(12,196,388) | $(9,344,534) | $(2,759,307) | Persistent cash outflows requiring continued external financing and potential shareholder dilution |
The commercial architecture of the company is built on a "Solutions-as-a-Service" (SaaS) model. Instead of outright equipment sales, the transaction structure is treated as an operating lease. The company retains ownership of the deployed hardware, capitalizing raw parts from "device parts inventory" to "revenue-earning devices" on the balance sheet, depreciating them on a straight-line basis over an estimated useful life of 48 months.
To expand its fleet, the company transferred $2,632,720 from inventory to revenue-earning devices in FY26, and capitalized an additional $276,717 in Q1 FY27. Total capitalized revenue-earning devices stood at $4,850,345 (net of $3,781,667 in accumulated depreciation, representing a gross fleet value of $8,632,012) as of May 31, 2026.
The revenue mix demonstrates an overwhelming reliance on recurring device rentals over outright hardware sales:
* FY26 Revenue Mix: Device rentals comprised 89.3% ($6,920,336) of the $7,745,336 total revenue; direct sales contributed 10.7% ($825,000).
* Q1 FY27 Revenue Mix: Rentals accounted for 88.1% ($1,613,095) of the $1,831,202 total; direct sales comprised 11.9% ($218,107).
While management projects subscription gross margins exceeding 75% over unit deployment lifecycles and direct sales margins exceeding 50%, these targets are modeled under small-batch production conditions. Blended gross margin stood at approximately 61% in FY25, expanded to 71% in FY26, and contracted to 65% in Q1 FY27 (down from 67% in Q1 FY26).
This margin volatility is exacerbated by customer concentration. Two customers accounted for 55% of total revenue in FY26. In Q1 FY27, two customers accounted for 36% of total revenue, following a reduction in orders from a major logistics customer that previously represented 48% of the company's revenue in Q1 FY26 (contracting to 21% in Q1 FY27).
Infrastructure Architecture, Offshore Engineering, and Distribution Channels
The company operates a vertically integrated model that separates physical hardware manufacturing from advanced software engineering across distinct global jurisdictions.
* Manufacturing Footprint: Final assembly, system integration, software loading, and quality assurance are centralized at a dedicated facility in Ferndale, Michigan, United States. Sub-components—including machined metals, plastics, and printed circuit boards—are sourced from a distributed network of domestic and international suppliers.
* R&D Footprint: Advanced AI modeling, SARA software engineering, and technical operations are conducted through a wholly-owned subsidiary, RAD Lanka (Private) Limited, located in the Port City Colombo special economic zone in Sri Lanka. This offshore structure provides tax efficiencies but exposes the company to international trade secret enforcement risks.
* Global Personnel: The company maintains a total headcount of approximately 135 employees distributed across the United States, Canada, the United Kingdom, and Asia.
The product and software portfolio targets the $50 billion traditional guarding and physical security market in North America (the United States and Canada), offering cost savings of 35% to 80% compared to human guards.
* SARA™ (Speaking Autonomous Responsive Agent): The proprietary, agentic AI platform that enables autonomous perception, decision-making, and communication. SARA is licensed to central station monitoring software platforms like Immix.
* Stationary Solutions (RAD-I): The largest and most mature segment, with approximately 1,000 total devices deployed. Core products include ROSA™ (stationary perimeter monitoring), RIO™ (portable, solar-powered security towers utilizing ROSA, with hundreds deployed), AVA™ (vehicle gate access with license plate recognition), and TOM™ (credentialed pedestrian visitor management, driven by a major third-party logistics provider). The company also markets ROSS™ and RAM™ modules to augment third-party IP security cameras.
* Mobile Autonomous Platforms (RAD-M): Centered on ROAMEO™, an outdoor, fully autonomous mobile security vehicle. Despite a cumulative development investment of approximately $20 million, commercial billing had only commenced on exactly two (2) ROAMEO units in May 2026 (deployed at a logistics operator and a healthcare group).
* Residential Solutions (RAD-R): Centered on RADCam™, an AI-powered residential security camera. This segment generated an immaterial amount of revenue in FY26, substantially underperforming due to high consumer marketing customer acquisition costs (CAC).
* Distribution Channels: While direct enterprise accounts are managed by a Senior VP of Sales and the CEO, the company relies on an authorized dealer network of over 100 dealers across the US, Canada, and the EU to penetrate middle-market accounts. No sales, deployments, or operations are conducted in the Taiwan region.
HDIN Institutional Verdict
The company's commercial claims of high-margin, disruptive Industry 4.0 physical security are contradicted by a capital-starved balance sheet and a highly dilutive financing structure. The $20 million investment in the ROAMEO platform cannot be capitalized under ASC 730 and remains a sunk operating cost.
The company's survival depends on a "death spiral" financing loop, supported by a 12-billion authorized share ceiling (effective July 15, 2026, following a 1-for-100 reverse stock split effective March 12, 2026). This authorized ceiling represents a 2,700% expansion capacity over the 419,371,776 common shares outstanding as of July 15, 2026 (outstanding shares grew from 144,124,538 on Feb 28, 2025, to 267,872,804 on Feb 28, 2026, and 388,482,589 on May 31, 2026).
As of May 31, 2026, the company's unexercised convertible instruments represented a latent supply of 4,546,766,258 common shares, threatening a 1,080% dilution of current public equity holders:
* Convertible/Exchangeable Debt: 3,173,350,733 shares.
* Series F Preferred Shares: 1,340,264,933 shares (convertible via a multiplier formula that grants the holder 3.45 times the company's total issued and outstanding common shares at the time of conversion).
* Series C Preferred Shares: 30,948,471 shares (354 shares outstanding, down from 417 on Feb 28, 2026, carrying a 12% annual dividend and a 10% discount conversion rate).
* Stock Options and Warrants: 2,202,121 shares (470,000 warrants at a $0.02 exercise price, 939 Series F warrants at $1.00, and 1,732,121 employee options at $2.00).
This structural dilution is funded through variable-priced financing, such as the June 23, 2026 Trillium Partners LP Equity Line of Credit (ELOC), registering up to 1,550,000,000 Put Shares and 5,000,000 Commitment Shares to draw down up to $10 million over 36 months at a 15% discount.
The debt profile is highly concentrated and carries severe refinancing risk. Total loans payable of $35,722,327 are structured as follows:
* Short-Term Debt: $27,769,326 gross (77.7% of total principal) is due within 12 months.
* Long-Term Debt: $7,953,001 net of discount, maturing in the fiscal year ending February 29, 2028, following an April 16, 2025 blanket extension that pushed maturities from March 1, 2025, to March 1, 2027.
* Related-Party Concentration: 91% ($32,466,506) of loans payable are owed to companies controlled by CEO Steven Reinharz (down from 95.6% or $32,178,506 on Feb 28, 2026). Promissory notes carry standard interest rates of 12% to 15%, which shifted from simple interest to compounding annually on March 1, 2026 (per a June 15, 2026 amendment).
* Exotic Debt Instruments: The company utilizes Future Receivables Purchase Agreements carrying effective interest rates of 35% and 108% per annum, alongside Deferred Variable Payment Obligations that skim quarterly revenue (e.g., 9.65%). During Q1 FY27, the related-party lender converted $336,000 in accrued interest into 14,000,000 common shares, causing a loss on debt settlement of $574,700.
Corporate governance lacks standard public company protections. Steven Reinharz (age 50) serves as CEO, Secretary, CTO, and the sole Director. Anthony Brenz (age 64) serves as CFO. There are zero independent directors, and there are no separate audit, compensation, or governance committees.
Steven Reinharz holds 3,350,000 shares of Series E Preferred Stock, granting him super-voting rights equal to twice the votes of all outstanding equity combined—effectively a permanent 66.67% voting monopoly. This allows the CEO to unilaterally approve his own compensation, which includes:
* Steven Reinharz Compensation: FY26 total compensation of $2,920,000 ($420,000 base, $0 bonus, $1,500,000 stock, $1,000,000 deferred compensation); FY25 total of $4,320,000 ($320,000 base, $836,167 bonus, $1,500,000 stock, $1,663,833 deferred compensation). Original April 2021 employment base was $240,000, with subsequent board discretionary compensation approvals of $1.0 million in December 2023 and $1.5 million in February 2026.
* Anthony Brenz Compensation: FY26 total of $213,055 ($211,865 base, $0 bonus, $0 stock, $1,200 other); FY25 total of $208,988 ($200,408 base, $1,000 bonus, $17,975 stock, $1,200 other).
* CEO-Affiliated Direct Liabilities: $331,946 direct loan (including $255,414 deferred salary and interest, with $157,513 accruing 12% interest); deferred compensation liability of $1,990,751; Series G Preferred Shares Incentive Plan liability of $5,500,000 (redeemable at $1,000 per share).
* R&D Related-Party Consulting Fees: Paid to an external company partially owned by Steven Reinharz, totaling $2,576,111 in FY26, $2,541,180 in FY25, and $390,130 in Q1 FY27. The outstanding balance owed to this entity was $160,557 at Feb 28, 2026, and $76,532 at May 31, 2026.
Operating without direct patent protection, the company relies solely on trade secrets and copyrights to protect SARA, RADSoC, and ROAMEO. This leaves it vulnerable to reverse engineering by better-capitalized competitors. Furthermore, displacing traditional human guards is constrained by non-technological barriers, including labor union collective bargaining agreements, corporate insurance mandates for physical guards, and strict data privacy regulations like the Illinois Biometric Information Privacy Act (BIPA), California Consumer Privacy Act (CCPA), and European GDPR.
Presentation Download & Video Access:
Presentation Download: Click the PDF download link under 'Related Topics' to access the full institutional presentation of this report.
Video Link: Click this link to watch the HDIN analyst briefing on YouTube.
About HDIN Research:
HDIN Research is a premier global market intelligence and strategic advisory firm specializing in institutional-grade financial analysis, supply chain audits, and macroeconomic forecasting. Our dedicated sector analysts deliver actionable, data-driven insights tailored for private equity, hedge funds, and corporate strategy teams. Visit us at http://www.hdinresearch.com.
2026 AI Transparency Footer:
"This intelligence report was authored by HDIN Research analysts following a rigorous audit of official corporate filings. AI was utilized for massive-scale data synthesis and structural drafting, ensuring 100% inclusion of reported data points. All strategic insights, financial modeling, and final verdicts were verified by our editorial board to ensure professional accuracy and compliance with 2026 Google Search E-E-A-T standards."