Guangdong Topstar Technology Co., Ltd.: Standardized Hardware Pivot in Dongguan Restructures Operating Leverage as High-End CNC Sourcing Bottlenecks Cap Embodied AI Margins
Date : 2026-07-22
Reading : 79
HDIN Executive Takeaways
1. Guangdong Topstar Technology Co., Ltd. [SHE: 300607] is executing a structural transition away from low-margin Smart Energy projects (contracting to 5.6% of revenue in Q1 2026) to high-margin, proprietary industrial automation hardware.
2. Balance sheet risks are elevated by extreme customer concentration, with a single consumer electronics anchor client (Client C) generating 49.1% of total Q1 2026 revenues ($36.75 million).
3. The high-end hardware margin profile faces structural limits due to a 95% external reliance on imported servo drives and CNC operating systems.
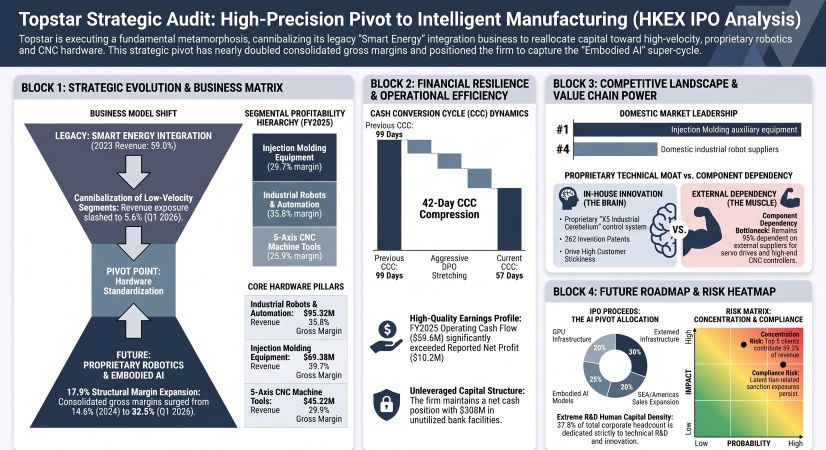
Figure Topstar Strategic Audit: High-Precision Pivot to intelligent Manufacturing
 Segmental Realities and Margin Compression
In the fiscal year 2025, Guangdong Topstar Technology Co., Ltd. generated total revenue of $349.23 million (CNY 2,510.08 million). Consolidated gross margin expanded from 17.6% in FY23 to 28.3% in FY25, and reached 32.5% in Q1 2026. This expansion was driven by the downsizing of the capital-intensive Smart Energy and Environmental Projects segment (which recorded a gross loss in FY24) and a deliberate product mix shift toward high-margin Injection Molding Equipment (39.7% margin in FY25) and Industrial Robots (35.8% margin in FY25).
Table: Core Business Segment Revenue Breakdown, Profitability, and Product Metrics (FY2025)
The cost structure remains highly exposed to upstream inputs. Raw materials and components (including steel, cables, control systems, castings, and servo motors) accounted for 92.3% of total COGS in FY25 and 90.1% in Q1 2026. Subcontracting fees comprised 32.2% of the raw material/component bucket. Due to an overall top-line revenue drop of 44.8% from FY23 to FY25, SG&A expenses experienced reverse operating leverage, with selling expenses rising to 7.5% of revenue and administrative expenses climbing to 9.7% in FY25.
To evaluate core operational performance, HDIN reconstructed the company’s net income by stripping away non-operating government grants and structural tax shields (15% High-Tech Enterprise tax rate and the 200% R&D Super Deduction):
Table: Adjusted Net Profit Analysis and Impact of Government Incentives (FY2023–Q1 2026)
Working capital efficiency shows a compressed Cash Conversion Cycle (CCC), dropping from 99 days in FY23 to 57 days in FY25. This was driven by a major stretch in Days Payable Outstanding (DPO) from 171 days to 290 days. Days Sales Outstanding (DSO) remains structurally elevated at 192 days in FY25 (down from 240 days in FY24), reflecting extended credit terms granted to consumer electronics anchors and project settlement delays. Days Inventory Outstanding (DIO) rose from 90 days in FY23 to 155 days in FY25, stretching further to 230 days by Q1 2026 due to pending automated workstation acceptances.
At Q1 2026, trade receivables and notes stood at $168.14 million, with $63.40 million in illiquid contract assets. Liquidity remains supported by a current ratio of 1.6x, a quick ratio of 1.2x, and unutilized bank facilities of $308.17 million (CNY 2,215.0 million). Total cash of $155.85 million offsets interest-bearing borrowings of $86.71 million ($37.30 million current, $49.41 million non-current). The capital structure was further deleveraged by the complete conversion or redemption of $93.22 million in convertible bonds by the end of 2024.
Infrastructure Layout and Regional Moats
Guangdong Topstar Technology Co., Ltd. operates a centralized production hub at No. 35 Lianhuan Road, Dalingshan Town, Dongguan City, Guangdong Province, China, spanning 252,985.4 square meters. Land use rights are held for 6 parcels totaling 261,562.7 square meters. The company leases an additional 96 properties (24,397.4 square meters), including 5,791 square meters of international bases. A minor asset vulnerability exists in Dongguan, where a 656-square-meter building lacks an ownership certificate and has been sub-leased. The company has also not completed lease registrations for Chinese properties exceeding 10,000 square meters.
Following the consolidation of activities into the main manufacturing base, older vacated sites were converted to sub-leases. The net book value of Investment Properties rose from zero in 2023 to $37.59 million in 2024, and to $59.02 million by 2025, generating a gross rental income of $5.19 million in FY25. A planned expansion at Panshany Industrial Park, Dalingshan Town, targets an annual capacity of 3,900 CNC machines by 2027.
Geographically, revenue is distributed as follows:
* Mainland China: $257.43 million (73.7%)
* Vietnam: $50.72 million (14.5%)
* Indonesia: $22.09 million (6.3%)
* Other Regions (Thailand, India, Singapore, etc.): $18.99 million (5.4%)
The R&D team consists of 803 personnel out of a 2,127 total headcount (37.8% density). As of March 31, 2026, the company holds 262 invention patents, 361 utility model patents, and 90 software copyrights. R&D spending stood at $19.20 million in 2023, $15.19 million in 2024, $18.14 million in 2025, and $4.30 million in Q1 2026. Three AI-enhanced workstation solutions commercialized in 2024 (Flexible Sorting, Embodied AI Palletizing, and AI-Driven Creative Block Assembly) generated $3.91 million during the track record period. Automation system sales climbed to 1,000 sets in Q1 2026 (from 300 sets in Q1 2025), expanding Q1 2026 consumer electronics revenue to $47.71 million (up from $22.72 million in Q1 2025).
The company's competitive positioning in China's $166.64 billion (CNY 1,197.7 billion) automated manufacturing equipment market is detailed below:
Table: Market Size, Competitive Positioning, and Market Share Benchmarking by Segment
The competitive benchmark for industrial robot solutions in Mainland China consists of:
* Company H (Japan, Tokyo listed): 7.0% market share
* Company I (Germany, Frankfurt listed): 5.7% market share
* Company F (Switzerland, NYSE/London listed): 4.3% market share
* Company J (Japan, Tokyo/Osaka/Fukuoka listed): 3.8% market share
* Company K (Japan, Tokyo listed): 2.8% market share
* Company A (China, Shenzhen listed): 2.6% market share
* Company B (China, Shenzhen listed): 1.9% market share
* Company D (China, Shanghai listed): 1.0% market share
* Company L (Japan, Tokyo listed): 0.7% market share
HDIN Institutional Verdict
Guangdong Topstar Technology Co., Ltd. is executing a necessary transition toward standardized high-margin hardware, but the strategy is constrained by execution risks and structural supply chain bottlenecks. While the company has developed its own X5 control systems, it remains dependent on external suppliers for 95% of its industrial robot servo drives. For its premium 5-axis CNC machines, it relies entirely on third-party imported control and servo systems. In Q1 2026, purchases of CNC operating systems from Supplier C (a Beijing-based supplier with $27.9 million registered capital) reached $2.77 million, or 6.1% of total procurement. Operational disruptions from relocating the Efome CNC facility in March 2024 also reduced CNC production from 314 units in 2023 to 260 units in 2024, causing goodwill impairment losses for the Efome CGU of $2.05 million in 2024 and $2.99 million in 2025.
This transition is further complicated by severe customer concentration. The Top 5 clients generated 59.5% of revenue in Q1 2026. A single smart device enclosure manufacturer in the consumer electronics sector (Client C) accounted for 49.1% of total Q1 2026 revenue ($36.75 million), up from 7.6% ($48.42 million) in 2023. This high concentration limits the company's ability to pass through raw material cost increases. Hardware sales require 20% to 30% upfront deposits, with the remaining 70% to 80% balance collected 6 to 12 months post-acceptance, which continues to put pressure on working capital.
To lower working capital requirements, the company has structured the carve-out of its legacy Smart Energy segment to entities controlled by former Executive Director Mr. Huang Daibo (Suzhou Boyi and Dongguan Junye). Under the Green Energy Project Master Framework Agreement, Topstar acts as an agent, retaining a 3% fee while outsourcing execution to these entities. The 2026 transaction cap is set at $76.27 million ($75.13 million for execution procurement, $1.14 million for product supply/leasing). While this reduces balance sheet risk, it introduces significant related-party complexity.
Figure Guangdong Topstar Technology Co., Ltd. IPO Capital Deployment Roadmap
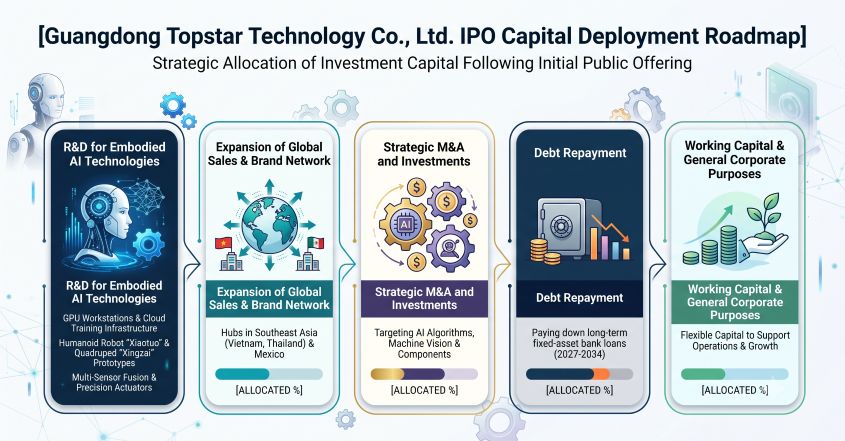
Capital raised from the proposed HKEX listing will fund this transition, focusing on the joint venture with Zhipu Huazhang (Guangdong Matrix Zhituo Technology Co., Ltd., where Topstar holds 51% and Zhipu holds 30%) to develop "embodied AI" applications.
However, corporate governance remains a key watchpoint. The CSRC flagged accounting inaccuracies in December 2025, which included premature revenue recognition of $1.11 million in 2023, delayed cost recognition of $0.56 million in 2024, and inadequate bad debt provisions of $0.16 million. Regulatory lapses also include a 2021 short-swing trading incident involving Chairman Wu Fengli and Director Zhang Peng, who returned $269,122 in profits, and a 2022 cash management issue involving $18.09 million in unauthorized structured deposits. Latent regulatory risks remain from five legacy Iran transactions ($173,792) settled in USD without an OFAC Voluntary Self-Disclosure, carrying a projected base penalty of $286,000, alongside secondary sanctions exposure from equipment exports to Russia and Belarus.
Presentation Download & Video Access:
- Presentation Download: Click the PDF download link under 'Related Topics' to access the full institutional presentation of this report.
- Video Link: Click this link to watch the HDIN analyst briefing on YouTube.
About HDIN Research:
HDIN Research is a premier global market intelligence and strategic advisory firm specializing in institutional-grade financial analysis, supply chain audits, and macroeconomic forecasting. Our dedicated sector analysts deliver actionable, data-driven insights tailored for private equity, hedge funds, and corporate strategy teams. Visit us at http://www.hdinresearch.com.
2026 AI Transparency Footer:
"This intelligence report was authored by HDIN Research analysts following a rigorous audit of official corporate filings. AI was utilized for massive-scale data synthesis and structural drafting, ensuring 100% inclusion of reported data points. All strategic insights, financial modeling, and final verdicts were verified by our editorial board to ensure professional accuracy and compliance with 2026 Google Search E-E-A-T standards."
1. Guangdong Topstar Technology Co., Ltd. [SHE: 300607] is executing a structural transition away from low-margin Smart Energy projects (contracting to 5.6% of revenue in Q1 2026) to high-margin, proprietary industrial automation hardware.
2. Balance sheet risks are elevated by extreme customer concentration, with a single consumer electronics anchor client (Client C) generating 49.1% of total Q1 2026 revenues ($36.75 million).
3. The high-end hardware margin profile faces structural limits due to a 95% external reliance on imported servo drives and CNC operating systems.
Figure Topstar Strategic Audit: High-Precision Pivot to intelligent Manufacturing
Segmental Realities and Margin CompressionIn the fiscal year 2025, Guangdong Topstar Technology Co., Ltd. generated total revenue of $349.23 million (CNY 2,510.08 million). Consolidated gross margin expanded from 17.6% in FY23 to 28.3% in FY25, and reached 32.5% in Q1 2026. This expansion was driven by the downsizing of the capital-intensive Smart Energy and Environmental Projects segment (which recorded a gross loss in FY24) and a deliberate product mix shift toward high-margin Injection Molding Equipment (39.7% margin in FY25) and Industrial Robots (35.8% margin in FY25).
Table: Core Business Segment Revenue Breakdown, Profitability, and Product Metrics (FY2025)
| Core Segment (FY2025) | Revenue ($ Millions) | % of Total Revenue | Gross Margin | Volume Sold (Units / Sets) | Average Selling Price (ASP) Range |
|---|---|---|---|---|---|
| Industrial Robots & Automation Systems | $95.32 | 27.3% | 35.8% | Robots: 10,400 unitsSystems: 1,300 sets | Robots: $1,308–$17,850 per unitSystems: $1,806–$2,043,863 per set |
| Injection Molding Equipment | $69.38 | 19.9% | 39.7% | Machines: 400 unitsAuxiliary equipment: 24,500 units | Machines: $13,913–$120,125 per unitAuxiliary equipment: $376–$6,247 per unit |
| CNC Machine Tools | $45.22 | 12.9% | 25.9% | 283 units | $61,496–$687,026 per unit |
| Smart Energy & Environmental Projects | $127.35 | 36.5% | 14.7% | N/A | N/A |
| Others (Rental, Spare Parts & Maintenance Services) | $18.52 | 5.3% | N/A | N/A | N/A |
The cost structure remains highly exposed to upstream inputs. Raw materials and components (including steel, cables, control systems, castings, and servo motors) accounted for 92.3% of total COGS in FY25 and 90.1% in Q1 2026. Subcontracting fees comprised 32.2% of the raw material/component bucket. Due to an overall top-line revenue drop of 44.8% from FY23 to FY25, SG&A expenses experienced reverse operating leverage, with selling expenses rising to 7.5% of revenue and administrative expenses climbing to 9.7% in FY25.
To evaluate core operational performance, HDIN reconstructed the company’s net income by stripping away non-operating government grants and structural tax shields (15% High-Tech Enterprise tax rate and the 200% R&D Super Deduction):
Table: Adjusted Net Profit Analysis and Impact of Government Incentives (FY2023–Q1 2026)
| Fiscal Period | Reported Net Profit ($ Millions) | Government Grants ($ Millions) | R&D Super Deduction Tax Shield ($ Millions) | HNTE Rate Tax Shield ($ Millions) | Organic Net Profit / (Loss) ($ Millions) |
|---|---|---|---|---|---|
| FY2023 | $14.75 | $4.29 | $2.83 | $0.06 | $7.57 |
| FY2024 | $(33.24) | $2.92 | $2.31 | $0.08 | $(38.55) |
| FY2025 | $10.18 | $4.72 | $2.62 | $0.10 | $2.74 |
| Q1 2026 | $5.96 | $0.53 | $0.66 | $0.0006 | $4.77 |
Working capital efficiency shows a compressed Cash Conversion Cycle (CCC), dropping from 99 days in FY23 to 57 days in FY25. This was driven by a major stretch in Days Payable Outstanding (DPO) from 171 days to 290 days. Days Sales Outstanding (DSO) remains structurally elevated at 192 days in FY25 (down from 240 days in FY24), reflecting extended credit terms granted to consumer electronics anchors and project settlement delays. Days Inventory Outstanding (DIO) rose from 90 days in FY23 to 155 days in FY25, stretching further to 230 days by Q1 2026 due to pending automated workstation acceptances.
At Q1 2026, trade receivables and notes stood at $168.14 million, with $63.40 million in illiquid contract assets. Liquidity remains supported by a current ratio of 1.6x, a quick ratio of 1.2x, and unutilized bank facilities of $308.17 million (CNY 2,215.0 million). Total cash of $155.85 million offsets interest-bearing borrowings of $86.71 million ($37.30 million current, $49.41 million non-current). The capital structure was further deleveraged by the complete conversion or redemption of $93.22 million in convertible bonds by the end of 2024.
Infrastructure Layout and Regional Moats
Guangdong Topstar Technology Co., Ltd. operates a centralized production hub at No. 35 Lianhuan Road, Dalingshan Town, Dongguan City, Guangdong Province, China, spanning 252,985.4 square meters. Land use rights are held for 6 parcels totaling 261,562.7 square meters. The company leases an additional 96 properties (24,397.4 square meters), including 5,791 square meters of international bases. A minor asset vulnerability exists in Dongguan, where a 656-square-meter building lacks an ownership certificate and has been sub-leased. The company has also not completed lease registrations for Chinese properties exceeding 10,000 square meters.
Following the consolidation of activities into the main manufacturing base, older vacated sites were converted to sub-leases. The net book value of Investment Properties rose from zero in 2023 to $37.59 million in 2024, and to $59.02 million by 2025, generating a gross rental income of $5.19 million in FY25. A planned expansion at Panshany Industrial Park, Dalingshan Town, targets an annual capacity of 3,900 CNC machines by 2027.
Geographically, revenue is distributed as follows:
* Mainland China: $257.43 million (73.7%)
* Vietnam: $50.72 million (14.5%)
* Indonesia: $22.09 million (6.3%)
* Other Regions (Thailand, India, Singapore, etc.): $18.99 million (5.4%)
The R&D team consists of 803 personnel out of a 2,127 total headcount (37.8% density). As of March 31, 2026, the company holds 262 invention patents, 361 utility model patents, and 90 software copyrights. R&D spending stood at $19.20 million in 2023, $15.19 million in 2024, $18.14 million in 2025, and $4.30 million in Q1 2026. Three AI-enhanced workstation solutions commercialized in 2024 (Flexible Sorting, Embodied AI Palletizing, and AI-Driven Creative Block Assembly) generated $3.91 million during the track record period. Automation system sales climbed to 1,000 sets in Q1 2026 (from 300 sets in Q1 2025), expanding Q1 2026 consumer electronics revenue to $47.71 million (up from $22.72 million in Q1 2025).
The company's competitive positioning in China's $166.64 billion (CNY 1,197.7 billion) automated manufacturing equipment market is detailed below:
Table: Market Size, Competitive Positioning, and Market Share Benchmarking by Segment
| Segment | Total Addressable Market (TAM) | Top 5 Players' Market Share | Topstar Ranking and Market Share |
|---|---|---|---|
| Industrial Robot Solutions | $12.86 Billion | 23.6% ($3.03 Billion) | Ranked 10th globally / 4th among domestic players, with a 0.7% market share |
| Injection Molding Equipment | $5.54 Billion | 61.7% ($2.57 Billion) | Ranked 9th globally with a 1.3% market share; ranked No. 1 in auxiliary equipment |
| 5-Axis CNC Machine Tools | $1.71 Billion | 42.0% ($723.48 Million) | Ranked 9th globally / 7th among domestic players, with a 2.6% market share through Efome |
The competitive benchmark for industrial robot solutions in Mainland China consists of:
* Company H (Japan, Tokyo listed): 7.0% market share
* Company I (Germany, Frankfurt listed): 5.7% market share
* Company F (Switzerland, NYSE/London listed): 4.3% market share
* Company J (Japan, Tokyo/Osaka/Fukuoka listed): 3.8% market share
* Company K (Japan, Tokyo listed): 2.8% market share
* Company A (China, Shenzhen listed): 2.6% market share
* Company B (China, Shenzhen listed): 1.9% market share
* Company D (China, Shanghai listed): 1.0% market share
* Company L (Japan, Tokyo listed): 0.7% market share
HDIN Institutional Verdict
Guangdong Topstar Technology Co., Ltd. is executing a necessary transition toward standardized high-margin hardware, but the strategy is constrained by execution risks and structural supply chain bottlenecks. While the company has developed its own X5 control systems, it remains dependent on external suppliers for 95% of its industrial robot servo drives. For its premium 5-axis CNC machines, it relies entirely on third-party imported control and servo systems. In Q1 2026, purchases of CNC operating systems from Supplier C (a Beijing-based supplier with $27.9 million registered capital) reached $2.77 million, or 6.1% of total procurement. Operational disruptions from relocating the Efome CNC facility in March 2024 also reduced CNC production from 314 units in 2023 to 260 units in 2024, causing goodwill impairment losses for the Efome CGU of $2.05 million in 2024 and $2.99 million in 2025.
This transition is further complicated by severe customer concentration. The Top 5 clients generated 59.5% of revenue in Q1 2026. A single smart device enclosure manufacturer in the consumer electronics sector (Client C) accounted for 49.1% of total Q1 2026 revenue ($36.75 million), up from 7.6% ($48.42 million) in 2023. This high concentration limits the company's ability to pass through raw material cost increases. Hardware sales require 20% to 30% upfront deposits, with the remaining 70% to 80% balance collected 6 to 12 months post-acceptance, which continues to put pressure on working capital.
To lower working capital requirements, the company has structured the carve-out of its legacy Smart Energy segment to entities controlled by former Executive Director Mr. Huang Daibo (Suzhou Boyi and Dongguan Junye). Under the Green Energy Project Master Framework Agreement, Topstar acts as an agent, retaining a 3% fee while outsourcing execution to these entities. The 2026 transaction cap is set at $76.27 million ($75.13 million for execution procurement, $1.14 million for product supply/leasing). While this reduces balance sheet risk, it introduces significant related-party complexity.
Figure Guangdong Topstar Technology Co., Ltd. IPO Capital Deployment Roadmap
Capital raised from the proposed HKEX listing will fund this transition, focusing on the joint venture with Zhipu Huazhang (Guangdong Matrix Zhituo Technology Co., Ltd., where Topstar holds 51% and Zhipu holds 30%) to develop "embodied AI" applications.
However, corporate governance remains a key watchpoint. The CSRC flagged accounting inaccuracies in December 2025, which included premature revenue recognition of $1.11 million in 2023, delayed cost recognition of $0.56 million in 2024, and inadequate bad debt provisions of $0.16 million. Regulatory lapses also include a 2021 short-swing trading incident involving Chairman Wu Fengli and Director Zhang Peng, who returned $269,122 in profits, and a 2022 cash management issue involving $18.09 million in unauthorized structured deposits. Latent regulatory risks remain from five legacy Iran transactions ($173,792) settled in USD without an OFAC Voluntary Self-Disclosure, carrying a projected base penalty of $286,000, alongside secondary sanctions exposure from equipment exports to Russia and Belarus.
Presentation Download & Video Access:
- Presentation Download: Click the PDF download link under 'Related Topics' to access the full institutional presentation of this report.
- Video Link: Click this link to watch the HDIN analyst briefing on YouTube.
About HDIN Research:
HDIN Research is a premier global market intelligence and strategic advisory firm specializing in institutional-grade financial analysis, supply chain audits, and macroeconomic forecasting. Our dedicated sector analysts deliver actionable, data-driven insights tailored for private equity, hedge funds, and corporate strategy teams. Visit us at http://www.hdinresearch.com.
2026 AI Transparency Footer:
"This intelligence report was authored by HDIN Research analysts following a rigorous audit of official corporate filings. AI was utilized for massive-scale data synthesis and structural drafting, ensuring 100% inclusion of reported data points. All strategic insights, financial modeling, and final verdicts were verified by our editorial board to ensure professional accuracy and compliance with 2026 Google Search E-E-A-T standards."