FedEx Corporation: Absolute Surface Consolidation and Freight Spin-off Near Global Memphis Hub as 5.8% Operating Margin Signals Structural Re-segmentation
Date : 2026-07-23
Reading : 353
HDIN Market Intelligence Brief
1. FedEx Corporation [NYSE: FDX] completed the spin-off of FedEx Freight [NYSE: FDXF], retaining a 19.9% equity stake and using a $4.10 billion pre-separation dividend to help repurchase $4.90 billion in debt, maintaining a 1.8x leverage ratio.
2. Core Federal Express segment margins expanded 70 basis points to 7.2%, driven by "Network 2.0" automation and a 6% composite yield increase to $16.80.
3. Actuarial mark-to-market pension gains of $497 million net of tax provided a non-cash $2.08 EPS benefit, masking underlying structural labor inflation.
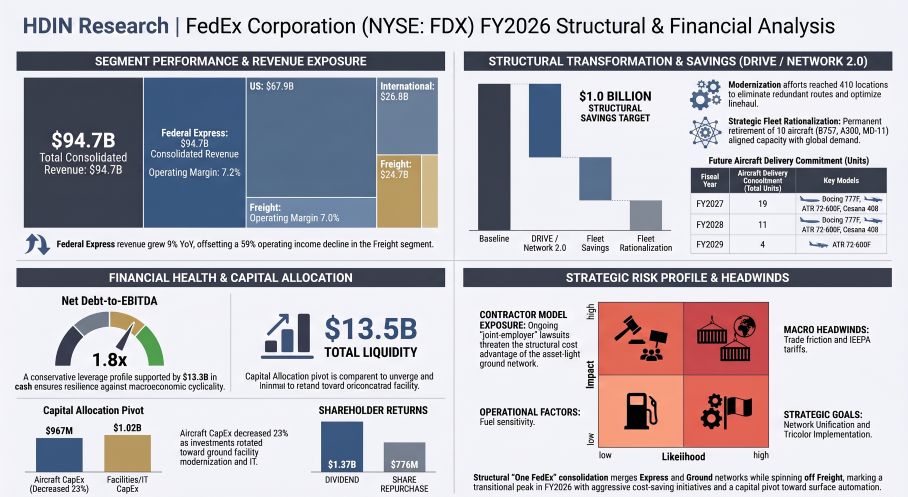
Figure FedEx Corporation FY2026 Structural & Financial Analysis
 Segmental Realities, Cost Reductions, and Margin Compression
FedEx Corporation’s FY2026 consolidated revenue reached $94.72 billion, representing an 8% year-over-year expansion. Consolidated operating income grew 5% to $5.46 billion, although the consolidated operating margin contracted by 10 basis points to 5.8%. This margin contraction was primarily driven by $771 million in separation and other costs related to the FedEx Freight spin-off, which masked underlying operational efficiencies in the core parcel network.
On June 1, 2024, FedEx Ground and FedEx Corporate Services merged into Federal Express Corporation. The company subsequently completed the tax-free spin-off of 80.1% of FedEx Freight on June 1, 2026, retaining a 19.9% equity stake to be monetized within 24 months. Following this transaction, FedEx has abandoned its historical segment reporting, re-segmenting into Express U.S. Domestic and Express International (which now includes FedEx Logistics).
Table: Segment Revenue, Profitability, and Operational Performance Analysis (FY2026)
The geographic revenue distribution highlights a strong dependence on the domestic market:
* United States: $67.94 billion (+8.0% YoY, up from $62.92 billion).
* International: $26.78 billion (+7.1% YoY, up from $25.01 billion), consisting of $25.48 billion from Federal Express, $243 million from FedEx Freight, and $1.05 billion from other operations.
Foreign exchange fluctuations provided a favorable top-line revenue tailwind but inflated international operating expenses (salaries, employee benefits, and purchased transportation). A uniform 10% strengthening of the USD relative to other currencies would decrease operating income by approximately $541 million.
The Federal Express segment maintained robust pricing power to defend unit economics despite volume shifts:
* Average Daily Volume (ADV): 17.56 million packages (+3% YoY)
* U.S. Domestic: 14.58 million (+5% YoY)
* U.S. Priority: 1.68 million (+4% YoY)
* International Export: 1.14 million (+1% YoY)
* International Priority: 0.57 million (-2% YoY)
* International Domestic: 1.83 million (-4% YoY)
* Composite Revenue per Package (Yield): $16.80 (+6% YoY)
* U.S. Domestic Composite: $14.75 (+6% YoY)
* U.S. Priority: $27.22 (+6% YoY)
* International Export Composite: $53.54 (+6% YoY)
* International Priority: $66.34 (+13% YoY)
* Freight Volume (Average Daily Pounds): 19.12 million (Flat YoY)
* International Priority Freight: +7% YoY
* International Economy Freight: +6% YoY
* U.S. Freight Pounds: -32% YoY (reflecting the termination of the U.S. Postal Service contract)
The company’s revenue mix shifted toward ground and deferred delivery modalities. Total U.S. domestic package revenue grew 11% to $54.64 billion, outperforming international export package revenue growth of 7% ($15.56 billion). Within the U.S., Deferred revenue grew 14% to $5.70 billion and Ground revenue grew 10% to $37.33 billion, driven by residential business-to-consumer e-commerce. Conversely, U.S. Priority revenue grew 10% to $11.60 billion.
On the expense side, salaries and benefits rose 9% due to wage inflation and variable incentive compensation. Purchased transportation rose 9% due to higher volumes and increased contracted service provider rates.
Infrastructure Layout, Fleet Allocations, and Off-Balance Sheet Structures
FedEx Corporation is executing a structural transition from asset-heavy capacity expansion to asset-light efficiency maximization. Capital expenditures in FY2026 contracted 6% year-over-year to $3.81 billion, allocated as follows:
* Facilities and Other: $1.02 billion (+9% YoY), representing the largest absolute CapEx category, dedicated to U.S. domestic and international facility modernization.
* Package Handling and Ground Support Equipment: $1.01 billion (+9% YoY), focusing on hub automation and sortation systems to merge the legacy Express and Ground networks under Network 2.0.
* Aircraft and Related Equipment: $967 million (-23% YoY), reflecting a shift toward fleet rationalization.
* Information Technology: $463 million (-8% YoY), standardizing the digital backbone and AI orchestration.
* Vehicles and Trailers: $347 million (-20% YoY), reflecting route optimization and adjusted electric vehicle deployment pacing.
As of May 31, 2026, the company operated a physical layout of over 4,000 facilities globally. This footprint includes 1,085 owned or leased U.S. facilities, 96 Canadian sorting and distribution centers, and over 1,000 international city stations. Major global sorting hubs are located in Memphis, Tennessee; Indianapolis, Indiana; Miami, Florida; Paris, France; Cologne, Germany; Guangzhou, China; Osaka, Japan; and Liege, Belgium, alongside substantial airport presence in Hong Kong, Taiwan, and Dubai.
The aircraft fleet is structured on an ownership model, whereas facilities are heavily leased:
* Air Fleet: 700 aircraft, with 697 owned and only 3 (<1%) under operating leases. FedEx permanently retired 10 legacy aircraft in FY2026 (four Boeing 757-200s, one Airbus A300-600, and five Boeing MD-11s), resulting in a $23 million non-cash impairment charge.
* Vehicle Fleet: FedEx directly operates 82,000 motorized vehicles, supplemented by 5,300 contracted independent small businesses running approximately 100,000 vehicles for ground logistics.
* Lease Exposure: Operating lease right-of-use (ROU) assets stood at $16.82 billion against $17.23 billion in operating lease liabilities. The weighted-average remaining lease term is 9.2 years, with a weighted-average discount rate of 4.22%. The undiscounted operating lease payout schedule totals $21.03 billion:
* Year 1 (FY2027): $3.26 billion
* Year 2 (FY2028): $3.00 billion
* Year 3 (FY2029): $2.58 billion
* Year 4 (FY2030): $2.21 billion
* Year 5 (FY2031): $1.84 billion
* Thereafter (FY2032+): $8.14 billion
* *Note*: FedEx is committed to an additional $1.40 billion in undiscounted future payments for build-to-suit facilities and equipment leases not yet commenced.
* Unconditionally Binding Capital Commitments: Contractual aircraft and aircraft-related purchase commitments total $4.75 billion, supported by $727 million in deposits and progress payments. Other purchase commitments, primarily IT and advertising contracts, total $5.97 billion. The 5-year pipeline is committed to purchasing 36 aircraft (no Airbus models):
* FY2027: 19 aircraft (5 Boeing 777F, 5 ATR 72-600F, 9 Cessna SkyCourier 408)
* FY2028: 11 aircraft (5 Boeing 777F, 4 ATR 72-600F, 2 Cessna SkyCourier 408)
* FY2029: 4 aircraft (4 ATR 72-600F)
* FY2030: 2 aircraft (2 ATR 72-600F)
* FY2031 & Thereafter: 0 aircraft scheduled
Off-balance sheet exposures are minimized through unconsolidated special-purpose trust aircraft Variable Interest Entities (VIEs) structured without residual value guarantees or fixed-price purchase options. Pass-through certificates used under leveraged operating leases are not direct obligations of, nor guaranteed by, FedEx (excluding the $685 million Pass-Through Certificates Series 2020-1AA, which are strictly on-balance sheet debt). Under its voluntary supply chain finance program, FedEx has guaranteed $109 million in outstanding payment obligations, which are recorded on-balance sheet within accounts payable.
HDIN Institutional Verdict
FedEx's balance sheet architecture remains liquid, fortified by $13.31 billion in cash and cash equivalents, $236 million in available-for-sale debt securities (totaling $13.55 billion on-hand liquidity), and $2.80 billion in untapped revolving credit. Gross debt of $25.71 billion (comprising $23.29 billion long-term, $1.68 billion current portion of long-term, and $745 million commercial paper) net of cash yields a net debt of $12.40 billion. Leverage settled at 1.8x Debt-to-Adjusted EBITDA (well below the 3.5x covenant threshold), and interest coverage stands at 5.6x on interest expenses of $970 million.
The $8.66 billion 1-5 year maturity wall is well-laddered: $1.51 billion in FY2027, $552 million in FY2028, $2.75 billion in FY2029, $1.80 billion in FY2030, and $2.05 billion in FY2031. Euro-denominated senior unsecured notes (coupons of 0.45% to 1.625%) and USD-denominated notes (coupons of 2.40% to 4.90%) maintain a highly favorable weighted-average interest rate of 3.8%.
However, institutional investors must analyze the quality of GAAP earnings. Outperforming actual U.S. pension asset returns of 12.40% versus the 7.00% expected long-term rate of return triggered a pre-tax, non-cash actuarial Mark-to-Market (MTM) gain of $647 million. Net of tax, this $497 million gain added $2.08 to diluted EPS, masking underlying operational headwinds.
Actuarial discount assumptions are highly sensitive, using rates of 5.76% for U.S. Pension Plans, 4.88% for International Pension Plans, and 5.47% for Postretirement Healthcare Plans. While U.S. plans generated net periodic benefit income of $(458) million, International and Healthcare plans recognized costs of $20 million and $66 million, respectively.
Furthermore, total self-insurance accruals stood at a massive $6.38 billion ($1.97 billion short-term and $4.41 billion long-term). A mere 5% shift in assumed claim severity would swing reserves and expenses by $320 million, which, alongside the $27.1 billion pension valuation, prompted critical audit matter (CAM) designations from auditor Ernst & Young LLP.
On legal and regulatory fronts, FedEx faces significant contingencies:
* IEEPA Tariffs: Seeking $3.30 billion in claims from U.S. Customs and Border Protection. Following the receipt of $800 million in cash refunds, FedEx recorded a highly specific accrued loss contingency of $749 million within current liabilities to cover estimated customer refund obligations. It faces 14 consolidated class actions seeking further refunds, the exposure of which remains unquantified but is reasonably possible to be material.
* TCJA Transition Tax: Following favorable district rulings, FedEx has recorded a cumulative tax benefit of $249 million, which is under appeal by the U.S. government with oral arguments scheduled for July 30, 2026. A loss on appeal will force a direct reversal.
* Tax Loss Carryforwards: Total $3.0 billion foreign net operating losses, $1.1 billion state, and $130 million federal, offset by a $438 million valuation allowance. A $100 million tax benefit was recognized from the reduction of a Brazil valuation allowance in FY2026.
* Unrecognized Tax Benefits (UTBs): Stood at $174 million, with $161 million presenting potential direct tax rate benefits, plus $48 million in accrued interest/penalties under active IRS audits (tax years 2016-2021).
* Labor Risks: The newly ratified ALPA pilot contract secures operations through December 2030 but embeds a steep 40% initial wage hike and a $625 million one-time ratification payment. On the ground, joint-employer lawsuits continue to threaten the structural cost advantages of the 5,300 independent service provider network.
While management's "One FedEx" and "Network 2.0" initiatives target $1.0 billion in structural cost reductions by late calendar year 2026 (expending $366 million in optimization and realignment costs in FY2026), and a completed Europe workforce reduction of 1,400 positions targets $150 million in annualized savings, these savings are currently offset by systemic labor rate inflation and rising contractor fees. The standalone spin-off of FedEx Freight shields the parent from LTL capacity surfeits (-1% revenue decline and 970 bps margin contraction in FY2026), but the subsequent $4.90 billion debt repurchase was largely funded via the $4.10 billion pre-spin-off dividend, exhausting immediate liquidity injections.
Presentation Download & Video Access
Presentation Download: Click the PDF download link under 'Related Topics' to access the full institutional presentation of this report.
Video Link: Click this link to watch the HDIN analyst briefing on YouTube.
About HDIN Research
HDIN Research is a premier global market intelligence and strategic advisory firm specializing in institutional-grade financial analysis, supply chain audits, and macroeconomic forecasting. Our dedicated sector analysts deliver actionable, data-driven insights tailored for private equity, hedge funds, and corporate strategy teams. Visit us at http://www.hdinresearch.com.
2026 AI Transparency Footer
"This intelligence report was authored by HDIN Research analysts following a rigorous audit of official corporate filings. AI was utilized for massive-scale data synthesis and structural drafting, ensuring 100% inclusion of reported data points. All strategic insights, financial modeling, and final verdicts were verified by our editorial board to ensure professional accuracy and compliance with 2026 Google Search E-E-A-T standards."
1. FedEx Corporation [NYSE: FDX] completed the spin-off of FedEx Freight [NYSE: FDXF], retaining a 19.9% equity stake and using a $4.10 billion pre-separation dividend to help repurchase $4.90 billion in debt, maintaining a 1.8x leverage ratio.
2. Core Federal Express segment margins expanded 70 basis points to 7.2%, driven by "Network 2.0" automation and a 6% composite yield increase to $16.80.
3. Actuarial mark-to-market pension gains of $497 million net of tax provided a non-cash $2.08 EPS benefit, masking underlying structural labor inflation.
Figure FedEx Corporation FY2026 Structural & Financial Analysis
Segmental Realities, Cost Reductions, and Margin CompressionFedEx Corporation’s FY2026 consolidated revenue reached $94.72 billion, representing an 8% year-over-year expansion. Consolidated operating income grew 5% to $5.46 billion, although the consolidated operating margin contracted by 10 basis points to 5.8%. This margin contraction was primarily driven by $771 million in separation and other costs related to the FedEx Freight spin-off, which masked underlying operational efficiencies in the core parcel network.
On June 1, 2024, FedEx Ground and FedEx Corporate Services merged into Federal Express Corporation. The company subsequently completed the tax-free spin-off of 80.1% of FedEx Freight on June 1, 2026, retaining a 19.9% equity stake to be monetized within 24 months. Following this transaction, FedEx has abandoned its historical segment reporting, re-segmenting into Express U.S. Domestic and Express International (which now includes FedEx Logistics).
Table: Segment Revenue, Profitability, and Operational Performance Analysis (FY2026)
| Segment / Division | FY2026 Revenue ($B) | Revenue Growth (YoY) | FY2026 Operating Income ($B) | Operating Margin | Margin Shift (bps) | Primary Operational Drivers |
|---|---|---|---|---|---|---|
| Federal Express | $82.27 | +9% | $5.91 | 7.2% | +70 bps | Yield growth; domestic volume pressure offset; USPS contract expiration; DRIVE and Network 2.0 cost-reduction initiatives |
| FedEx Freight (LTL) | $8.80 | -1% | $0.616 | 7.0% | -970 bps | Weak macroeconomic demand; industry overcapacity; $492 million in direct spin-off transaction costs |
| Corporate & Eliminations | $3.65 | -2% | $(1.06) | N/A | +8% (loss reduction) | Lower Dataworks optimization costs, partially offset by higher salaries and weaker demand at FedEx Logistics |
The geographic revenue distribution highlights a strong dependence on the domestic market:
* United States: $67.94 billion (+8.0% YoY, up from $62.92 billion).
* International: $26.78 billion (+7.1% YoY, up from $25.01 billion), consisting of $25.48 billion from Federal Express, $243 million from FedEx Freight, and $1.05 billion from other operations.
Foreign exchange fluctuations provided a favorable top-line revenue tailwind but inflated international operating expenses (salaries, employee benefits, and purchased transportation). A uniform 10% strengthening of the USD relative to other currencies would decrease operating income by approximately $541 million.
The Federal Express segment maintained robust pricing power to defend unit economics despite volume shifts:
* Average Daily Volume (ADV): 17.56 million packages (+3% YoY)
* U.S. Domestic: 14.58 million (+5% YoY)
* U.S. Priority: 1.68 million (+4% YoY)
* International Export: 1.14 million (+1% YoY)
* International Priority: 0.57 million (-2% YoY)
* International Domestic: 1.83 million (-4% YoY)
* Composite Revenue per Package (Yield): $16.80 (+6% YoY)
* U.S. Domestic Composite: $14.75 (+6% YoY)
* U.S. Priority: $27.22 (+6% YoY)
* International Export Composite: $53.54 (+6% YoY)
* International Priority: $66.34 (+13% YoY)
* Freight Volume (Average Daily Pounds): 19.12 million (Flat YoY)
* International Priority Freight: +7% YoY
* International Economy Freight: +6% YoY
* U.S. Freight Pounds: -32% YoY (reflecting the termination of the U.S. Postal Service contract)
The company’s revenue mix shifted toward ground and deferred delivery modalities. Total U.S. domestic package revenue grew 11% to $54.64 billion, outperforming international export package revenue growth of 7% ($15.56 billion). Within the U.S., Deferred revenue grew 14% to $5.70 billion and Ground revenue grew 10% to $37.33 billion, driven by residential business-to-consumer e-commerce. Conversely, U.S. Priority revenue grew 10% to $11.60 billion.
On the expense side, salaries and benefits rose 9% due to wage inflation and variable incentive compensation. Purchased transportation rose 9% due to higher volumes and increased contracted service provider rates.
Infrastructure Layout, Fleet Allocations, and Off-Balance Sheet Structures
FedEx Corporation is executing a structural transition from asset-heavy capacity expansion to asset-light efficiency maximization. Capital expenditures in FY2026 contracted 6% year-over-year to $3.81 billion, allocated as follows:
* Facilities and Other: $1.02 billion (+9% YoY), representing the largest absolute CapEx category, dedicated to U.S. domestic and international facility modernization.
* Package Handling and Ground Support Equipment: $1.01 billion (+9% YoY), focusing on hub automation and sortation systems to merge the legacy Express and Ground networks under Network 2.0.
* Aircraft and Related Equipment: $967 million (-23% YoY), reflecting a shift toward fleet rationalization.
* Information Technology: $463 million (-8% YoY), standardizing the digital backbone and AI orchestration.
* Vehicles and Trailers: $347 million (-20% YoY), reflecting route optimization and adjusted electric vehicle deployment pacing.
As of May 31, 2026, the company operated a physical layout of over 4,000 facilities globally. This footprint includes 1,085 owned or leased U.S. facilities, 96 Canadian sorting and distribution centers, and over 1,000 international city stations. Major global sorting hubs are located in Memphis, Tennessee; Indianapolis, Indiana; Miami, Florida; Paris, France; Cologne, Germany; Guangzhou, China; Osaka, Japan; and Liege, Belgium, alongside substantial airport presence in Hong Kong, Taiwan, and Dubai.
The aircraft fleet is structured on an ownership model, whereas facilities are heavily leased:
* Air Fleet: 700 aircraft, with 697 owned and only 3 (<1%) under operating leases. FedEx permanently retired 10 legacy aircraft in FY2026 (four Boeing 757-200s, one Airbus A300-600, and five Boeing MD-11s), resulting in a $23 million non-cash impairment charge.
* Vehicle Fleet: FedEx directly operates 82,000 motorized vehicles, supplemented by 5,300 contracted independent small businesses running approximately 100,000 vehicles for ground logistics.
* Lease Exposure: Operating lease right-of-use (ROU) assets stood at $16.82 billion against $17.23 billion in operating lease liabilities. The weighted-average remaining lease term is 9.2 years, with a weighted-average discount rate of 4.22%. The undiscounted operating lease payout schedule totals $21.03 billion:
* Year 1 (FY2027): $3.26 billion
* Year 2 (FY2028): $3.00 billion
* Year 3 (FY2029): $2.58 billion
* Year 4 (FY2030): $2.21 billion
* Year 5 (FY2031): $1.84 billion
* Thereafter (FY2032+): $8.14 billion
* *Note*: FedEx is committed to an additional $1.40 billion in undiscounted future payments for build-to-suit facilities and equipment leases not yet commenced.
* Unconditionally Binding Capital Commitments: Contractual aircraft and aircraft-related purchase commitments total $4.75 billion, supported by $727 million in deposits and progress payments. Other purchase commitments, primarily IT and advertising contracts, total $5.97 billion. The 5-year pipeline is committed to purchasing 36 aircraft (no Airbus models):
* FY2027: 19 aircraft (5 Boeing 777F, 5 ATR 72-600F, 9 Cessna SkyCourier 408)
* FY2028: 11 aircraft (5 Boeing 777F, 4 ATR 72-600F, 2 Cessna SkyCourier 408)
* FY2029: 4 aircraft (4 ATR 72-600F)
* FY2030: 2 aircraft (2 ATR 72-600F)
* FY2031 & Thereafter: 0 aircraft scheduled
Off-balance sheet exposures are minimized through unconsolidated special-purpose trust aircraft Variable Interest Entities (VIEs) structured without residual value guarantees or fixed-price purchase options. Pass-through certificates used under leveraged operating leases are not direct obligations of, nor guaranteed by, FedEx (excluding the $685 million Pass-Through Certificates Series 2020-1AA, which are strictly on-balance sheet debt). Under its voluntary supply chain finance program, FedEx has guaranteed $109 million in outstanding payment obligations, which are recorded on-balance sheet within accounts payable.
HDIN Institutional Verdict
FedEx's balance sheet architecture remains liquid, fortified by $13.31 billion in cash and cash equivalents, $236 million in available-for-sale debt securities (totaling $13.55 billion on-hand liquidity), and $2.80 billion in untapped revolving credit. Gross debt of $25.71 billion (comprising $23.29 billion long-term, $1.68 billion current portion of long-term, and $745 million commercial paper) net of cash yields a net debt of $12.40 billion. Leverage settled at 1.8x Debt-to-Adjusted EBITDA (well below the 3.5x covenant threshold), and interest coverage stands at 5.6x on interest expenses of $970 million.
The $8.66 billion 1-5 year maturity wall is well-laddered: $1.51 billion in FY2027, $552 million in FY2028, $2.75 billion in FY2029, $1.80 billion in FY2030, and $2.05 billion in FY2031. Euro-denominated senior unsecured notes (coupons of 0.45% to 1.625%) and USD-denominated notes (coupons of 2.40% to 4.90%) maintain a highly favorable weighted-average interest rate of 3.8%.
However, institutional investors must analyze the quality of GAAP earnings. Outperforming actual U.S. pension asset returns of 12.40% versus the 7.00% expected long-term rate of return triggered a pre-tax, non-cash actuarial Mark-to-Market (MTM) gain of $647 million. Net of tax, this $497 million gain added $2.08 to diluted EPS, masking underlying operational headwinds.
Actuarial discount assumptions are highly sensitive, using rates of 5.76% for U.S. Pension Plans, 4.88% for International Pension Plans, and 5.47% for Postretirement Healthcare Plans. While U.S. plans generated net periodic benefit income of $(458) million, International and Healthcare plans recognized costs of $20 million and $66 million, respectively.
Furthermore, total self-insurance accruals stood at a massive $6.38 billion ($1.97 billion short-term and $4.41 billion long-term). A mere 5% shift in assumed claim severity would swing reserves and expenses by $320 million, which, alongside the $27.1 billion pension valuation, prompted critical audit matter (CAM) designations from auditor Ernst & Young LLP.
On legal and regulatory fronts, FedEx faces significant contingencies:
* IEEPA Tariffs: Seeking $3.30 billion in claims from U.S. Customs and Border Protection. Following the receipt of $800 million in cash refunds, FedEx recorded a highly specific accrued loss contingency of $749 million within current liabilities to cover estimated customer refund obligations. It faces 14 consolidated class actions seeking further refunds, the exposure of which remains unquantified but is reasonably possible to be material.
* TCJA Transition Tax: Following favorable district rulings, FedEx has recorded a cumulative tax benefit of $249 million, which is under appeal by the U.S. government with oral arguments scheduled for July 30, 2026. A loss on appeal will force a direct reversal.
* Tax Loss Carryforwards: Total $3.0 billion foreign net operating losses, $1.1 billion state, and $130 million federal, offset by a $438 million valuation allowance. A $100 million tax benefit was recognized from the reduction of a Brazil valuation allowance in FY2026.
* Unrecognized Tax Benefits (UTBs): Stood at $174 million, with $161 million presenting potential direct tax rate benefits, plus $48 million in accrued interest/penalties under active IRS audits (tax years 2016-2021).
* Labor Risks: The newly ratified ALPA pilot contract secures operations through December 2030 but embeds a steep 40% initial wage hike and a $625 million one-time ratification payment. On the ground, joint-employer lawsuits continue to threaten the structural cost advantages of the 5,300 independent service provider network.
While management's "One FedEx" and "Network 2.0" initiatives target $1.0 billion in structural cost reductions by late calendar year 2026 (expending $366 million in optimization and realignment costs in FY2026), and a completed Europe workforce reduction of 1,400 positions targets $150 million in annualized savings, these savings are currently offset by systemic labor rate inflation and rising contractor fees. The standalone spin-off of FedEx Freight shields the parent from LTL capacity surfeits (-1% revenue decline and 970 bps margin contraction in FY2026), but the subsequent $4.90 billion debt repurchase was largely funded via the $4.10 billion pre-spin-off dividend, exhausting immediate liquidity injections.
Presentation Download & Video Access
Presentation Download: Click the PDF download link under 'Related Topics' to access the full institutional presentation of this report.
Video Link: Click this link to watch the HDIN analyst briefing on YouTube.
About HDIN Research
HDIN Research is a premier global market intelligence and strategic advisory firm specializing in institutional-grade financial analysis, supply chain audits, and macroeconomic forecasting. Our dedicated sector analysts deliver actionable, data-driven insights tailored for private equity, hedge funds, and corporate strategy teams. Visit us at http://www.hdinresearch.com.
2026 AI Transparency Footer
"This intelligence report was authored by HDIN Research analysts following a rigorous audit of official corporate filings. AI was utilized for massive-scale data synthesis and structural drafting, ensuring 100% inclusion of reported data points. All strategic insights, financial modeling, and final verdicts were verified by our editorial board to ensure professional accuracy and compliance with 2026 Google Search E-E-A-T standards."