3-D Matrix, Ltd.: US Commercial Scaling Drives Gross Margin Expansion to 78.7% Amid Single-Source Supply Bottlenecks and 132% Capital Dilution
Date : 2026-07-24
Reading : 165
HDIN Executive Takeaways
1. 3-D Matrix, Ltd. [TOKYO: 7777] expanded FY2026 gross margins by 1,500 bps to 78.7%, driven by 98.2% YoY growth in US PuraStat sales to $41.78M.
2. A 100% outsourced manufacturing model via Germany-based Pharmpur GmbH exposes $72.78M in global revenues to single-point-of-failure risk.
3. Historic cash burn necessitated a ~132% share dilution from FY2022 to FY2026, creating an ongoing equity overhang from active warrant series.
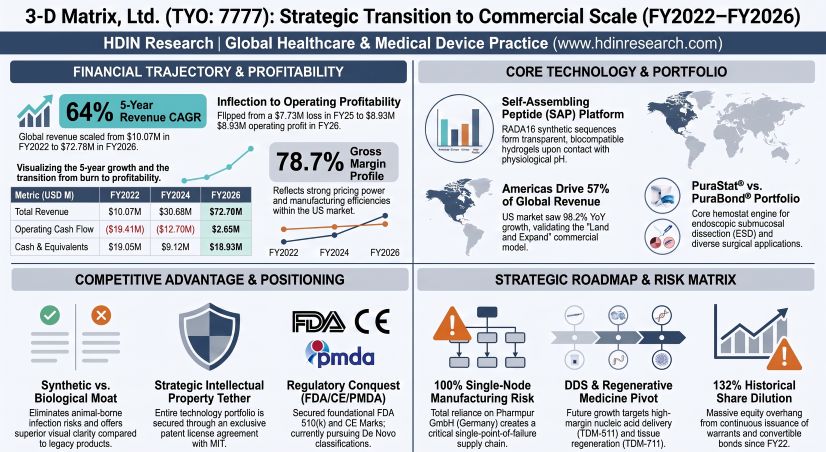
Figure 3-D Matrix: Strategic Transition to Commercial Scale (FY2022-FY2026)
Financial Disaggregation, Operating Leverage, and Legacy Capital Overhang
3-D Matrix, Ltd. has completed an operational turnaround in FY2026, reversing consecutive years of severe cash outflows through focused commercial execution in the Americas. While the company reports under a single accounting segment ("Medical Products Business"), disaggregated disclosure reveals that its surgical hemostat portfolio (TDM-621 / PuraStat) is the primary engine of top-line performance, accounting for the absolute majority of global revenues.
In FY2026, global revenue scaled 57.0% YoY to $72.78 million (10.88 billion JPY), driven by aggressive clinical adoption in high-margin surgical corridors. Gross profit margins reached 78.7%, representing a ~1,500 basis point expansion from the 63.8% recorded in FY2025. This structural margin improvement occurred as Cost of Goods Sold (COGS) contracted from $16.78 million (2.51 billion JPY) in FY2025 to $15.47 million (2.31 billion JPY) in FY2026, validating the company's operating leverage as unit production normalized.
The table below disaggregates the five-year financial progression of 3-D Matrix, Ltd. from FY2022 to FY2026 (converted at the baseline exchange rate of 1 USD = 149.5686 JPY):
*Note: Detailed P&L line items for Gross Profit, Operating Income, and R&D for FY2022–FY2024 are not explicitly broken out in the consolidated historical summary.
Core operations achieved a milestone in FY2026, turning Operating Cash Flow positive at $2.65 million, recovering from a cumulative cash burn exceeding $74 million between FY2022 and FY2025. This transition to positive cash flow stabilized cash reserves at $18.93 million.
However, net profitability contains structural distortions. The reported FY2026 Net Income of $27.79 million was heavily supported by a non-operating Foreign Exchange Gain (為替差益) of $17.79 million (2.66 billion JPY) stemming from the depreciation of the Japanese Yen against USD and EUR transaction balances. Adjusted for this FX tailwind, core operational earnings are represented by the Operating Income of $8.93 million (although management's alternative internal metrics cite a structural operating profit of $26.55 million / 3.97 billion JPY based on non-GAAP cost allocations).
Operating expenses highlight a disciplined cost containment strategy. Research and development spending was tightly managed at $4.28 million (640.21 million JPY), representing 5.9% of FY2026 revenue. This suggests that the primary clinical pipeline has transitioned past capital-intensive clinical trials into commercial harvesting. Conversely, non-R&D Selling, General, and Administrative (SG&A) expenses stood at $44.10 million (6.59 billion JPY) to support direct sales efforts in Western markets.
To bridge its historical cash-burn phase, 3-D Matrix, Ltd. relied heavily on highly dilutive capital raises. Outstanding common shares expanded from 55.13 million in FY2022 to 127.97 million in FY2026—a 132% equity base expansion. Key dilution mechanisms include:
* The 9th Series Unsecured Convertible Bonds: This roughly $25 million issuance resulted in the exercise and conversion of 9,919,351 new shares.
* Active Stock Acquisition Rights (Warrants): The company currently carries an active pipeline of warrants spanning the 38th, 40th, 41st, 42nd, 43rd, 44th, and 45th series. The 45th series alone originally issued 259,000 rights (with 249,400 rights remaining active), converting at a ratio of 1:100 to represent a potential overhang of 24.94 million shares.
Geographic Revenue Dispersion, Clinical Moats, and Supply Chain Architecture
3-D Matrix, Ltd. has prioritized regional commercialization, with the Americas becoming the dominant market, offsetting stagnation in domestic Japanese operations. The table below outlines the geographic revenue contribution for the FY2025 and FY2026 periods:
Table Geographic Revenue Performance (FY2025–FY2026)
The company's technology platform is built on synthetic Self-Assembling Peptides (SAPs), specifically the RADA16 (Arginine-Alanine-Aspartic Acid) 16-amino acid sequence. Upon exposure to physiological pH or salts, the liquid monomer instantly self-assembles into a nanofiber hydrogel. This synthetic profile avoids the infection risks associated with traditional animal-derived collagen or gelatin matrices (e.g., bovine or porcine pathogens) and maintains complete tissue biocompatibility (degrading into natural amino acids). Furthermore, the hydrogel is transparent, allowing surgeons to preserve clear visibility during complex endoscopic and surgical procedures.
The regulatory roadmap has progressed through key milestones:
* Europe: CE Mark achieved in 2014, currently supported by Post-Market Clinical Follow-up (PMCF) studies for expanded surgical use cases.
* United States: FDA 510(k) clearances secured in 2015, 2021, and 2022, catalyzing the current growth in the Americas. Management is pursuing De Novo pathways for novel, non-equivalent surgical classifications in late 2025 and 2026.
* Pipeline Assets: TDM-621 (PuraStat) is currently undergoing a Randomized Controlled Trial (RCT) for Hereditary Hemorrhagic Telangiectasia (HHT). TDM-644 operates commercially as a mucosal lifting agent for Endoscopic Submucosal Dissection (ESD). TDM-511 utilizes an A6K (AAAAAAK) peptide sequence as a Drug Delivery System (DDS) for targeted siRNA delivery in refractory breast cancer (RPN2 gene), currently in Phase I trials through partner PURMX.
The physical footprint of 3-D Matrix, Ltd. is 100% fabless, maximizing operating leverage but concentrating risk:
* Contract Manufacturing (CMO): The entire supply chain relies on a single contract manufacturer, Pharmpur GmbH in Germany, for both raw peptide synthesis and finished product assembly (such as prefilled syringes).
* European Distribution: FUJIFILM Europe B.V. serves as the primary distributor in the EMEA region, accounting for $9.73 million (1.45 billion JPY) or 13.4% of total global sales in FY2026, down from 18.3% in FY2025 as direct sales channels expanded.
* Quality Frameworks: Quality operations are validated through the ISO 13485 certification achieved by European subsidiary 3-D Matrix Europe SAS in 2012.
Forensic working capital metrics extracted from the balance sheets reveal high operational efficiency:
Table Inventory Composition Analysis (FY2025–FY2026)
Based on a FY2026 COGS of $15.47 million and an average inventory of $3.45 million, the company operates at an Inventory Turnover Ratio of ~4.48x, which translates into 81.4 Days Sales of Inventory (DSI). This represents approximately 2.5 months of buffer stock, mitigating trans-Atlantic logistics bottlenecks between the German CMO and Western end-markets.
HDIN Institutional Verdict
While management's execution in scaling US revenues by 98.2% has successfully driven operating cash flows into positive territory, institutional investors must monitor two structural risks that could affect long-term valuation:
First, 3-D Matrix, Ltd. does not own its foundational technology. Its entire commercial pipeline is governed by an Exclusive Patent License Agreement with the Massachusetts Institute of Technology (MIT), originally signed in 2003 (with amendments in 2004 and 2007). Standard utility patent lifespans of 20 years suggest that the core patents protecting the RADA16 platform are entering a standard patent cliff window. As these expire, the technological barrier will shift from absolute patent protection to regulatory and manufacturing complexity. Additionally, Arch Therapeutics, Inc. continues to represent a potential litigation threat, with the risk of patent validity challenges that could compromise the company's exclusive commercial rights.
Second, despite achieving operational profitability in FY2026, the company’s statutory filings continue to carry an explicit warning regarding "Material Uncertainty Regarding Going Concern" due to historical cumulative losses.
Furthermore, the shareholder base is highly fragmented. The top two stakeholders—a JP Morgan client account holding 2.02% and BNY GCM holding 1.76%—suggest a lack of a stabilizing anchor investor. This extreme dispersion, paired with the active overhang of convertible debt and successive warrant series (up to the 45th series), means that any upward stock performance is likely to trigger institutional conversions, diluting EPS and limiting near-term per-share value appreciation.
Presentation Download & Video Access:
Presentation Download: Click the PDF download link under 'Related Topics' to access the full institutional presentation of this report.
Video Link: Click this link to watch the HDIN analyst briefing on YouTube.
About HDIN Research:
HDIN Research is a premier global market intelligence and strategic advisory firm specializing in institutional-grade financial analysis, supply chain audits, and macroeconomic forecasting. Our dedicated sector analysts deliver actionable, data-driven insights tailored for private equity, hedge funds, and corporate strategy teams. Visit us at http://www.hdinresearch.com.
2026 AI Transparency Footer:
"This intelligence report was authored by HDIN Research analysts following a rigorous audit of official corporate filings. AI was utilized for massive-scale data synthesis and structural drafting, ensuring 100% inclusion of reported data points. All strategic insights, financial modeling, and final verdicts were verified by our editorial board to ensure professional accuracy and compliance with 2026 Google Search E-E-A-T standards."
1. 3-D Matrix, Ltd. [TOKYO: 7777] expanded FY2026 gross margins by 1,500 bps to 78.7%, driven by 98.2% YoY growth in US PuraStat sales to $41.78M.
2. A 100% outsourced manufacturing model via Germany-based Pharmpur GmbH exposes $72.78M in global revenues to single-point-of-failure risk.
3. Historic cash burn necessitated a ~132% share dilution from FY2022 to FY2026, creating an ongoing equity overhang from active warrant series.
Figure 3-D Matrix: Strategic Transition to Commercial Scale (FY2022-FY2026)
Financial Disaggregation, Operating Leverage, and Legacy Capital Overhang
3-D Matrix, Ltd. has completed an operational turnaround in FY2026, reversing consecutive years of severe cash outflows through focused commercial execution in the Americas. While the company reports under a single accounting segment ("Medical Products Business"), disaggregated disclosure reveals that its surgical hemostat portfolio (TDM-621 / PuraStat) is the primary engine of top-line performance, accounting for the absolute majority of global revenues.
In FY2026, global revenue scaled 57.0% YoY to $72.78 million (10.88 billion JPY), driven by aggressive clinical adoption in high-margin surgical corridors. Gross profit margins reached 78.7%, representing a ~1,500 basis point expansion from the 63.8% recorded in FY2025. This structural margin improvement occurred as Cost of Goods Sold (COGS) contracted from $16.78 million (2.51 billion JPY) in FY2025 to $15.47 million (2.31 billion JPY) in FY2026, validating the company's operating leverage as unit production normalized.
The table below disaggregates the five-year financial progression of 3-D Matrix, Ltd. from FY2022 to FY2026 (converted at the baseline exchange rate of 1 USD = 149.5686 JPY):
| Metric (USD Millions) | FY2022 | FY2023 | FY2024 | FY2025 | FY2026 |
|---|---|---|---|---|---|
| Revenue | $10.07M | $15.47M | $30.68M | $46.36M | $72.78M |
| Gross Profit | N/A* | N/A* | N/A* | $29.58M | $57.31M |
| Operating Income / (Loss) | N/A* | N/A* | N/A* | ($7.73M) | $8.93M |
| Net Income / (Loss) | ($12.67M) | ($16.35M) | $1.71M | ($16.72M) | $27.79M |
| R&D Expenses | N/A* | N/A* | N/A* | $3.33M | $4.28M |
| Operating Cash Flow | ($19.41M) | ($30.66M) | ($12.70M) | ($11.46M) | $2.65M |
| Cash & Cash Equivalents | $19.05M | $7.83M | $9.12M | $10.57M | $18.93M |
Core operations achieved a milestone in FY2026, turning Operating Cash Flow positive at $2.65 million, recovering from a cumulative cash burn exceeding $74 million between FY2022 and FY2025. This transition to positive cash flow stabilized cash reserves at $18.93 million.
However, net profitability contains structural distortions. The reported FY2026 Net Income of $27.79 million was heavily supported by a non-operating Foreign Exchange Gain (為替差益) of $17.79 million (2.66 billion JPY) stemming from the depreciation of the Japanese Yen against USD and EUR transaction balances. Adjusted for this FX tailwind, core operational earnings are represented by the Operating Income of $8.93 million (although management's alternative internal metrics cite a structural operating profit of $26.55 million / 3.97 billion JPY based on non-GAAP cost allocations).
Operating expenses highlight a disciplined cost containment strategy. Research and development spending was tightly managed at $4.28 million (640.21 million JPY), representing 5.9% of FY2026 revenue. This suggests that the primary clinical pipeline has transitioned past capital-intensive clinical trials into commercial harvesting. Conversely, non-R&D Selling, General, and Administrative (SG&A) expenses stood at $44.10 million (6.59 billion JPY) to support direct sales efforts in Western markets.
To bridge its historical cash-burn phase, 3-D Matrix, Ltd. relied heavily on highly dilutive capital raises. Outstanding common shares expanded from 55.13 million in FY2022 to 127.97 million in FY2026—a 132% equity base expansion. Key dilution mechanisms include:
* The 9th Series Unsecured Convertible Bonds: This roughly $25 million issuance resulted in the exercise and conversion of 9,919,351 new shares.
* Active Stock Acquisition Rights (Warrants): The company currently carries an active pipeline of warrants spanning the 38th, 40th, 41st, 42nd, 43rd, 44th, and 45th series. The 45th series alone originally issued 259,000 rights (with 249,400 rights remaining active), converting at a ratio of 1:100 to represent a potential overhang of 24.94 million shares.
Geographic Revenue Dispersion, Clinical Moats, and Supply Chain Architecture
3-D Matrix, Ltd. has prioritized regional commercialization, with the Americas becoming the dominant market, offsetting stagnation in domestic Japanese operations. The table below outlines the geographic revenue contribution for the FY2025 and FY2026 periods:
Table Geographic Revenue Performance (FY2025–FY2026)
| Region | FY2025 Revenue (USD M) | FY2026 Revenue (USD M) | YoY Growth | FY2026 Revenue Contribution |
|---|---|---|---|---|
| Americas | $21.07M | $41.78M | +98.2% | 57.4% |
| Europe | $13.72M | $17.35M | +26.5% | 23.8% |
| Japan | $8.25M | $8.40M | +1.8% | 11.5% |
| Asia-Pacific (Excluding Japan) | $3.30M | $5.24M | +58.5% | 7.2% |
| Total Global Revenue | $46.36M | $72.78M | +57.0% | 100.0% |
The company's technology platform is built on synthetic Self-Assembling Peptides (SAPs), specifically the RADA16 (Arginine-Alanine-Aspartic Acid) 16-amino acid sequence. Upon exposure to physiological pH or salts, the liquid monomer instantly self-assembles into a nanofiber hydrogel. This synthetic profile avoids the infection risks associated with traditional animal-derived collagen or gelatin matrices (e.g., bovine or porcine pathogens) and maintains complete tissue biocompatibility (degrading into natural amino acids). Furthermore, the hydrogel is transparent, allowing surgeons to preserve clear visibility during complex endoscopic and surgical procedures.
The regulatory roadmap has progressed through key milestones:
* Europe: CE Mark achieved in 2014, currently supported by Post-Market Clinical Follow-up (PMCF) studies for expanded surgical use cases.
* United States: FDA 510(k) clearances secured in 2015, 2021, and 2022, catalyzing the current growth in the Americas. Management is pursuing De Novo pathways for novel, non-equivalent surgical classifications in late 2025 and 2026.
* Pipeline Assets: TDM-621 (PuraStat) is currently undergoing a Randomized Controlled Trial (RCT) for Hereditary Hemorrhagic Telangiectasia (HHT). TDM-644 operates commercially as a mucosal lifting agent for Endoscopic Submucosal Dissection (ESD). TDM-511 utilizes an A6K (AAAAAAK) peptide sequence as a Drug Delivery System (DDS) for targeted siRNA delivery in refractory breast cancer (RPN2 gene), currently in Phase I trials through partner PURMX.
The physical footprint of 3-D Matrix, Ltd. is 100% fabless, maximizing operating leverage but concentrating risk:
* Contract Manufacturing (CMO): The entire supply chain relies on a single contract manufacturer, Pharmpur GmbH in Germany, for both raw peptide synthesis and finished product assembly (such as prefilled syringes).
* European Distribution: FUJIFILM Europe B.V. serves as the primary distributor in the EMEA region, accounting for $9.73 million (1.45 billion JPY) or 13.4% of total global sales in FY2026, down from 18.3% in FY2025 as direct sales channels expanded.
* Quality Frameworks: Quality operations are validated through the ISO 13485 certification achieved by European subsidiary 3-D Matrix Europe SAS in 2012.
Forensic working capital metrics extracted from the balance sheets reveal high operational efficiency:
Table Inventory Composition Analysis (FY2025–FY2026)
| Inventory Component | FY2025 Inventory (USD M) | FY2026 Inventory (USD M) | FY2026 Inventory Mix |
|---|---|---|---|
| Merchandise & Finished Goods | $1.23M | $1.49M | 39.4% |
| Work in Process (WIP) | $1.59M | $1.97M | 52.2% |
| Raw Materials & Supplies | $0.30M | $0.32M | 8.4% |
| Total Inventory Value | $3.12M | $3.78M | 100.0% |
Based on a FY2026 COGS of $15.47 million and an average inventory of $3.45 million, the company operates at an Inventory Turnover Ratio of ~4.48x, which translates into 81.4 Days Sales of Inventory (DSI). This represents approximately 2.5 months of buffer stock, mitigating trans-Atlantic logistics bottlenecks between the German CMO and Western end-markets.
HDIN Institutional Verdict
While management's execution in scaling US revenues by 98.2% has successfully driven operating cash flows into positive territory, institutional investors must monitor two structural risks that could affect long-term valuation:
First, 3-D Matrix, Ltd. does not own its foundational technology. Its entire commercial pipeline is governed by an Exclusive Patent License Agreement with the Massachusetts Institute of Technology (MIT), originally signed in 2003 (with amendments in 2004 and 2007). Standard utility patent lifespans of 20 years suggest that the core patents protecting the RADA16 platform are entering a standard patent cliff window. As these expire, the technological barrier will shift from absolute patent protection to regulatory and manufacturing complexity. Additionally, Arch Therapeutics, Inc. continues to represent a potential litigation threat, with the risk of patent validity challenges that could compromise the company's exclusive commercial rights.
Second, despite achieving operational profitability in FY2026, the company’s statutory filings continue to carry an explicit warning regarding "Material Uncertainty Regarding Going Concern" due to historical cumulative losses.
Furthermore, the shareholder base is highly fragmented. The top two stakeholders—a JP Morgan client account holding 2.02% and BNY GCM holding 1.76%—suggest a lack of a stabilizing anchor investor. This extreme dispersion, paired with the active overhang of convertible debt and successive warrant series (up to the 45th series), means that any upward stock performance is likely to trigger institutional conversions, diluting EPS and limiting near-term per-share value appreciation.
Presentation Download & Video Access:
Presentation Download: Click the PDF download link under 'Related Topics' to access the full institutional presentation of this report.
Video Link: Click this link to watch the HDIN analyst briefing on YouTube.
About HDIN Research:
HDIN Research is a premier global market intelligence and strategic advisory firm specializing in institutional-grade financial analysis, supply chain audits, and macroeconomic forecasting. Our dedicated sector analysts deliver actionable, data-driven insights tailored for private equity, hedge funds, and corporate strategy teams. Visit us at http://www.hdinresearch.com.
2026 AI Transparency Footer:
"This intelligence report was authored by HDIN Research analysts following a rigorous audit of official corporate filings. AI was utilized for massive-scale data synthesis and structural drafting, ensuring 100% inclusion of reported data points. All strategic insights, financial modeling, and final verdicts were verified by our editorial board to ensure professional accuracy and compliance with 2026 Google Search E-E-A-T standards."