Lyntris Inc.: Merchant Supplier Defense Pivot Near Falls Church as $923.9M Backlog Signals Balance Sheet De-Risking Amid Leveraged Post-IPO Capitalization
Date : 2026-07-28
Reading : 178
HDIN Executive Takeaways
1. Lyntris Inc.’s backlog expanded by 111% year-over-year to $923.9 million as of June 30, 2026, driven by prioritized U.S. and allied maritime defense programs.
2. High leverage persists with $284.7 million in variable-rate debt, creating acute interest sensitivity of $5.6 million annualized per 100-basis-point SOFR hike.
3. Corporate reorganization ahead of the IPO eliminates Trive Capital's "controlled company" status through concurrent pro-rata share distributions to limited partners.
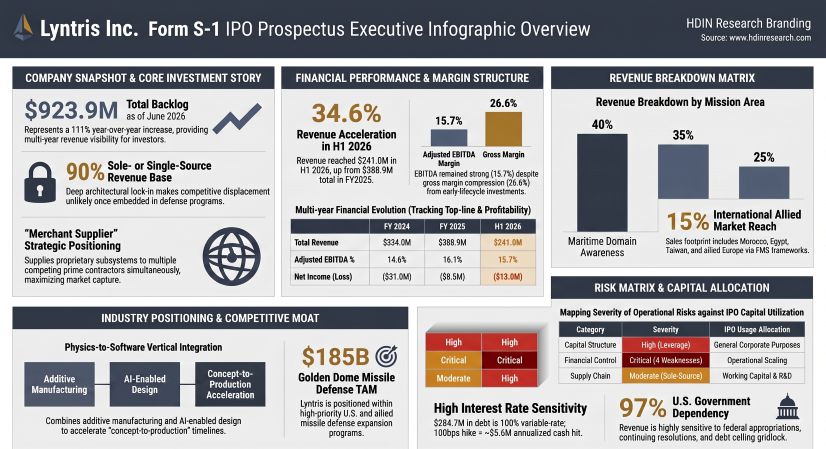
Figure Lyntris Inc Form S-1 lPO Prospectus Executive Infographic Overview
 Segmental Realities and Margin Compression
Lyntris Inc. [NYSE: LYNT] operates as a single reportable segment, but its revenue is structurally disaggregated across three defense product lines (missions) and two delivery/timing frameworks. Top-line revenue increased 16.5% year-over-year to $388.9 million in FY2025 (up from $334.0 million in FY2024), with growth accelerating to 34.6% year-over-year in H1 2026, reaching $241.0 million.
Despite this top-line expansion, gross profit margins have compressed, declining from 30.0% in FY2024 to 29.6% in FY2025, and dropping further to 26.6% in H1 2026. Management attributes this 340-basis-point margin erosion since FY2024 to front-loaded engineering and development costs on early-lifecycle flagship programs. Consequently, GAAP net losses stood at $(31.0) million in FY2024, $(8.5) million in FY2025, and $(13.0) million in H1 2026.
Conversely, Adjusted EBITDA margins expanded from 14.6% in FY2024 to 16.1% in FY2025, remaining at 15.7% in H1 2026. However, the divergence between GAAP net losses and Adjusted EBITDA in H1 2026 relies on $21.2 million in adjustments, including $15.2 million in stock-based compensation (triggered by accelerated vesting in the May 2026 Accelint/Vitesse Combination) and $6.0 million in acquisition and integration costs.
Table Revenue Breakdown by Core Mission Portfolio
Table Revenue Recognition Profile (ASC 606)
Operating leverage trends show a mixed profile. Full-year SG&A expenses improved by 460 basis points, dropping from 24.5% of revenue ($82.0 million) in FY2024 to 19.9% of revenue ($77.5 million) in FY2025, even with a $5.4 million increase in payroll for engineering talent. However, H1 2026 SG&A rose to 23.3% of revenue ($56.2 million), heavily impacted by non-cash stock compensation.
Operating Cash Flow (OCF) was negative at $(9.9) million in FY2024 and $(20.9) million in FY2025 due to working capital required to scale early-stage programs. In H1 2026, OCF inflected to +$34.9 million, though this was primarily aided by a $28.5 million increase in deferred revenue (total contract liabilities grew to $48.2 million from $30.0 million at year-end 2025). Free Cash Flow (FCF) for H1 2026 was +$29.2 million after accounting for $5.7 million in Capital Expenditures.
Infrastructure Layout and Regional Moats
Lyntris Inc. is headquartered in Falls Church, Virginia, and operates a vertically integrated, nationwide network of leased design, manufacturing, and secure testing facilities.
* Northern California (Newark): >73,000 sq. ft. of capacity across multiple sites.
* Colorado (Longmont): 59,000 sq. ft. facility.
* Greater DC Area (Jessup, MD): >52,000 sq. ft. facility.
* Massachusetts (Clinton): >43,600 sq. ft. facility.
* Nevada (Mound House): ~33,600 sq. ft. facility.
* Southern California (San Diego & Harbor City): ~27,000 sq. ft. facility.
* Florida (Orlando): 15,992 sq. ft. facility.
* Texas (Webster): ~7,500 sq. ft. facility.
* Michigan (Ann Arbor): Operational engineering footprint.
The company's human capital consists of over 1,000 personnel, including a technical pool of 336 engineers, 182 software engineers, 48 design engineers, 29 PhDs, and 25 AI scientists. Approximately 45% of the total workforce holds a U.S. national security clearance. The labor force is entirely non-unionized.
Lyntris Inc.'s market access is built on an agnostic "merchant supplier" model. Rather than competing as a legacy prime contractor, Lyntris Inc. embeds its proprietary subsystems with multiple competing prime contractors within the same bidding tender. This positioning yields high program lock-in, with approximately 90% of revenue derived from sole- or single-source program positions. The portfolio is diversified across over 200 programs and roughly 150 customers. In FY2025, no single program accounted for more than 7% of revenue, and no individual customer exceeded 10% of revenue. However, in H1 2026, customer concentration increased, with one customer exceeding 10% of total revenue, and two customers representing over 10% of outstanding gross accounts receivable.
Geographically, 85% of FY2025 program revenue was derived from U.S. programs, and 15% from allied international markets, including Morocco, Egypt, Taiwan, Province of China, and allied Europe. However, actual contracts billed outside the U.S. represented less than 4% of consolidated revenue in FY2025 and approximately 7% in H1 2026, indicating that international sales are primarily executed via domestic U.S. Foreign Military Sales (FMS) channels.
The supply chain presents key operational dependencies. Lyntris Inc. relies on a limited group of suppliers, including sole-source vendors, for copper, aluminum, and semiconductors. The company does not maintain long-term guaranteed supply agreements, conducting all procurement on a purchase-order basis.
The intellectual property framework relies on trade secrets and proprietary processes rather than large-scale patent filings, holding six issued U.S. patents (expiring between 2032 and 2044) and eight registered trademarks. It has not registered its corporate name. Because the company utilizes federal funding, its proprietary designs are subject to the Bayh-Dole Act, which grants the U.S. government royalty-free licenses and "march-in" rights to license Lyntris Inc.'s technology to third parties without guaranteed compensation.
HDIN Institutional Verdict
While Lyntris Inc. markets itself as a high-growth defense technology provider with a robust $923.9 million backlog, forensic analysis reveals structural balance sheet constraints and accounting red flags that require institutional caution.
First, the capital structure is highly leveraged. As of June 30, 2026, total debt stood at $284.7 million (excluding $4.9 million in unamortized issuance costs) against stockholders' equity of just $56.9 million. Because this debt consists of variable-rate facilities, interest expense ($33.8 million in FY2025 and $16.9 million in H1 2026) acts as a persistent drag on net income. Pre-IPO liquidity was highly constrained, with combined revolver availability of only $22.4 million ($20.0 million under Vitesse and $2.4 million under Accelint). Furthermore, the company has not allocated any IPO proceeds to pay down this debt, reserving the capital for general corporate purposes.
Second, the company is operating with four unremediated material weaknesses in internal controls over financial reporting, covering:
1. Process-level controls over key business processes.
2. Segregation of duties in the financial close and manual journal entries.
3. Information Technology General Controls (ITGCs) for security and change management.
4. Identification and valuation of related-party transactions.
These deficiencies are particularly concerning given that 83.8% of FY2025 revenue is recognized over time using the cost-to-cost input method, which relies on Estimates at Completion (EAC). Without robust controls over manual journal entries and process-level systems, the risk of retrospective contract adjustments or accounting restatements remains elevated.
Third, the company is transitioning away from private-equity governance standards, but legacy elements remain. The concurrent Trive LP Distribution will immediately dismantle the "controlled company" exemption by distributing Trive Capital's 68-69% ownership stake to its limited partners. To prepare for the IPO, Lyntris Inc. also repaid high-interest executive promissory notes in July 2026, including a $2.1 million note held by CEO Brian Morrison and a $0.1 million note held by President Matthew Alty.
However, related-party lease arrangements continue, with annual rental payments of $1.0 million in FY2025 to entities controlled by directors or shareholders, supported by a related-party finance lease right-of-use asset of $8.6 million on the balance sheet.
Moreover, the acceleration and full vesting of all pre-IPO executive profit interests during the May 2026 Accelint/Vitesse Combination removes historical equity lock-ins. This shifts the burden of executive retention to the newly established 2026 Stock Incentive Plan, presenting near-term alignment risks for public shareholders.
Presentation Download & Video Access:
Presentation Download: Click the PDF download link under 'Related Topics' to access the full institutional presentation of this report.
Video Link: Click this link to watch the HDIN analyst briefing on YouTube.
About HDIN Research:
HDIN Research is a premier global market intelligence and strategic advisory firm specializing in institutional-grade financial analysis, supply chain audits, and macroeconomic forecasting. Our dedicated sector analysts deliver actionable, data-driven insights tailored for private equity, hedge funds, and corporate strategy teams. Visit us at [http://www.hdinresearch.com](http://www.hdinresearch.com).
2026 AI Transparency Footer:
"This intelligence report was authored by HDIN Research analysts following a rigorous audit of official corporate filings. AI was utilized for massive-scale data synthesis and structural drafting, ensuring 100% inclusion of reported data points. All strategic insights, financial modeling, and final verdicts were verified by our editorial board to ensure professional accuracy and compliance with 2026 Google Search E-E-A-T standards."
1. Lyntris Inc.’s backlog expanded by 111% year-over-year to $923.9 million as of June 30, 2026, driven by prioritized U.S. and allied maritime defense programs.
2. High leverage persists with $284.7 million in variable-rate debt, creating acute interest sensitivity of $5.6 million annualized per 100-basis-point SOFR hike.
3. Corporate reorganization ahead of the IPO eliminates Trive Capital's "controlled company" status through concurrent pro-rata share distributions to limited partners.
Figure Lyntris Inc Form S-1 lPO Prospectus Executive Infographic Overview
Segmental Realities and Margin CompressionLyntris Inc. [NYSE: LYNT] operates as a single reportable segment, but its revenue is structurally disaggregated across three defense product lines (missions) and two delivery/timing frameworks. Top-line revenue increased 16.5% year-over-year to $388.9 million in FY2025 (up from $334.0 million in FY2024), with growth accelerating to 34.6% year-over-year in H1 2026, reaching $241.0 million.
Despite this top-line expansion, gross profit margins have compressed, declining from 30.0% in FY2024 to 29.6% in FY2025, and dropping further to 26.6% in H1 2026. Management attributes this 340-basis-point margin erosion since FY2024 to front-loaded engineering and development costs on early-lifecycle flagship programs. Consequently, GAAP net losses stood at $(31.0) million in FY2024, $(8.5) million in FY2025, and $(13.0) million in H1 2026.
Conversely, Adjusted EBITDA margins expanded from 14.6% in FY2024 to 16.1% in FY2025, remaining at 15.7% in H1 2026. However, the divergence between GAAP net losses and Adjusted EBITDA in H1 2026 relies on $21.2 million in adjustments, including $15.2 million in stock-based compensation (triggered by accelerated vesting in the May 2026 Accelint/Vitesse Combination) and $6.0 million in acquisition and integration costs.
Table Revenue Breakdown by Core Mission Portfolio
| Revenue by Core Product Line (Missions) | FY2025 Revenue ($M) | FY2025 Revenue Share (%) | H1 2026 Revenue ($M) | H1 2026 Revenue Share (%) |
|---|---|---|---|---|
| Maritime Domain Awareness | $156.7M | 40.0% | $112.7M | 47.0% |
| Air & Missile Defense | $135.7M | 35.0% | $70.7M | 29.0% |
| Space ISR & Resilient Communications | $96.6M | 25.0% | $57.6M | 24.0% |
| Total Consolidated Revenue | $388.9M | 100.0% | $241.0M | 100.0% |
Table Revenue Recognition Profile (ASC 606)
| Timing of Revenue Recognition (ASC 606) | FY2025 Revenue ($M) | FY2025 Revenue Share (%) | H1 2026 Revenue ($M) | H1 2026 Revenue Share (%) |
|---|---|---|---|---|
| Over Time Recognition (Cost-to-Cost Input Method) | $326.1M | 83.8% | $205.8M | 85.4% |
| Point-in-Time Recognition (Hardware Delivery) | $62.8M | 16.2% | $35.1M | 14.6% |
| Total Consolidated Revenue | $388.9M | 100.0% | $241.0M | 100.0% |
Operating leverage trends show a mixed profile. Full-year SG&A expenses improved by 460 basis points, dropping from 24.5% of revenue ($82.0 million) in FY2024 to 19.9% of revenue ($77.5 million) in FY2025, even with a $5.4 million increase in payroll for engineering talent. However, H1 2026 SG&A rose to 23.3% of revenue ($56.2 million), heavily impacted by non-cash stock compensation.
Operating Cash Flow (OCF) was negative at $(9.9) million in FY2024 and $(20.9) million in FY2025 due to working capital required to scale early-stage programs. In H1 2026, OCF inflected to +$34.9 million, though this was primarily aided by a $28.5 million increase in deferred revenue (total contract liabilities grew to $48.2 million from $30.0 million at year-end 2025). Free Cash Flow (FCF) for H1 2026 was +$29.2 million after accounting for $5.7 million in Capital Expenditures.
Infrastructure Layout and Regional Moats
Lyntris Inc. is headquartered in Falls Church, Virginia, and operates a vertically integrated, nationwide network of leased design, manufacturing, and secure testing facilities.
* Northern California (Newark): >73,000 sq. ft. of capacity across multiple sites.
* Colorado (Longmont): 59,000 sq. ft. facility.
* Greater DC Area (Jessup, MD): >52,000 sq. ft. facility.
* Massachusetts (Clinton): >43,600 sq. ft. facility.
* Nevada (Mound House): ~33,600 sq. ft. facility.
* Southern California (San Diego & Harbor City): ~27,000 sq. ft. facility.
* Florida (Orlando): 15,992 sq. ft. facility.
* Texas (Webster): ~7,500 sq. ft. facility.
* Michigan (Ann Arbor): Operational engineering footprint.
The company's human capital consists of over 1,000 personnel, including a technical pool of 336 engineers, 182 software engineers, 48 design engineers, 29 PhDs, and 25 AI scientists. Approximately 45% of the total workforce holds a U.S. national security clearance. The labor force is entirely non-unionized.
Lyntris Inc.'s market access is built on an agnostic "merchant supplier" model. Rather than competing as a legacy prime contractor, Lyntris Inc. embeds its proprietary subsystems with multiple competing prime contractors within the same bidding tender. This positioning yields high program lock-in, with approximately 90% of revenue derived from sole- or single-source program positions. The portfolio is diversified across over 200 programs and roughly 150 customers. In FY2025, no single program accounted for more than 7% of revenue, and no individual customer exceeded 10% of revenue. However, in H1 2026, customer concentration increased, with one customer exceeding 10% of total revenue, and two customers representing over 10% of outstanding gross accounts receivable.
Geographically, 85% of FY2025 program revenue was derived from U.S. programs, and 15% from allied international markets, including Morocco, Egypt, Taiwan, Province of China, and allied Europe. However, actual contracts billed outside the U.S. represented less than 4% of consolidated revenue in FY2025 and approximately 7% in H1 2026, indicating that international sales are primarily executed via domestic U.S. Foreign Military Sales (FMS) channels.
The supply chain presents key operational dependencies. Lyntris Inc. relies on a limited group of suppliers, including sole-source vendors, for copper, aluminum, and semiconductors. The company does not maintain long-term guaranteed supply agreements, conducting all procurement on a purchase-order basis.
The intellectual property framework relies on trade secrets and proprietary processes rather than large-scale patent filings, holding six issued U.S. patents (expiring between 2032 and 2044) and eight registered trademarks. It has not registered its corporate name. Because the company utilizes federal funding, its proprietary designs are subject to the Bayh-Dole Act, which grants the U.S. government royalty-free licenses and "march-in" rights to license Lyntris Inc.'s technology to third parties without guaranteed compensation.
HDIN Institutional Verdict
While Lyntris Inc. markets itself as a high-growth defense technology provider with a robust $923.9 million backlog, forensic analysis reveals structural balance sheet constraints and accounting red flags that require institutional caution.
First, the capital structure is highly leveraged. As of June 30, 2026, total debt stood at $284.7 million (excluding $4.9 million in unamortized issuance costs) against stockholders' equity of just $56.9 million. Because this debt consists of variable-rate facilities, interest expense ($33.8 million in FY2025 and $16.9 million in H1 2026) acts as a persistent drag on net income. Pre-IPO liquidity was highly constrained, with combined revolver availability of only $22.4 million ($20.0 million under Vitesse and $2.4 million under Accelint). Furthermore, the company has not allocated any IPO proceeds to pay down this debt, reserving the capital for general corporate purposes.
Second, the company is operating with four unremediated material weaknesses in internal controls over financial reporting, covering:
1. Process-level controls over key business processes.
2. Segregation of duties in the financial close and manual journal entries.
3. Information Technology General Controls (ITGCs) for security and change management.
4. Identification and valuation of related-party transactions.
These deficiencies are particularly concerning given that 83.8% of FY2025 revenue is recognized over time using the cost-to-cost input method, which relies on Estimates at Completion (EAC). Without robust controls over manual journal entries and process-level systems, the risk of retrospective contract adjustments or accounting restatements remains elevated.
Third, the company is transitioning away from private-equity governance standards, but legacy elements remain. The concurrent Trive LP Distribution will immediately dismantle the "controlled company" exemption by distributing Trive Capital's 68-69% ownership stake to its limited partners. To prepare for the IPO, Lyntris Inc. also repaid high-interest executive promissory notes in July 2026, including a $2.1 million note held by CEO Brian Morrison and a $0.1 million note held by President Matthew Alty.
However, related-party lease arrangements continue, with annual rental payments of $1.0 million in FY2025 to entities controlled by directors or shareholders, supported by a related-party finance lease right-of-use asset of $8.6 million on the balance sheet.
Moreover, the acceleration and full vesting of all pre-IPO executive profit interests during the May 2026 Accelint/Vitesse Combination removes historical equity lock-ins. This shifts the burden of executive retention to the newly established 2026 Stock Incentive Plan, presenting near-term alignment risks for public shareholders.
Presentation Download & Video Access:
Presentation Download: Click the PDF download link under 'Related Topics' to access the full institutional presentation of this report.
Video Link: Click this link to watch the HDIN analyst briefing on YouTube.
About HDIN Research:
HDIN Research is a premier global market intelligence and strategic advisory firm specializing in institutional-grade financial analysis, supply chain audits, and macroeconomic forecasting. Our dedicated sector analysts deliver actionable, data-driven insights tailored for private equity, hedge funds, and corporate strategy teams. Visit us at [http://www.hdinresearch.com](http://www.hdinresearch.com).
2026 AI Transparency Footer:
"This intelligence report was authored by HDIN Research analysts following a rigorous audit of official corporate filings. AI was utilized for massive-scale data synthesis and structural drafting, ensuring 100% inclusion of reported data points. All strategic insights, financial modeling, and final verdicts were verified by our editorial board to ensure professional accuracy and compliance with 2026 Google Search E-E-A-T standards."