Fly-E Group, Inc.: Strategic Retail Liquidation Near Maspeth Assembly Hub as Negative 27.8% ROIC and SEC Probe Signal Insolvency Risks
Date : 2026-07-28
Reading : 125
HDIN Executive Takeaways
1. Fly-E Group, Inc. [OTC: FLYE] faces an acute liquidity crisis, with cash reserves collapsing to $265,236 and an operating cash burn of $13.85 million.
2. Operational consolidation saw the liquidation of 24 retail locations for $2.3 million to mitigate New York City compliance pressures, forcing an artificial pivot to wholesale.
3. A negative 27.8% Return on Invested Capital (ROIC) and a punitive 12.875% forbearance rate on defaulted credit highlight severe capital destruction.
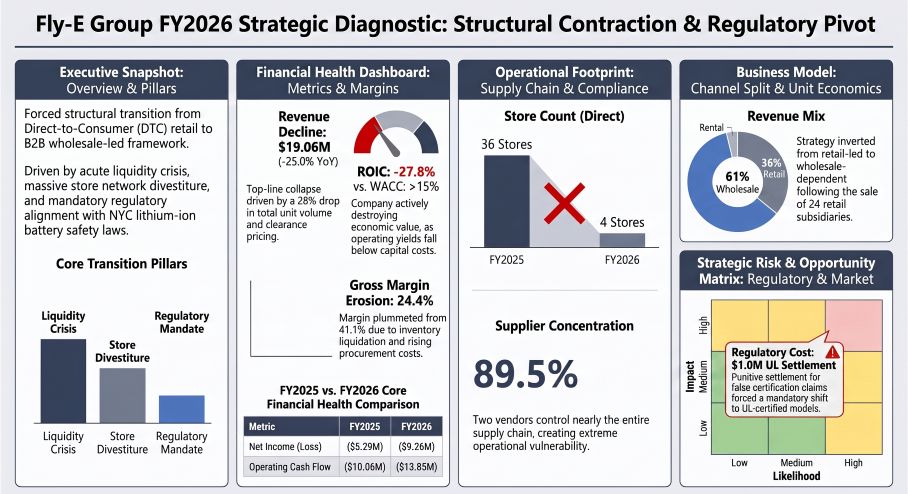
Figure Fly-E Group FY2026 Strategic Diagnostic: Structural Contraction & Regulatory Pivot
 Segmental Realities and Margin Compression
A forensic audit of the FY2026 annual report for Fly-E Group, Inc. [OTC: FLYE] reveals a fundamental collapse in core earnings and a distressed balance sheet restructuring. Net revenues for FY2026 contracted 25.0% year-over-year to $19.06 million, down from $25.43 million in FY2025. This top-line contraction was accompanied by a 55.4% drop in gross profit to $4.66 million, compressing the gross margin by 1,670 basis points from 41.1% in FY2025 to 24.4% in FY2026.
The company's net loss widened by 75.0% to $9.26 million, while EBITDA worsened from negative $3.85 million in FY2025 to negative $6.29 million in FY2026. The EBITDA margin plummeted from -15.2% to -33.0%. These losses occurred despite a 53.0% reduction in selling expenses to $3.48 million (representing 18.2% of net revenues), which was driven primarily by headcount and rent reductions from store closures rather than organic marketing efficiencies. Direct advertising expenses were nearly eliminated, falling from $300,000 in FY2025 to $36,604 in FY2026.
Table FLY-E GROUP, INC. KEY SEGMENTAL REVENUE & FINANCIAL PERFORMANCE
*Estimated based on historical CapEx trends.
The underlying sales channels underwent a forced structural inversion:
* B2B Wholesale / Distributor Network: Generated $11.56 million (60.6% of total revenue), an increase of 227.5% year-over-year. This growth was driven by the divestment of 24 retail store subsidiaries to third-party owners, who then continued to purchase inventory from Fly-E Group, Inc. as independent wholesale clients. The distributor network includes 64 entities in the U.S. and one in the Dominican Republic.
* DTC Flagship Retail: Plunged 68.1% year-over-year to $6.92 million (36.3% of total revenue) as the company reduced its retail footprint.
* Rental & Installment Model: Expanded 237.5% year-over-year to $0.58 million (3.0% of total revenue), utilizing the "Go Fly" mobile app to rent vehicles in New York and Los Angeles.
Unit volumes fell to 42,101 units in FY2026, down from 58,765 units in FY2025. The blended average selling price (ASP) was approximately $439. Assembly volume at the central facility totaled 11,266 units in FY2026, consisting of 6,722 e-bikes (59.6%), 2,714 e-motorcycles (24.1%), and 1,830 e-scooters (16.2%).
On the balance sheet, a reported working capital of $10.0 million (current assets of $16.81 million against current liabilities of $6.80 million) is constrained by illiquid assets. Current assets are heavily weighted toward accounts receivable of $7.05 million and prepayments of $6.97 million, leaving the company with only $265,236 in cash.
To support its wholesale transition, the company relaxed its credit terms, causing third-party accounts receivable to rise from $541,833 in FY2025 to $7,225,971 in FY2026. The allowance for expected credit losses (CECL) increased from $75,646 to $176,379. In FY2025, the top three accounts receivable clients represented 24.0%, 13.1%, and 11.7% of the total balance (48.8% combined); in FY2026, no single customer exceeded 10.0% of outstanding receivables.
Outstanding loan payables total $5.98 million, with $4.03 million classified as short-term. The company is in default on its $3.94 million revolving credit facility with Peapack-Gladstone Bank, forcing it into a forbearance agreement with a punitive interest rate of 12.875%. Long-term debt consists of a $1.95 million mortgage from Velocity Commercial Capital. Previously, the company utilized highly expensive short-term debt, including a loan from Agile Capital Funding carrying an annual interest rate of 72.8%, which has since been repaid.
Table PRODUCT QUALITY AND WARRANTY METRIC ANALYSIS
The cash conversion cycle (CCC) mathematically compressed to 154 days in FY2026 from 181 days in FY2025, driven by:
* Days Inventory Outstanding (DIO): Reduced to 111 days (down from 143 days) due to the liquidation of stock from closed retail locations. Gross inventory fell from $7,504,843 to $3,193,677, with battery inventory comprising 56.2% ($1,795,389), electric vehicles at 27.9% ($892,143), tires at 9.1% ($290,594), and accessories at 6.7% ($215,551). The inventory reserve ratio rose to 26.9% ($859,193 reserve on $3,193,677 gross) compared to 14.8% in FY2025 ($1,107,569 reserve on $7,504,843 gross), reflecting the obsolescence risk of non-UL-compliant battery stock.
* Days Sales Outstanding (DSO): Increased to 72 days (up from 71 days) due to looser credit terms.
* Days Payable Outstanding (DPO): Compressed to 29 days (down from 33 days) as the company accelerated supplier payments following the closure of a major supplier.
Core capital efficiency is deeply negative. Using an operating loss (EBIT) of negative $6.44 million and total invested capital of $23.15 million (calculated as debt of $5.98 million plus equity of $17.44 million, minus cash of $265,236), the company's ROIC is negative 27.8%, indicating significant economic value destruction relative to its estimated cost of capital.
Infrastructure Layout and Regional Moats
Fly-E Group, Inc. operates an asset-light assembly model rather than a vertically integrated manufacturing structure. All physical components are manually assembled at a single 52,264-square-foot leased facility located in Maspeth, New York. The company’s geographic exposure is highly concentrated in the New York metropolitan area, where its core target demographic of gig-economy delivery workers is located.
The retail consolidation led to the termination of 28 leases in FY2026, leaving only 9 active leases (representing a present value of lease liabilities of $4,809,665). The company's physical footprint now consists of only four directly operated flagship stores located in New York, Massachusetts, Washington D.C., and California. This reduction has impaired the geographic reach of its "Batteries-as-a-Service" (BaaS) swap network, which previously allowed riders to exchange depleted batteries in under one minute.
The company's supply chain is highly concentrated:
* Supplier Concentration: In FY2026, Depcl Corp. and Xiamen Innolabs Technology Co., Ltd. (XFT) accounted for 70.3% and 19.2% of component and accessory sourcing, respectively, representing a combined 89.5% of cost of goods sold. Under accounts payable, the top three suppliers represented 39.0%, 31.0%, and 15.0% of the balance.
* Geopolitical Realignment: Sourcing was significantly realigned to mitigate tariff exposure. Components sourced from the United States rose to over 81.0% in FY2026 (up from over 40.0% in FY2025), while imports from China fell to under 19.0% (down from over 50.0% in FY2025). The company relies on XFT to manage Chinese factory audits, proofing, and production inspections.
The regulatory environment has created substantial headwinds. New York City's Local Law 39 mandates that all e-bike batteries sold or leased must carry Underwriters Laboratories (UL) certification (such as UL 2849 or UL 2272). After a federal lawsuit by UL LLC alleging improper trademark use, Fly-E Group, Inc. paid a $1.0 million settlement in FY2026 and accepted a permanent injunction against selling products with unverified UL marks.
The company has since transitioned to compliant products, such as the certified "Fly-11 PRO." It qualified for the NYC Department of Transportation's $2.0 million trade-in program, which helps delivery workers exchange non-compliant equipment for certified models. However, the company faces ongoing regulatory risks, including a January 2025 National Park Service proposal to restrict powered micromobility devices on federal trails, and proposed NYC legislation requiring license plates and registration for e-bikes.
HDIN Institutional Verdict
The operational pivot of Fly-E Group, Inc. from retail to wholesale represents a distressed downsizing rather than an orderly strategic expansion. This transition is highlighted by the sale of 24 retail locations for a nominal cash consideration of $2.3 million—averaging less than $100,000 per store—to raise short-term capital. This strategy shifted the inventory burden to external distributors but led to a rapid expansion of high-risk accounts receivable and a 155% absolute increase in warranty expenses, signaling potential product quality and compliance issues.
Furthermore, the company's corporate governance presents significant risks to minority shareholders. The executive compensation structure is entirely fixed, with CEO Zhou Ou receiving a flat base salary of $100,000 and CFO Lisa Fan receiving $60,000. No performance-linked equity or cash incentives were outstanding under the 2024 Omnibus Incentive Plan as of March 31, 2026, leaving management's interests decoupled from shareholder value creation.
Severe C-suite instability is evident in the rapid turnover of the CFO position. Ruifeng Guo resigned amid extensive related-party transactions, and Shiwen Feng was named as a defendant in a federal securities class-action lawsuit alleging misleading statements regarding revenue and battery safety. Lisa Fan was subsequently appointed in September 2025.
Related-party transactions have led to significant capital outflows:
* CEO Advances: The company advanced $477,771 to CEO Zhou Ou for personal use (which has been repaid), and provided a $161,560 unsecured, zero-interest loan to Fly E Bike SRL, a Dominican Republic distributor in which the CEO holds a majority stake exceeding 50.0%.
* Former CFO Outflows: The company routed $2.5 million to DF Technology US Inc. for custom ERP development and prepaid $120,000 to PJMG LLC for compliance consulting. Both entities are controlled by former CFO Ruifeng Guo, who holds ownership stakes exceeding 50.0% in each.
Additionally, the company is facing an SEC investigation initiated on January 21, 2026, alongside federal securities class actions and consolidated shareholder derivative lawsuits (the Flynn and Shah Actions) alleging breach of fiduciary duty and mismanagement. In March 2026, the company dismissed its independent auditor, Marcum Asia CPAs LLP, and replaced them with Fortune CPA, Inc.
With its cash reserves down to $265,236, ongoing legal liabilities, ineffective internal controls, and defaulted debt, Fly-E Group, Inc. face significant going-concern risks. These structural vulnerabilities make the company highly susceptible to insolvency or dilutive capital restructuring.
Presentation Download & Video Access
Presentation Download: Click the PDF download link under 'Related Topics' to access the full institutional presentation of this report.
Video Link: Click this link to watch the HDIN analyst briefing on YouTube.
About HDIN Research
HDIN Research is a premier global market intelligence and strategic advisory firm specializing in institutional-grade financial analysis, supply chain audits, and macroeconomic forecasting. Our dedicated sector analysts deliver actionable, data-driven insights tailored for private equity, hedge funds, and corporate strategy teams. Visit us at [http://www.hdinresearch.com](http://www.hdinresearch.com).
2026 AI Transparency Footer
"This intelligence report was authored by HDIN Research analysts following a rigorous audit of official corporate filings. AI was utilized for massive-scale data synthesis and structural drafting, ensuring 100% inclusion of reported data points. All strategic insights, financial modeling, and final verdicts were verified by our editorial board to ensure professional accuracy and compliance with 2026 Google Search E-E-A-T standards."
1. Fly-E Group, Inc. [OTC: FLYE] faces an acute liquidity crisis, with cash reserves collapsing to $265,236 and an operating cash burn of $13.85 million.
2. Operational consolidation saw the liquidation of 24 retail locations for $2.3 million to mitigate New York City compliance pressures, forcing an artificial pivot to wholesale.
3. A negative 27.8% Return on Invested Capital (ROIC) and a punitive 12.875% forbearance rate on defaulted credit highlight severe capital destruction.
Figure Fly-E Group FY2026 Strategic Diagnostic: Structural Contraction & Regulatory Pivot
Segmental Realities and Margin CompressionA forensic audit of the FY2026 annual report for Fly-E Group, Inc. [OTC: FLYE] reveals a fundamental collapse in core earnings and a distressed balance sheet restructuring. Net revenues for FY2026 contracted 25.0% year-over-year to $19.06 million, down from $25.43 million in FY2025. This top-line contraction was accompanied by a 55.4% drop in gross profit to $4.66 million, compressing the gross margin by 1,670 basis points from 41.1% in FY2025 to 24.4% in FY2026.
The company's net loss widened by 75.0% to $9.26 million, while EBITDA worsened from negative $3.85 million in FY2025 to negative $6.29 million in FY2026. The EBITDA margin plummeted from -15.2% to -33.0%. These losses occurred despite a 53.0% reduction in selling expenses to $3.48 million (representing 18.2% of net revenues), which was driven primarily by headcount and rent reductions from store closures rather than organic marketing efficiencies. Direct advertising expenses were nearly eliminated, falling from $300,000 in FY2025 to $36,604 in FY2026.
Table FLY-E GROUP, INC. KEY SEGMENTAL REVENUE & FINANCIAL PERFORMANCE
| Financial Metric | FY2025 | FY2026 | YoY Change / Operational Analysis |
|---|---|---|---|
| Net Revenue | $25.43M | $19.06M | -25.1% — Overall revenue contraction driven primarily by the collapse of DTC retail sales |
| Wholesale Revenue | $3.53M | $11.56M | +227.8% — Strong wholesale expansion partially offset the decline in direct retail channels |
| DTC Retail Revenue | $21.73M | $6.92M | -68.2% — Significant channel deterioration, indicating weakening direct consumer demand |
| Rental & Installment Revenue | $0.17M | $0.58M | +237.2% — Small but rapidly growing recurring revenue stream |
| Gross Profit | $10.45M | $4.66M | -55.4% — Gross profit decline substantially exceeded revenue contraction |
| Gross Margin | 41.1% | 24.4% | -1,670 bps — Margin compression caused by unfavorable revenue mix shift toward lower-margin wholesale business |
| Net Loss | $5.29M | $9.26M | +75.0% — Operating losses widened despite wholesale growth |
| Operating Cash Flow (CFO) | -$10.06M | -$13.85M | Cash outflow increased by 37.7% — Higher operating cash consumption intensified liquidity pressure |
| Free Cash Flow (FCF) | -$11.95M | -$15.74M | Cash burn increased by 31.7% — Negative free cash flow indicates continued external financing dependence |
| Ending Cash & Cash Equivalents | $0.84M | $0.27M | -68.4% — Cash reserves significantly depleted, increasing near-term financing risk |
The underlying sales channels underwent a forced structural inversion:
* B2B Wholesale / Distributor Network: Generated $11.56 million (60.6% of total revenue), an increase of 227.5% year-over-year. This growth was driven by the divestment of 24 retail store subsidiaries to third-party owners, who then continued to purchase inventory from Fly-E Group, Inc. as independent wholesale clients. The distributor network includes 64 entities in the U.S. and one in the Dominican Republic.
* DTC Flagship Retail: Plunged 68.1% year-over-year to $6.92 million (36.3% of total revenue) as the company reduced its retail footprint.
* Rental & Installment Model: Expanded 237.5% year-over-year to $0.58 million (3.0% of total revenue), utilizing the "Go Fly" mobile app to rent vehicles in New York and Los Angeles.
Unit volumes fell to 42,101 units in FY2026, down from 58,765 units in FY2025. The blended average selling price (ASP) was approximately $439. Assembly volume at the central facility totaled 11,266 units in FY2026, consisting of 6,722 e-bikes (59.6%), 2,714 e-motorcycles (24.1%), and 1,830 e-scooters (16.2%).
On the balance sheet, a reported working capital of $10.0 million (current assets of $16.81 million against current liabilities of $6.80 million) is constrained by illiquid assets. Current assets are heavily weighted toward accounts receivable of $7.05 million and prepayments of $6.97 million, leaving the company with only $265,236 in cash.
To support its wholesale transition, the company relaxed its credit terms, causing third-party accounts receivable to rise from $541,833 in FY2025 to $7,225,971 in FY2026. The allowance for expected credit losses (CECL) increased from $75,646 to $176,379. In FY2025, the top three accounts receivable clients represented 24.0%, 13.1%, and 11.7% of the total balance (48.8% combined); in FY2026, no single customer exceeded 10.0% of outstanding receivables.
Outstanding loan payables total $5.98 million, with $4.03 million classified as short-term. The company is in default on its $3.94 million revolving credit facility with Peapack-Gladstone Bank, forcing it into a forbearance agreement with a punitive interest rate of 12.875%. Long-term debt consists of a $1.95 million mortgage from Velocity Commercial Capital. Previously, the company utilized highly expensive short-term debt, including a loan from Agile Capital Funding carrying an annual interest rate of 72.8%, which has since been repaid.
Table PRODUCT QUALITY AND WARRANTY METRIC ANALYSIS
| Product Quality & Warranty Metric | FY2025 | FY2026 | YoY Change / Operational Analysis |
|---|---|---|---|
| Product Revenue (DTC + Wholesale) | $25.26M | $18.48M | -26.8% — Product revenue contraction reflects weaker overall sales volume, primarily due to DTC channel decline |
| Warranty Additions (Expense) | $20,131 | $51,418 | +155.4% — Warranty provisions increased significantly despite lower revenue base |
| Warranty Cost-to-Product Revenue Ratio | 0.080% | 0.278% | +19.8 bps — Warranty burden increased by approximately 3.5×, indicating potential deterioration in product quality, customer usage conditions, or product mix |
| YoY Change in Warranty Cost Ratio | Baseline | +247.5 bps | Material deterioration — Warranty costs grew substantially faster than product revenue, creating additional margin pressure |
The cash conversion cycle (CCC) mathematically compressed to 154 days in FY2026 from 181 days in FY2025, driven by:
* Days Inventory Outstanding (DIO): Reduced to 111 days (down from 143 days) due to the liquidation of stock from closed retail locations. Gross inventory fell from $7,504,843 to $3,193,677, with battery inventory comprising 56.2% ($1,795,389), electric vehicles at 27.9% ($892,143), tires at 9.1% ($290,594), and accessories at 6.7% ($215,551). The inventory reserve ratio rose to 26.9% ($859,193 reserve on $3,193,677 gross) compared to 14.8% in FY2025 ($1,107,569 reserve on $7,504,843 gross), reflecting the obsolescence risk of non-UL-compliant battery stock.
* Days Sales Outstanding (DSO): Increased to 72 days (up from 71 days) due to looser credit terms.
* Days Payable Outstanding (DPO): Compressed to 29 days (down from 33 days) as the company accelerated supplier payments following the closure of a major supplier.
Core capital efficiency is deeply negative. Using an operating loss (EBIT) of negative $6.44 million and total invested capital of $23.15 million (calculated as debt of $5.98 million plus equity of $17.44 million, minus cash of $265,236), the company's ROIC is negative 27.8%, indicating significant economic value destruction relative to its estimated cost of capital.
Infrastructure Layout and Regional Moats
Fly-E Group, Inc. operates an asset-light assembly model rather than a vertically integrated manufacturing structure. All physical components are manually assembled at a single 52,264-square-foot leased facility located in Maspeth, New York. The company’s geographic exposure is highly concentrated in the New York metropolitan area, where its core target demographic of gig-economy delivery workers is located.
The retail consolidation led to the termination of 28 leases in FY2026, leaving only 9 active leases (representing a present value of lease liabilities of $4,809,665). The company's physical footprint now consists of only four directly operated flagship stores located in New York, Massachusetts, Washington D.C., and California. This reduction has impaired the geographic reach of its "Batteries-as-a-Service" (BaaS) swap network, which previously allowed riders to exchange depleted batteries in under one minute.
The company's supply chain is highly concentrated:
* Supplier Concentration: In FY2026, Depcl Corp. and Xiamen Innolabs Technology Co., Ltd. (XFT) accounted for 70.3% and 19.2% of component and accessory sourcing, respectively, representing a combined 89.5% of cost of goods sold. Under accounts payable, the top three suppliers represented 39.0%, 31.0%, and 15.0% of the balance.
* Geopolitical Realignment: Sourcing was significantly realigned to mitigate tariff exposure. Components sourced from the United States rose to over 81.0% in FY2026 (up from over 40.0% in FY2025), while imports from China fell to under 19.0% (down from over 50.0% in FY2025). The company relies on XFT to manage Chinese factory audits, proofing, and production inspections.
The regulatory environment has created substantial headwinds. New York City's Local Law 39 mandates that all e-bike batteries sold or leased must carry Underwriters Laboratories (UL) certification (such as UL 2849 or UL 2272). After a federal lawsuit by UL LLC alleging improper trademark use, Fly-E Group, Inc. paid a $1.0 million settlement in FY2026 and accepted a permanent injunction against selling products with unverified UL marks.
The company has since transitioned to compliant products, such as the certified "Fly-11 PRO." It qualified for the NYC Department of Transportation's $2.0 million trade-in program, which helps delivery workers exchange non-compliant equipment for certified models. However, the company faces ongoing regulatory risks, including a January 2025 National Park Service proposal to restrict powered micromobility devices on federal trails, and proposed NYC legislation requiring license plates and registration for e-bikes.
HDIN Institutional Verdict
The operational pivot of Fly-E Group, Inc. from retail to wholesale represents a distressed downsizing rather than an orderly strategic expansion. This transition is highlighted by the sale of 24 retail locations for a nominal cash consideration of $2.3 million—averaging less than $100,000 per store—to raise short-term capital. This strategy shifted the inventory burden to external distributors but led to a rapid expansion of high-risk accounts receivable and a 155% absolute increase in warranty expenses, signaling potential product quality and compliance issues.
Furthermore, the company's corporate governance presents significant risks to minority shareholders. The executive compensation structure is entirely fixed, with CEO Zhou Ou receiving a flat base salary of $100,000 and CFO Lisa Fan receiving $60,000. No performance-linked equity or cash incentives were outstanding under the 2024 Omnibus Incentive Plan as of March 31, 2026, leaving management's interests decoupled from shareholder value creation.
Severe C-suite instability is evident in the rapid turnover of the CFO position. Ruifeng Guo resigned amid extensive related-party transactions, and Shiwen Feng was named as a defendant in a federal securities class-action lawsuit alleging misleading statements regarding revenue and battery safety. Lisa Fan was subsequently appointed in September 2025.
Related-party transactions have led to significant capital outflows:
* CEO Advances: The company advanced $477,771 to CEO Zhou Ou for personal use (which has been repaid), and provided a $161,560 unsecured, zero-interest loan to Fly E Bike SRL, a Dominican Republic distributor in which the CEO holds a majority stake exceeding 50.0%.
* Former CFO Outflows: The company routed $2.5 million to DF Technology US Inc. for custom ERP development and prepaid $120,000 to PJMG LLC for compliance consulting. Both entities are controlled by former CFO Ruifeng Guo, who holds ownership stakes exceeding 50.0% in each.
Additionally, the company is facing an SEC investigation initiated on January 21, 2026, alongside federal securities class actions and consolidated shareholder derivative lawsuits (the Flynn and Shah Actions) alleging breach of fiduciary duty and mismanagement. In March 2026, the company dismissed its independent auditor, Marcum Asia CPAs LLP, and replaced them with Fortune CPA, Inc.
With its cash reserves down to $265,236, ongoing legal liabilities, ineffective internal controls, and defaulted debt, Fly-E Group, Inc. face significant going-concern risks. These structural vulnerabilities make the company highly susceptible to insolvency or dilutive capital restructuring.
Presentation Download & Video Access
Presentation Download: Click the PDF download link under 'Related Topics' to access the full institutional presentation of this report.
Video Link: Click this link to watch the HDIN analyst briefing on YouTube.
About HDIN Research
HDIN Research is a premier global market intelligence and strategic advisory firm specializing in institutional-grade financial analysis, supply chain audits, and macroeconomic forecasting. Our dedicated sector analysts deliver actionable, data-driven insights tailored for private equity, hedge funds, and corporate strategy teams. Visit us at [http://www.hdinresearch.com](http://www.hdinresearch.com).
2026 AI Transparency Footer
"This intelligence report was authored by HDIN Research analysts following a rigorous audit of official corporate filings. AI was utilized for massive-scale data synthesis and structural drafting, ensuring 100% inclusion of reported data points. All strategic insights, financial modeling, and final verdicts were verified by our editorial board to ensure professional accuracy and compliance with 2026 Google Search E-E-A-T standards."