Giantec Semiconductor Corporation: High-Margin NVM Pivot and Global
Date : 2026-07-30
Reading : 329
HDIN Executive Takeaways
1. Giantec Semiconductor Corporation [SSE: 688123] has successfully pivoted its product portfolio toward high-barrier Non-Volatile Memory (NVM) architectures, securing a 40.5% global market share in JEDEC-compliant DDR5 SPD companion chips, effectively shielding its gross margins through structural price premiumization prior to Q1 2026.
2. The company is executing a $23.00 million (CNY 165.3 million) capital allocation to diversify its pure-play Fabless manufacturing footprint into Singapore and South Korea, directly addressing a historical 53.9% single-foundry procurement concentration risk.
3. Despite a pristine legal compliance record, institutional investors face a localized "key-man" governance discount following an April 2026 regulatory warning issued to Chairman Chen Zuotao by the CSRC Beijing Bureau regarding undisclosed transactions at another controlled entity.
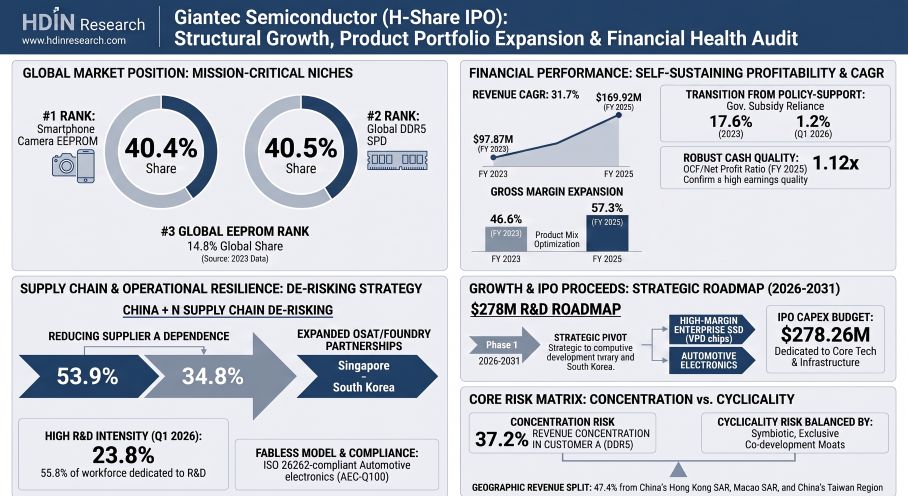
Figure Giantec Semiconductor (H-Share lPO): Structural Growth, Product Portfolio Expansion & Financial Health Audit
 Segmental Realities and Margin Compression
Giantec Semiconductor Corporation (Giantec) has demonstrated strong top-line expansion, with total revenue climbing from $97.87 million in FY2023 to $169.92 million in FY2025, representing a compound annual growth rate (CAGR) of 31.7%. Underpinning this growth is a highly calculated product mix shift toward high-margin enterprise and automotive verticals. Operating cash flow (OCF) reached $55.53 million in FY2025 against a Net Profit of $49.51 million (an OCF-to-Net Profit ratio of 1.12x), indicating high cash conversion quality and conservative accounting. Adjusted Net Profit expanded from $17.72 million in FY2023 to $54.01 million in FY2025, while calculated EBITDA grew from $14.66 million to $57.17 million over the same period.
However, Q1 2026 results reveal near-term headwinds. Total revenue reached $38.96 million (up 7.3% YoY), but Net Profit compressed to $4.53 million, and the net margin declined from 29.1% in FY2025 to 11.6% in Q1 2026. This contraction was driven by downstream DRAM/NAND packaging constraints that restricted high-margin SPD sales, alongside a spike in R&D and share-based compensation (SBC) expenses.
Revenue Decomposition and Gross Margin Trends by Product Line
* Non-Volatile Memory (NVM): This remains the primary revenue and margin engine, contributing 87.6% ($148.80 million) of FY2025 revenue and 88.4% ($34.44 million) of Q1 2026 revenue. Within NVM:
* SPD Chips: Revenue grew from $26.86 million in FY2023 to $66.22 million in FY2025 (representing a 40.5% global market share) but declined 28.3% YoY in Q1 2026 to $10.98 million due to downstream memory packaging bottlenecks.
* EEPROM: Revenue increased steadily from $48.75 million in FY2023 to $65.92 million in FY2025, and reached $15.04 million in Q1 2026 (up 2.5% YoY). Giantec maintains a 14.8% overall global EEPROM share (ranking 3), including a 40.4% share in Smartphone Camera EEPROM (1 globally), a 20.0% share in LCD Panel EEPROM (1), and a 4.7% share in Auto EEPROM (3).
* NOR Flash: Grew 281.9% YoY in Q1 2026 to $8.30 million (up from $16.42 million in FY2025 and $2.54 million in FY2023), driven by automotive design-ins.
* VPD & TS Chips: Commenced commercialization in FY2024 at $0.02 million, reaching $0.24 million in FY2025 and $0.11 million in Q1 2026.
* *NVM Segment Gross Margin:* Expanded from 51.8% in FY2023 to 62.3% in FY2025 before compressing in Q1 2026 due to product mix adjustments.
* Camera Motor Driver Chips: Generated $15.85 million (9.3% of revenue) in FY2025 and $2.31 million in Q1 2026 (down 22.1% YoY). Gross margins improved from 13.9% in FY2023 to 22.4% in FY2025, reflecting a transition from basic open-loop autofocus drivers to high-margin closed-loop and Optical Image Stabilization (OIS) architectures.
* NFC Chips & Others: Contributed $5.27 million in FY2025 and surged 107.3% YoY in Q1 2026 to $2.21 million, driven by electronic shelf label (ESL) penetration. However, gross margin fell from 45.0% in FY2023 to 20.2% in FY2025 due to competitive pricing.
Volume and Average Selling Price (ASP) Trends
* NVM Chips: Sales volume rose from 1,631.5 million units in FY2023 to 2,723.9 million units in FY2025, with ASP rising from $0.047 to $0.054. In Q1 2026, volume reached 862.0 million units, but ASP declined to $0.040 due to lower relative volumes of high-ASP SPD chips.
* Camera Motor Drivers: Volume reached 586.3 million units in FY2025 and 84.5 million units in Q1 2026, with ASP holding relatively stable ($0.029 in FY2023, $0.026 in FY2025, and recovering to $0.028 in Q1 2026).
* NFC & Others: Volume increased to 474.3 million units in FY2025 and 134.2 million units in Q1 2026, with ASP shifting from $0.019 (FY2023) to $0.011 (FY2025) and rebounding to $0.017 in Q1 2026.
Infrastructure Layout and Regional Moats
Giantec operates as a pure-play fabless IC design house. Its supply chain is highly concentrated, with the top 5 suppliers representing 85.0% of procurement in FY2025 and 81.9% in Q1 2026.
Supplier Topography and De-risking Initiatives
The firm has historically relied on Supplier A (a major, dual-listed Chinese foundry) for wafer fabrication. Recognizing this vulnerability, management has systematically diluted Supplier A's share of procurement from 53.9% in FY2023 to 43.8% in FY2025, and down to 34.8% in Q1 2026. This has been achieved by ramping up volume with Supplier C (onboarded in 2021, representing 14.4% of Q1 2026 procurement) and Supplier B (a Taiwan-based memory IC design and wafer provider onboarded in 2025, representing 17.0% of Q1 2026 procurement). Packaging and testing are outsourced to Tier-1 OSATs, including Supplier D (9.4% in Q1 2026) and Supplier E (6.3% in Q1 2026), both partners since 2009.
Client Ecosystem and Symbiotic Lock-In
Giantec’s commercial operations rely on a dual-track sales model (Direct Sales + Distributors). Accounts receivable turnover improved from 74 days in FY2023 to 42 days in FY2025, indicating high collection efficiency. Direct sales accounted for 48.6% of FY2025 revenue (driven by enterprise memory modules) while distribution stood at 60.2% in Q1 2026 (led by automotive and industrial components).
*Note: Customer A, a leading global data processing and interconnect IC design company based in Macao, operates in an exclusive cooperative arrangement with Giantec to co-develop DDR5 memory module solutions. This structural symbiosis limits customer switching capabilities.
Regional Distribution
Mainland China remains the primary market, contributing 46.5% ($78.97 million) of FY2025 revenue and rising to 54.2% ($21.11 million) in Q1 2026. The Hong Kong/Macao/Taiwan region represented 47.4% ($80.56 million) of FY2025 revenue, contracting to 39.5% ($15.38 million) in Q1 2026. South Korea accounted for 4.0% of FY2025 revenue ($6.73 million), while other overseas jurisdictions contributed 2.1% ($3.65 million).
IP Assets, R&D Pipeline, and H-Share IPO Proceeds Allocation
The company’s technology portfolio includes 80 globally granted patents (predominantly Chinese invention patents, with at least 6 critical invention patents registered in the United States, such as US8,482,980 B2 and US9,049,366 B2 covering memory array structures and reversible write protection), 83 IC layout design certificates, and 9 software copyrights.
Giantec’s R&D intensity remains high, with R&D expenses accounting for 17.0% of revenue in FY2025 and 23.8% ($9.28 million) in Q1 2026. All research costs are expensed as incurred, preserving conservative earnings figures. R&D personnel comprise 55.8% of the total workforce (196 out of 351 employees).
To sustain its technical moat, Giantec is utilizing its H-share IPO to fund a 6-year, $278.26 million (CNY 2,000 million) R&D capital expenditure program alongside a $23.00 million (CNY 165.3 million) supply chain globalization project.
* Yearly R&D Outlay Schedule: 2026: $10.27M | 2027: $42.61M (includes the $20.10M property acquisition) | 2028: $32.86M | 2029: $43.41M | 2030: $42.86M | 2031: $45.99M.
* China+N Supply Chain Outlay ($23.00M): Budgeted to establish localized QA, logistics, and warehouse nodes in Singapore and South Korea. In addition, the company plans to establish European operations, hiring approximately 10 senior design specialists with individual annual salaries ranging from $0.19 million to $0.77 million.
HDIN Institutional Verdict
An objective assessment of Giantec’s financial profile confirms its strong market position, but also highlights clear operational and governance factors that require ongoing monitoring.
The company's reliance on high-margin niches (such as DDR5 SPD and AEC-Q100 automotive EEPROMs) has shielded its margins from the pricing pressures seen in standard consumer electronics. Its partnership with Customer A acts as an exclusive pipeline into major DRAM producers, which helps mitigate customer concentration risks. Furthermore, its clean IP litigation record and the systematic reduction of its reliance on Supplier A (from 53.9% in FY2023 to 34.8% in Q1 2026) show disciplined risk management. Financially, Giantec has also reduced its reliance on direct government subsidies, which fell from 17.56% of net profit in FY2023 ($2.02 million) to 1.17% in Q1 2026 ($0.05 million).
Direct Policy Support Reliance (% of Net Profit)
2023 [████████████████████] 17.56% ($2.02M support / $11.51M Net Profit)
2024 [█████] 4.35% ($1.67M support / $38.41M Net Profit)
2025 [█] 1.19% ($0.59M support / $49.51M Net Profit)
Q126 [█] 1.17% ($0.05M support / $4.53M Net Profit)
However, some vulnerabilities remain:
* Working Capital and Inventory Inefficiencies: The cash conversion cycle remains high at 229 days in Q1 2026, driven by 241 inventory turnover days. This reflects strategic stockpiling to secure supply, but it exposes the company to obsolescence risks, as shown by the $4.31 million inventory write-down in FY2025.
* R&D Execution Risks: The proposed $278.26 million R&D plan represents a significant increase over past spending levels. This, combined with the $20.10 million Shanghai property purchase in 2027, will increase depreciation and amortization expenses, which may temporarily weigh on operating margins.
* Key-Man Governance Concerns: While Giantec's board has strong independent representation (4 of 7 members are independent non-executive directors), Chairman Chen Zuotao received a Warning Letter from the CSRC Beijing Bureau in April 2026. This warning related to delayed disclosures and unapproved transactions representing roughly 12% of net assets at another entity he controls (Tianhao Energy). While this does not disqualify him from serving under HKEX rules, it represents a governance factor that institutional investors should monitor.
Presentation Download & Video Access:
Presentation Download: Click the PDF download link under 'Related Topics' to access the full institutional presentation of this report.
Video Link: Click this link to watch the HDIN analyst briefing on YouTube.
About HDIN Research:
HDIN Research is a premier global market intelligence and strategic advisory firm specializing in institutional-grade financial analysis, supply chain audits, and macroeconomic forecasting. Our dedicated sector analysts deliver actionable, data-driven insights tailored for private equity, hedge funds, and corporate strategy teams. Visit us at http://www.hdinresearch.com.
2026 AI Transparency Footer:
"This intelligence report was authored by HDIN Research analysts following a rigorous audit of official corporate filings. AI was utilized for massive-scale data synthesis and structural drafting, ensuring 100% inclusion of reported data points. All strategic insights, financial modeling, and final verdicts were verified by our editorial board to ensure professional accuracy and compliance with 2026 Google Search E-E-A-T standards."
1. Giantec Semiconductor Corporation [SSE: 688123] has successfully pivoted its product portfolio toward high-barrier Non-Volatile Memory (NVM) architectures, securing a 40.5% global market share in JEDEC-compliant DDR5 SPD companion chips, effectively shielding its gross margins through structural price premiumization prior to Q1 2026.
2. The company is executing a $23.00 million (CNY 165.3 million) capital allocation to diversify its pure-play Fabless manufacturing footprint into Singapore and South Korea, directly addressing a historical 53.9% single-foundry procurement concentration risk.
3. Despite a pristine legal compliance record, institutional investors face a localized "key-man" governance discount following an April 2026 regulatory warning issued to Chairman Chen Zuotao by the CSRC Beijing Bureau regarding undisclosed transactions at another controlled entity.
Figure Giantec Semiconductor (H-Share lPO): Structural Growth, Product Portfolio Expansion & Financial Health Audit
Segmental Realities and Margin CompressionGiantec Semiconductor Corporation (Giantec) has demonstrated strong top-line expansion, with total revenue climbing from $97.87 million in FY2023 to $169.92 million in FY2025, representing a compound annual growth rate (CAGR) of 31.7%. Underpinning this growth is a highly calculated product mix shift toward high-margin enterprise and automotive verticals. Operating cash flow (OCF) reached $55.53 million in FY2025 against a Net Profit of $49.51 million (an OCF-to-Net Profit ratio of 1.12x), indicating high cash conversion quality and conservative accounting. Adjusted Net Profit expanded from $17.72 million in FY2023 to $54.01 million in FY2025, while calculated EBITDA grew from $14.66 million to $57.17 million over the same period.
However, Q1 2026 results reveal near-term headwinds. Total revenue reached $38.96 million (up 7.3% YoY), but Net Profit compressed to $4.53 million, and the net margin declined from 29.1% in FY2025 to 11.6% in Q1 2026. This contraction was driven by downstream DRAM/NAND packaging constraints that restricted high-margin SPD sales, alongside a spike in R&D and share-based compensation (SBC) expenses.
Revenue Decomposition and Gross Margin Trends by Product Line
* Non-Volatile Memory (NVM): This remains the primary revenue and margin engine, contributing 87.6% ($148.80 million) of FY2025 revenue and 88.4% ($34.44 million) of Q1 2026 revenue. Within NVM:
* SPD Chips: Revenue grew from $26.86 million in FY2023 to $66.22 million in FY2025 (representing a 40.5% global market share) but declined 28.3% YoY in Q1 2026 to $10.98 million due to downstream memory packaging bottlenecks.
* EEPROM: Revenue increased steadily from $48.75 million in FY2023 to $65.92 million in FY2025, and reached $15.04 million in Q1 2026 (up 2.5% YoY). Giantec maintains a 14.8% overall global EEPROM share (ranking 3), including a 40.4% share in Smartphone Camera EEPROM (1 globally), a 20.0% share in LCD Panel EEPROM (1), and a 4.7% share in Auto EEPROM (3).
* NOR Flash: Grew 281.9% YoY in Q1 2026 to $8.30 million (up from $16.42 million in FY2025 and $2.54 million in FY2023), driven by automotive design-ins.
* VPD & TS Chips: Commenced commercialization in FY2024 at $0.02 million, reaching $0.24 million in FY2025 and $0.11 million in Q1 2026.
* *NVM Segment Gross Margin:* Expanded from 51.8% in FY2023 to 62.3% in FY2025 before compressing in Q1 2026 due to product mix adjustments.
* Camera Motor Driver Chips: Generated $15.85 million (9.3% of revenue) in FY2025 and $2.31 million in Q1 2026 (down 22.1% YoY). Gross margins improved from 13.9% in FY2023 to 22.4% in FY2025, reflecting a transition from basic open-loop autofocus drivers to high-margin closed-loop and Optical Image Stabilization (OIS) architectures.
* NFC Chips & Others: Contributed $5.27 million in FY2025 and surged 107.3% YoY in Q1 2026 to $2.21 million, driven by electronic shelf label (ESL) penetration. However, gross margin fell from 45.0% in FY2023 to 20.2% in FY2025 due to competitive pricing.
Table: Multi-Year & Quarterly Segment Financial Metrics (FY2023–FY2025 & Q1 2025–Q1 2026)
| Segment Financial Metrics (USD Millions) | FY2023 | FY2024 | FY2025 | Q1 2025 | Q1 2026 |
| Total Revenue | $97.87 | $143.06 | $169.92 | $36.32 | $38.96 |
| Overall Gross Margin (%) | 46.6% | — | 57.3% | 60.3% | 48.9% |
| Net Profit | $11.51 | $38.41 | $49.51 | — | $4.53 |
| Adjusted Net Profit | $17.72 | — | $54.01 | — | — |
| Operating Cash Flow (OCF) | — | — | $55.53 | — | — |
| Cash Conversion Cycle (Days) | 268 | — | 225 | — | 229 |
| Inventory Turnover (Days) | 252 | 226 | 238 | — | 241 |
| Receivables Turnover (Days) | 74 | — | 42 | — | 47 |
| Inventory Write-downs (USD M) | $1.06 | — | $4.31 | — | — |
| Total Inventory (USD M) | — | — | — | — | ~$42.20 |
Volume and Average Selling Price (ASP) Trends
* NVM Chips: Sales volume rose from 1,631.5 million units in FY2023 to 2,723.9 million units in FY2025, with ASP rising from $0.047 to $0.054. In Q1 2026, volume reached 862.0 million units, but ASP declined to $0.040 due to lower relative volumes of high-ASP SPD chips.
* Camera Motor Drivers: Volume reached 586.3 million units in FY2025 and 84.5 million units in Q1 2026, with ASP holding relatively stable ($0.029 in FY2023, $0.026 in FY2025, and recovering to $0.028 in Q1 2026).
* NFC & Others: Volume increased to 474.3 million units in FY2025 and 134.2 million units in Q1 2026, with ASP shifting from $0.019 (FY2023) to $0.011 (FY2025) and rebounding to $0.017 in Q1 2026.
Infrastructure Layout and Regional Moats
Giantec operates as a pure-play fabless IC design house. Its supply chain is highly concentrated, with the top 5 suppliers representing 85.0% of procurement in FY2025 and 81.9% in Q1 2026.
Supplier Topography and De-risking Initiatives
The firm has historically relied on Supplier A (a major, dual-listed Chinese foundry) for wafer fabrication. Recognizing this vulnerability, management has systematically diluted Supplier A's share of procurement from 53.9% in FY2023 to 43.8% in FY2025, and down to 34.8% in Q1 2026. This has been achieved by ramping up volume with Supplier C (onboarded in 2021, representing 14.4% of Q1 2026 procurement) and Supplier B (a Taiwan-based memory IC design and wafer provider onboarded in 2025, representing 17.0% of Q1 2026 procurement). Packaging and testing are outsourced to Tier-1 OSATs, including Supplier D (9.4% in Q1 2026) and Supplier E (6.3% in Q1 2026), both partners since 2009.
Client Ecosystem and Symbiotic Lock-In
Giantec’s commercial operations rely on a dual-track sales model (Direct Sales + Distributors). Accounts receivable turnover improved from 74 days in FY2023 to 42 days in FY2025, indicating high collection efficiency. Direct sales accounted for 48.6% of FY2025 revenue (driven by enterprise memory modules) while distribution stood at 60.2% in Q1 2026 (led by automotive and industrial components).
Table: Customer Concentration, Revenue Contribution & Credit Terms Breakdown (FY2023–Q1 2026)
| Customer Segment (FY2023 - Q1 2026) | Procured Product | FY2023 Revenue | FY2024 Revenue | FY2025 Revenue | Q1 2026 Revenue | Credit Term |
| Customer A (Direct, Macao) | SPD Chips | $22.45M (22.9%) | $49.21M (34.4%) | $63.16M (37.2%) | $10.41M (26.7%) | 30 days |
| Customer B (Distributor) | Multi-category | — | $7.61M (5.3%) | $7.55M (4.4%) | $2.27M (5.8%) | 45 days |
| Customer C (Distributor) | Multi-category | — | — | — | $1.60M (4.1%) | 60 days |
| Customer D (Distributor) | Multi-category | — | — | — | $1.52M (3.9%) | 30 days |
| Customer E (Distributor) | Multi-category | — | — | $4.97M (2.9%) | $1.22M (3.1%) | 45 days |
| Customer F (Distributor) | Multi-category | $18.48M (18.9%) | $16.91M (11.8%) | $11.28M (6.6%) | — | 60 days |
| Customer G (Direct) | Multi-category | — | — | $7.43M (4.4%) | — | 60 days |
| Customer H (Distributor) | NFC / Consumer | $4.22M (4.3%) | $4.52M (3.2%) | — | — | 60 days |
| Customer I (Distributor) | Motor / Auto | $4.78M (4.9%) | $4.00M (2.8%) | — | — | 60 days |
Regional Distribution
Mainland China remains the primary market, contributing 46.5% ($78.97 million) of FY2025 revenue and rising to 54.2% ($21.11 million) in Q1 2026. The Hong Kong/Macao/Taiwan region represented 47.4% ($80.56 million) of FY2025 revenue, contracting to 39.5% ($15.38 million) in Q1 2026. South Korea accounted for 4.0% of FY2025 revenue ($6.73 million), while other overseas jurisdictions contributed 2.1% ($3.65 million).
IP Assets, R&D Pipeline, and H-Share IPO Proceeds Allocation
The company’s technology portfolio includes 80 globally granted patents (predominantly Chinese invention patents, with at least 6 critical invention patents registered in the United States, such as US8,482,980 B2 and US9,049,366 B2 covering memory array structures and reversible write protection), 83 IC layout design certificates, and 9 software copyrights.
Giantec’s R&D intensity remains high, with R&D expenses accounting for 17.0% of revenue in FY2025 and 23.8% ($9.28 million) in Q1 2026. All research costs are expensed as incurred, preserving conservative earnings figures. R&D personnel comprise 55.8% of the total workforce (196 out of 351 employees).
To sustain its technical moat, Giantec is utilizing its H-share IPO to fund a 6-year, $278.26 million (CNY 2,000 million) R&D capital expenditure program alongside a $23.00 million (CNY 165.3 million) supply chain globalization project.
Table: R&D Budget Allocation Breakdown ($278.26M Total Target, 2026–2031)
| R&D Expenditure Category | Planned Allocation ($M) | Budget Share (%) | Strategic Operational Scope |
| R&D Team Compensation | $113.80 | 40.9% | Talent acquisition & retention targeting ~100 new research & engineering hires. |
| Joint R&D with Third Parties | $64.40 | 23.1% | Collaborative technology development and strategic external partnerships. |
| Software & Reliability Testing Hardware | $26.80 | 9.6% | Capital commitment for advanced software stack, simulation, and testing equipment. |
| Property Purchase (Shanghai R&D Facility) | $20.10 | 7.2% | Physical infrastructure acquisition for the corporate Shanghai R&D center. |
| Remaining R&D Capital Reserves | $53.16 | 19.2% | Unallocated buffer reserved for future technology deployment and contingency. |
| Total Target Allocation | $278.26 | 100.0% | Comprehensive multi-year R&D investment roadmap (2026–2031). |
* Yearly R&D Outlay Schedule: 2026: $10.27M | 2027: $42.61M (includes the $20.10M property acquisition) | 2028: $32.86M | 2029: $43.41M | 2030: $42.86M | 2031: $45.99M.
* China+N Supply Chain Outlay ($23.00M): Budgeted to establish localized QA, logistics, and warehouse nodes in Singapore and South Korea. In addition, the company plans to establish European operations, hiring approximately 10 senior design specialists with individual annual salaries ranging from $0.19 million to $0.77 million.
HDIN Institutional Verdict
An objective assessment of Giantec’s financial profile confirms its strong market position, but also highlights clear operational and governance factors that require ongoing monitoring.
The company's reliance on high-margin niches (such as DDR5 SPD and AEC-Q100 automotive EEPROMs) has shielded its margins from the pricing pressures seen in standard consumer electronics. Its partnership with Customer A acts as an exclusive pipeline into major DRAM producers, which helps mitigate customer concentration risks. Furthermore, its clean IP litigation record and the systematic reduction of its reliance on Supplier A (from 53.9% in FY2023 to 34.8% in Q1 2026) show disciplined risk management. Financially, Giantec has also reduced its reliance on direct government subsidies, which fell from 17.56% of net profit in FY2023 ($2.02 million) to 1.17% in Q1 2026 ($0.05 million).
Direct Policy Support Reliance (% of Net Profit)
2023 [████████████████████] 17.56% ($2.02M support / $11.51M Net Profit)
2024 [█████] 4.35% ($1.67M support / $38.41M Net Profit)
2025 [█] 1.19% ($0.59M support / $49.51M Net Profit)
Q126 [█] 1.17% ($0.05M support / $4.53M Net Profit)
However, some vulnerabilities remain:
* Working Capital and Inventory Inefficiencies: The cash conversion cycle remains high at 229 days in Q1 2026, driven by 241 inventory turnover days. This reflects strategic stockpiling to secure supply, but it exposes the company to obsolescence risks, as shown by the $4.31 million inventory write-down in FY2025.
* R&D Execution Risks: The proposed $278.26 million R&D plan represents a significant increase over past spending levels. This, combined with the $20.10 million Shanghai property purchase in 2027, will increase depreciation and amortization expenses, which may temporarily weigh on operating margins.
* Key-Man Governance Concerns: While Giantec's board has strong independent representation (4 of 7 members are independent non-executive directors), Chairman Chen Zuotao received a Warning Letter from the CSRC Beijing Bureau in April 2026. This warning related to delayed disclosures and unapproved transactions representing roughly 12% of net assets at another entity he controls (Tianhao Energy). While this does not disqualify him from serving under HKEX rules, it represents a governance factor that institutional investors should monitor.
Presentation Download & Video Access:
Presentation Download: Click the PDF download link under 'Related Topics' to access the full institutional presentation of this report.
Video Link: Click this link to watch the HDIN analyst briefing on YouTube.
About HDIN Research:
HDIN Research is a premier global market intelligence and strategic advisory firm specializing in institutional-grade financial analysis, supply chain audits, and macroeconomic forecasting. Our dedicated sector analysts deliver actionable, data-driven insights tailored for private equity, hedge funds, and corporate strategy teams. Visit us at http://www.hdinresearch.com.
2026 AI Transparency Footer:
"This intelligence report was authored by HDIN Research analysts following a rigorous audit of official corporate filings. AI was utilized for massive-scale data synthesis and structural drafting, ensuring 100% inclusion of reported data points. All strategic insights, financial modeling, and final verdicts were verified by our editorial board to ensure professional accuracy and compliance with 2026 Google Search E-E-A-T standards."