Vantage Corp: Tri-Hub Asian M&A Expansion Near Singapore and Shanghai Hubs as Operating Losses Signal Short-Term Profitability Compression
Date : 2026-07-30
Reading : 87
HDIN Executive Takeaways
1. Vantage Corp's [NYSE American: Class A] aggressive pivot to an asset-heavy regional shipbroking structure compressed FY2026 gross margins to 41.5% and recorded an operating loss of $834,119.
2. Direct transaction reliance remains elevated, with spot freight commissions accounting for 75.6% of FY2026 revenue, leaving cash conversion highly sensitive to cyclical tanker freight rates.
3. Extreme voting power concentration, with five co-founders controlling 95.19% of voting rights, limits minority shareholder influence amidst acute NYSE American sub-$1.00 continued listing risks.
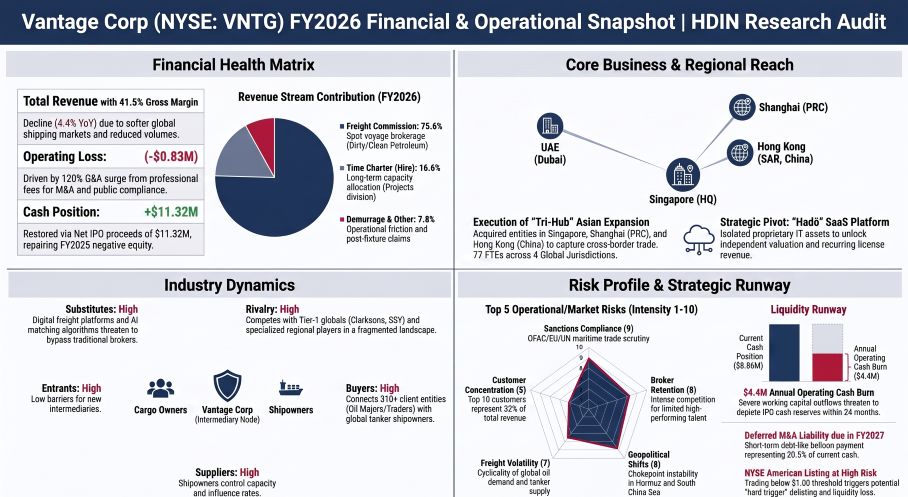
Figure Vantage Corp FY2026 Financial & Operational Snapshot
 Financial Realities and Structural Margin Compression
Vantage Corp [NYSE American: Class A] is undergoing a capital-intensive structural reorganization. Historically operating as a highly profitable, asset-light shipbroking intermediary, the company’s FY2026 financial performance was heavily impacted by three regional acquisitions in Asia and its public listing on the NYSE American.
This structural pivot generated significant margin contraction and cash outflows. Consolidated revenue fell 4.4% year-over-year in FY2026 to $17,837,611, driven by softer global freight rates and reduced transaction volumes. Concurrently, gross margins contracted from 47.2% in FY2024 to 41.5% in FY2026, while operating margins fell to negative 4.7%, generating an operating loss of $834,119 and a net loss of $1,316,670.
A primary operational challenge is the persistent disconnect between reported net income and operating cash flow (OCF). In FY2024, despite generating $4,954,484 in net income, OCF was negative $173,264 due to a $5,380,000 working capital outflow. This structural inefficiency recurred in FY2026, when a net loss of $1,316,670 was compounded into a negative OCF of $4,446,503. This was driven by a $4,300,000 working capital outflow, which included a $1,170,000 increase in accounts receivable and a $1,840,000 increase in prepaid professional and business consultancy fees.
The company's cost base has structurally shifted. In FY2026, General and Administrative (G&A) expenses rose 120.1% year-over-year to $6,150,000, driven by M&A advisory, SEC compliance costs, and expanding corporate infrastructure. Depreciation and Amortization (D&A) doubled to $598,516, primarily due to the amortization of newly acquired customer relationship intangible assets and capitalized lease renewals under ASC 842.
Capital structure adjustments were highly extractive prior to public listing. In FY2025, Vantage Corp declared an interim tax-exempt dividend of $11,849,995 to its controlling founders, which exhausted cash reserves and forced shareholders' equity into a negative $360,201 deficit. As of March 31, 2026, $4,385,829 of this dividend remains unpaid.
Furthermore, the company assumed $664,154 in dividend liabilities from its newly acquired PJ Marine entities, leading to a total balance sheet dividend liability of $5,049,983. In FY2026, the company recorded a cash outflow of $2,215,174 to service historical dividend commitments, while a portion ($774,720) was settled through an offset against amounts due from a director.
Balance sheet restoration in FY2026 was driven entirely by financing cash flows, with the company’s June 2025 IPO generating $11,320,000 in net proceeds (with gross capital market execution registering $13,260,000 in net proceeds in related filings). This transaction restored positive equity to $9,940,000 and lifted year-end cash to $8,861,768, offsetting the $4,446,503 operational cash burn.
While the company carries zero traditional bank debt, it maintains lease liabilities of $990,241 (current portion: $462,490, non-current portion: $527,751). The undiscounted future lease payments total $1,045,698, scheduled as $501,304 in FY2027; $466,623 in FY2028; and $77,771 in FY2029, discounted using an imputed interest rate of 5.01% over a weighted-average remaining term of 2.12 years.
Importantly, the company carries a short-term, non-interest-bearing deferred consideration payable of $1,818,031 due in FY2027 for the acquisitions of the PJ Marine entities, functioning as a near-term debt balloon on working capital.
Infrastructure Layout, Supply Chain, and Regional Footprint
Vantage Corp operates an asset-light transaction model as a maritime broker in the global liquid bulk and tanker markets. The company's commercial divisions are segmented into Dirty Petroleum Products (DPP) / Crude, Clean Petroleum Products (CPP), Petrochemicals, Biofuels and Vegetable Oils, and Projects (long-term time charters). However, financial reporting disaggregates revenue streams by commission types:
Vantage Corp’s physical real estate footprints are strictly leased. Its global headquarters in Singapore spans a 6,695 sq. ft. facility (expiring May 2028), complemented by a 790 sq. ft. office in Dubai, UAE (expiring April 2027) which serves as its Middle East operational hub. Geographic expansion into Houston, USA has been deferred to 2027 due to geopolitical volatility, while entry into Geneva, Switzerland remains under evaluation for late 2026.
To manage digital assets, the company incorporated Hadō Pte. Ltd. in February 2026, transferring all intellectual property (IP), personnel, and assets related to its proprietary, cloud-based operations software, OpsWiz, on July 1, 2026. This platform received historical financial support via an Enterprise Singapore tech grant of SGD 182,399 (approximately $139,608 USD).
The firm’s human capital structure consisted of 77 full-time employees as of March 31, 2026: 35 front-end brokers (46%), 21 operations and claims specialists (27%), and 21 back-office, IT, research, and corporate staff (27%). On a consolidated basis, headcount productivity generated approximately $231,657 in revenue per employee in FY2026. Qualified shipbrokers operate on high compensation baselines (frequently exceeding $300,000 in base salary) plus performance-linked bonuses, resulting in a variable cost structure where direct cost of revenue (primarily broker payroll and benefits) reached $10,420,000, or 58.4% of total revenue.
Vantage Corp maintains low client concentration risk with approximately 310 customer accounts, including producers, national oil companies, multinational oil majors, and trading houses. The top 10 customers accounted for 32% of FY2026 revenue, and no single client exceeded 10% of total revenue.
However, supplier concentration is elevated: the top two third-party vendors accounted for 20% and 9% of total commission expenses in FY2026. On the balance sheet, accounts payable are highly concentrated, with two vendors accounting for 44% and 19% of total accounts payable as of March 31, 2026, with the 44% portion inherited from the acquired entities.
The three acquisitions of the PJ Marine entities were completed between January and March 2026, structured with 50% upfront cash and 50% deferred cash considerations:
Post-acquisition, these entities collectively contributed $817,704 in revenue and $326,126 in net income to the consolidated results for the period ended March 31, 2026.
HDIN Institutional Verdict
The core shipbroking business of Vantage Corp faces cyclical headwinds, and its rapid regional expansion has introduced structural imbalances. While management's narrative emphasizes an asset-light, high-growth expansion into Greater China, 96% of the $4,370,000 in implied enterprise value across the three acquisitions was allocated to goodwill ($2,900,729) and finite-lived customer relationships ($1,305,324). Since the primary assets acquired are localized broker teams and their client books, any broker attrition or client loss presents an immediate risk of material asset impairment.
Furthermore, the company's liquidity runway is highly constrained. Although management states that current cash reserves are sufficient to cover operations for the next 12 months, the company's negative OCF of $4,446,503 in FY2026 contrasts sharply with its near-term cash claims. In FY2027, Vantage Corp faces $1,818,031 in deferred M&A considerations alongside a remaining dividend liability of $5,049,983.
If the FY2026 operating burn rate of $4,446,503 continues, the current cash balance of $8,861,768 will be insufficient to cover these combined commitments without requiring external debt financing or dilutive equity issuances.
The corporate governance structure remains highly centralized and unfavorable to minority investors. The five co-founders—Andresian D’Rozario, Ho Ying Keat Lowell, Francis Junior James, Randy Yong Choon Hong, and Quah Choong Hua—collectively hold 100% of the Class B shares (with 10 votes per share).
Consequently, despite public Class A shareholders owning 34.2% of the outstanding economic interest, the co-founders command 95.19% of the aggregate voting power. This "controlled company" structure isolates minority shareholders from influencing board elections, capital allocation, or corporate strategy.
In addition, the company's public market position is vulnerable. Underwriter warrants issued to Network 1 Financial Securities, Inc. for 186,875 shares are exercisable at $5.00 per share and expire in June 2030, presenting zero near-term dilution risk given the current sub-$1.00 share price. However, because the Class A shares trade below $1.00 with a market capitalization below $50 million, Vantage Corp faces an active risk of suspension and delisting under proposed NYSE American "hard trigger" compliance rules.
The execution of its $1,000,000 share repurchase program—which repurchased 754,379 shares for $749,424 by March 31, 2026, and was fully completed by June 30, 2026 (1,076,610 shares for $997,898)—represents an attempt to defend the stock price, but it further drains cash reserves that are critical for settling near-term liabilities.
Finally, while Audit Alliance LLP (PCAOB ID: 3487) issued an unqualified audit opinion for FY2026, the company’s Emerging Growth Company (EGC) status exempts it from the SOX Section 404(b) auditor attestation of internal controls over financial reporting (ICFR). Consequently, the market lacks independent validation regarding the effectiveness of the firm's financial controls, which is a key risk factor as the company attempts to integrate its newly acquired operations across mainland China, Hong Kong, and Singapore.
Presentation Download & Video Access:
- Presentation Download: Click the PDF download link under 'Related Topics' to access the full institutional presentation of this report.
- Video Link: Click this link to watch the HDIN analyst briefing on YouTube.
About HDIN Research:
HDIN Research is a premier global market intelligence and strategic advisory firm specializing in institutional-grade financial analysis, supply chain audits, and macroeconomic forecasting. Our dedicated sector analysts deliver actionable, data-driven insights tailored for private equity, hedge funds, and corporate strategy teams. Visit us at http://www.hdinresearch.com.
2026 AI Transparency Footer:
"This intelligence report was authored by HDIN Research analysts following a rigorous audit of official corporate filings. AI was utilized for massive-scale data synthesis and structural drafting, ensuring 100% inclusion of reported data points. All strategic insights, financial modeling, and final verdicts were verified by our editorial board to ensure professional accuracy and compliance with 2026 Google Search E-E-A-T standards."
1. Vantage Corp's [NYSE American: Class A] aggressive pivot to an asset-heavy regional shipbroking structure compressed FY2026 gross margins to 41.5% and recorded an operating loss of $834,119.
2. Direct transaction reliance remains elevated, with spot freight commissions accounting for 75.6% of FY2026 revenue, leaving cash conversion highly sensitive to cyclical tanker freight rates.
3. Extreme voting power concentration, with five co-founders controlling 95.19% of voting rights, limits minority shareholder influence amidst acute NYSE American sub-$1.00 continued listing risks.
Figure Vantage Corp FY2026 Financial & Operational Snapshot
Financial Realities and Structural Margin CompressionVantage Corp [NYSE American: Class A] is undergoing a capital-intensive structural reorganization. Historically operating as a highly profitable, asset-light shipbroking intermediary, the company’s FY2026 financial performance was heavily impacted by three regional acquisitions in Asia and its public listing on the NYSE American.
This structural pivot generated significant margin contraction and cash outflows. Consolidated revenue fell 4.4% year-over-year in FY2026 to $17,837,611, driven by softer global freight rates and reduced transaction volumes. Concurrently, gross margins contracted from 47.2% in FY2024 to 41.5% in FY2026, while operating margins fell to negative 4.7%, generating an operating loss of $834,119 and a net loss of $1,316,670.
Table: Consolidated Financial Metrics & Cash Flow Summary (FY2024–FY2026)
| Metric (in USD) | FY2024 | FY2025 | FY2026 |
| Revenue | 19,999,294 | 18,659,141 | 17,837,611 |
| Gross Profit | 9,438,528 | 8,614,739 | 7,410,389 |
| Operating Income (Loss) | 5,837,744 | 4,413,178 | (834,119) |
| Net Income (Loss) | 4,954,484 | 3,842,885 | (1,316,670) |
| EBITDA | 6,034,097 | 4,928,040 | (212,022) |
| Operating Cash Flow (OCF) | (173,264) | 1,895,161 | (4,446,503) |
| Capital Expenditures (Capex) | (36,855) | (126,455) | (213,445) |
| Free Cash Flow (FCF) | (210,119) | 1,768,706 | (4,659,948) |
| Cash & Cash Equivalents | 16,607,536 | 5,948,806 | 8,861,768 |
| Total Bank Debt | 0 | 0 | 0 |
| Working Capital | 7,429,894 | 890,834 | 5,058,244 |
Table: Key Financial Ratios & Performance Indicators (FY2024–FY2026)
| Key Financial Ratios | FY2024 | FY2025 | FY2026 |
| Gross Margin | 47.2% | 46.2% | 41.5% |
| Operating Margin | 29.2% | 23.7% | (4.7%) |
| Net Margin | 24.8% | 20.6% | (7.4%) |
| Return on Equity (ROE) | 64.9% | NM (Negative Equity) | (13.2%) |
| Current Ratio | 1.52x | 1.09x | 1.48x |
| Debt-to-Equity (Bank Debt) | 0.0x | 0.0x | 0.0x |
| FCF Conversion Rate | (4.2%) | 46.0% | NM (Negative FCF & NI) |
The company's cost base has structurally shifted. In FY2026, General and Administrative (G&A) expenses rose 120.1% year-over-year to $6,150,000, driven by M&A advisory, SEC compliance costs, and expanding corporate infrastructure. Depreciation and Amortization (D&A) doubled to $598,516, primarily due to the amortization of newly acquired customer relationship intangible assets and capitalized lease renewals under ASC 842.
Capital structure adjustments were highly extractive prior to public listing. In FY2025, Vantage Corp declared an interim tax-exempt dividend of $11,849,995 to its controlling founders, which exhausted cash reserves and forced shareholders' equity into a negative $360,201 deficit. As of March 31, 2026, $4,385,829 of this dividend remains unpaid.
Furthermore, the company assumed $664,154 in dividend liabilities from its newly acquired PJ Marine entities, leading to a total balance sheet dividend liability of $5,049,983. In FY2026, the company recorded a cash outflow of $2,215,174 to service historical dividend commitments, while a portion ($774,720) was settled through an offset against amounts due from a director.
Balance sheet restoration in FY2026 was driven entirely by financing cash flows, with the company’s June 2025 IPO generating $11,320,000 in net proceeds (with gross capital market execution registering $13,260,000 in net proceeds in related filings). This transaction restored positive equity to $9,940,000 and lifted year-end cash to $8,861,768, offsetting the $4,446,503 operational cash burn.
While the company carries zero traditional bank debt, it maintains lease liabilities of $990,241 (current portion: $462,490, non-current portion: $527,751). The undiscounted future lease payments total $1,045,698, scheduled as $501,304 in FY2027; $466,623 in FY2028; and $77,771 in FY2029, discounted using an imputed interest rate of 5.01% over a weighted-average remaining term of 2.12 years.
Importantly, the company carries a short-term, non-interest-bearing deferred consideration payable of $1,818,031 due in FY2027 for the acquisitions of the PJ Marine entities, functioning as a near-term debt balloon on working capital.
Infrastructure Layout, Supply Chain, and Regional Footprint
Vantage Corp operates an asset-light transaction model as a maritime broker in the global liquid bulk and tanker markets. The company's commercial divisions are segmented into Dirty Petroleum Products (DPP) / Crude, Clean Petroleum Products (CPP), Petrochemicals, Biofuels and Vegetable Oils, and Projects (long-term time charters). However, financial reporting disaggregates revenue streams by commission types:
Table: Revenue Stream Breakdown & Business Segment Mapping (FY2026)
| Revenue Stream | FY2026 Revenue (USD) | % of Total | Business Line / Segment Mapping |
| Freight Commission | $13,491,801 | 75.6% | Voyage charters across DPP, CPP, Petrochemicals, and Biofuels |
| Time Charter (Hire) Commission | $2,965,316 | 16.6% | Projects division (long-term charters of 6 months to 3 years) |
| Demurrage Commission | $1,226,694 | 6.9% | Post-fixture operational support and claims resolution |
| Deviation & Other Commission | $153,800 | 0.9% | Ad-hoc operational adjustments and advisory |
| Sale of Vessel Commission | $0 | 0.0% | S&P brokerage ($450,000 in FY2025, but zero in FY2026) |
| IT Solutions (SaaS) | Pre-revenue | N/A | OpsWiz platform; monetization expected by late 2026 |
| Total Revenue | $17,837,611 | 100.0% |
Table: Corporate Legal Structure & Subsidiary Holdings Overview
| Entity Name | Jurisdiction | Ownership | Principal Activity |
| Vantage Corp | Cayman Islands | Parent | Ultimate Holding Company |
| Vantage (BVI) Corporation | British Virgin Islands | 100% | Intermediate Holding Company |
| Vantage Shipbrokers Pte. Ltd. | Singapore | 100% | Core Ship Broking Services |
| Vantage Nexus Commercial Brokers Co L.L.C. | United Arab Emirates | 100% | Middle East Commercial Brokerage |
| Hadō Pte. Ltd. | Singapore | 100% | IT Services (OpsWiz commercialization) |
| PJ Marine Singapore Pte. Ltd. | Singapore | 100% | Ship Broking Services (Acquired Jan 2026) |
| Peijun Marine Consultant Co., Ltd. | Hong Kong, China | 60% | Ship Broking Services (Acquired Jan 2026) |
| PJ Marine Shanghai Co., Ltd. | China | 60% | Ship Broking Services (Acquired Mar 2026) |
To manage digital assets, the company incorporated Hadō Pte. Ltd. in February 2026, transferring all intellectual property (IP), personnel, and assets related to its proprietary, cloud-based operations software, OpsWiz, on July 1, 2026. This platform received historical financial support via an Enterprise Singapore tech grant of SGD 182,399 (approximately $139,608 USD).
The firm’s human capital structure consisted of 77 full-time employees as of March 31, 2026: 35 front-end brokers (46%), 21 operations and claims specialists (27%), and 21 back-office, IT, research, and corporate staff (27%). On a consolidated basis, headcount productivity generated approximately $231,657 in revenue per employee in FY2026. Qualified shipbrokers operate on high compensation baselines (frequently exceeding $300,000 in base salary) plus performance-linked bonuses, resulting in a variable cost structure where direct cost of revenue (primarily broker payroll and benefits) reached $10,420,000, or 58.4% of total revenue.
Vantage Corp maintains low client concentration risk with approximately 310 customer accounts, including producers, national oil companies, multinational oil majors, and trading houses. The top 10 customers accounted for 32% of FY2026 revenue, and no single client exceeded 10% of total revenue.
However, supplier concentration is elevated: the top two third-party vendors accounted for 20% and 9% of total commission expenses in FY2026. On the balance sheet, accounts payable are highly concentrated, with two vendors accounting for 44% and 19% of total accounts payable as of March 31, 2026, with the 44% portion inherited from the acquired entities.
The three acquisitions of the PJ Marine entities were completed between January and March 2026, structured with 50% upfront cash and 50% deferred cash considerations:
Table: M&A Purchase Price Allocation (PPA) & Goodwill Recognition Summary (in USD)
| Target Entity | Equity Acquired | Total Consideration (Fair Value) | Non-Controlling Interest (Fair Value) | Net Tangible Assets | Customer Intangibles | Deferred Tax Liability | Recognized Goodwill |
| PJ Marine Singapore | 100% | $1,759,032 | — | $78,315 | $737,757 | $(125,419) | $1,068,379 |
| Peijun Marine (Hong Kong) | 60% | $461,111 | $307,407 | $90 | $412,655 | $(68,088) | $423,861 |
| PJ Marine Shanghai (PRC) | 60% | $1,111,161 | $740,774 | $327,262 | $154,912 | $(38,728) | $1,408,489 |
| Total | — | $3,331,304 | $1,048,181 | $405,667 | $1,305,324 | $(232,235) | $2,900,729 |
Post-acquisition, these entities collectively contributed $817,704 in revenue and $326,126 in net income to the consolidated results for the period ended March 31, 2026.
HDIN Institutional Verdict
The core shipbroking business of Vantage Corp faces cyclical headwinds, and its rapid regional expansion has introduced structural imbalances. While management's narrative emphasizes an asset-light, high-growth expansion into Greater China, 96% of the $4,370,000 in implied enterprise value across the three acquisitions was allocated to goodwill ($2,900,729) and finite-lived customer relationships ($1,305,324). Since the primary assets acquired are localized broker teams and their client books, any broker attrition or client loss presents an immediate risk of material asset impairment.
Furthermore, the company's liquidity runway is highly constrained. Although management states that current cash reserves are sufficient to cover operations for the next 12 months, the company's negative OCF of $4,446,503 in FY2026 contrasts sharply with its near-term cash claims. In FY2027, Vantage Corp faces $1,818,031 in deferred M&A considerations alongside a remaining dividend liability of $5,049,983.
If the FY2026 operating burn rate of $4,446,503 continues, the current cash balance of $8,861,768 will be insufficient to cover these combined commitments without requiring external debt financing or dilutive equity issuances.
The corporate governance structure remains highly centralized and unfavorable to minority investors. The five co-founders—Andresian D’Rozario, Ho Ying Keat Lowell, Francis Junior James, Randy Yong Choon Hong, and Quah Choong Hua—collectively hold 100% of the Class B shares (with 10 votes per share).
Consequently, despite public Class A shareholders owning 34.2% of the outstanding economic interest, the co-founders command 95.19% of the aggregate voting power. This "controlled company" structure isolates minority shareholders from influencing board elections, capital allocation, or corporate strategy.
Table: Capital Structure & Voting Power Breakdown
| Equity Class / Instrument | Issued Shares | Outstanding Shares | Voting Rights | % of Total Voting Power |
| Class A Ordinary Shares | 11,371,120 | 10,616,741 | 1 vote per share | 4.81% |
| Class B Ordinary Shares | 20,366,380 | 20,366,380 | 10 votes per share | 95.19% |
| Treasury Shares (Class A) | 754,379 | 0 | None | 0.00% |
| Underwriter Warrants | 186,875 | 0 | Unexercised | 0.00% |
In addition, the company's public market position is vulnerable. Underwriter warrants issued to Network 1 Financial Securities, Inc. for 186,875 shares are exercisable at $5.00 per share and expire in June 2030, presenting zero near-term dilution risk given the current sub-$1.00 share price. However, because the Class A shares trade below $1.00 with a market capitalization below $50 million, Vantage Corp faces an active risk of suspension and delisting under proposed NYSE American "hard trigger" compliance rules.
The execution of its $1,000,000 share repurchase program—which repurchased 754,379 shares for $749,424 by March 31, 2026, and was fully completed by June 30, 2026 (1,076,610 shares for $997,898)—represents an attempt to defend the stock price, but it further drains cash reserves that are critical for settling near-term liabilities.
Finally, while Audit Alliance LLP (PCAOB ID: 3487) issued an unqualified audit opinion for FY2026, the company’s Emerging Growth Company (EGC) status exempts it from the SOX Section 404(b) auditor attestation of internal controls over financial reporting (ICFR). Consequently, the market lacks independent validation regarding the effectiveness of the firm's financial controls, which is a key risk factor as the company attempts to integrate its newly acquired operations across mainland China, Hong Kong, and Singapore.
Presentation Download & Video Access:
- Presentation Download: Click the PDF download link under 'Related Topics' to access the full institutional presentation of this report.
- Video Link: Click this link to watch the HDIN analyst briefing on YouTube.
About HDIN Research:
HDIN Research is a premier global market intelligence and strategic advisory firm specializing in institutional-grade financial analysis, supply chain audits, and macroeconomic forecasting. Our dedicated sector analysts deliver actionable, data-driven insights tailored for private equity, hedge funds, and corporate strategy teams. Visit us at http://www.hdinresearch.com.
2026 AI Transparency Footer:
"This intelligence report was authored by HDIN Research analysts following a rigorous audit of official corporate filings. AI was utilized for massive-scale data synthesis and structural drafting, ensuring 100% inclusion of reported data points. All strategic insights, financial modeling, and final verdicts were verified by our editorial board to ensure professional accuracy and compliance with 2026 Google Search E-E-A-T standards."