Astroscale Holdings Inc.: Localized CAPEX Pivot to United States Facilities as $253.65M Backlog Signals Post-R&D Commercialization Transition
Date : 2026-07-31
Reading : 293
HDIN Market Intelligence Brief
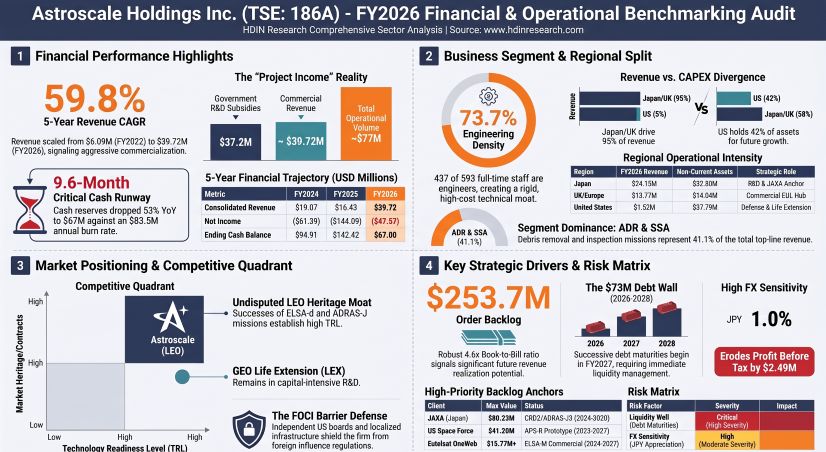
1. Astroscale Holdings Inc. [TYO: 186A] faces a compressed 9.6-month cash runway based on an annualized operating burn of $83.48M, requiring imminent capital restructuring or drawdown of its new $66.86M credit facility.
2. The company is strategically bypassing U.S. Foreign Ownership (FOCI) barriers, allocating 42.2% of non-current physical assets ($37.79M) to localized U.S. facilities to capture classified defense contracts.
3. Operational volume is highly subsidized; sovereign R&D grants accounted for $37.21M of non-IFRS project income in FY2026, offsetting core engineering cash bleed.
Figure Astroscale Holdings Inc FY2026 Financial & Operational Benchmarking Audit
 Segmental Realities and Margin Compression
Astroscale Holdings Inc. remains in a pre-profitability growth cycle characterized by heavy capital deployment into Rendezvous and Proximity Operations (RPO) technologies. Consolidated revenues for FY2026 reached $39.72M, representing a 141.8% year-over-year expansion from $16.43M in FY2025 and a 59.8% 5-year Compound Annual Growth Rate (CAGR) from the FY2022 baseline of $6.09M. Despite top-line acceleration, the company posted an operating loss of $66.69M and a net loss of $47.57M in FY2026. This represents a managed recovery from the net loss of $144.09M recorded in FY2025, driven primarily by a reduction in Research & Development (R&D) intensity from 444.5% of revenue ($73.03M) in FY2025 to 126.8% of revenue ($50.37M) in FY2026.
*All financial figures translated from JPY to USD at the fixed FY2026 baseline rate of 1 USD = 149.5686 JPY
DuPont Analysis ROE Decomposition
The DuPont decomposition highlights the severe systemic impacts of pre-profitability scaling. The Return on Equity (ROE) recovered from -351.8% in FY2025 to -92.9% in FY2026, primarily due to net margin improvement and asset turnover efficiency gains, offset by high balance sheet leverage.
Balance Sheet, Debt Architecture, and Liquidity Risk
Astroscale Holdings Inc. is operating with highly compressed liquidity. Ending cash balances declined 53.0% year-over-year to $67.00M in FY2026. Set against an annualized operating cash burn rate of $83.48M, the standalone cash runway is restricted to 9.6 months.
* Net Working Capital (NWC): Current assets of $120.56M juxtaposed against current liabilities of $114.38M yield a thin NWC buffer of $6.18M.
* Total Outstanding Debt: Total leverage stands at $46.23M, divided into $31.68M in short-term debt and $14.54M in long-term debt.
* Subordinated Debt Facilities: Cumulative subordinated loan agreements total $53.50M (comprising facilities of $33.43M / JPY 5.0B and $20.06M / JPY 3.0B). The $13.37M (JPY 2.0B) subordinated loan executed in 2024 carries strict EBITDA performance covenants.
* Financing Commitment: To mitigate liquidity risk, the company secured a post-balance-sheet financing program of $66.86M (JPY 10.0B) with Morgan Stanley & Co. International plc and Mizuho International plc, spanning 2026 through 2029.
Scheduled Debt Maturities (Next 1–4 Years)
* FY2027 Maturity (Due 2026): Repayment of $20.06M (JPY 3.0B) facility.
* FY2028 Maturity (Due 2027): Repayment of $33.43M (JPY 5.0B) facility.
* FY2029 Maturity (Due 2028): Repayment of $20.06M (JPY 3.0B) facility.
* FY2030 Maturity (Due 2029): Repayment of $13.37M (JPY 2.0B) subordinated loan.
Segmental and Project Revenue Decomposition
Under IFRS guidelines, Astroscale Holdings Inc. reports under a single segment ("On-Orbit Services"). A forensic reconstruction of the FY2026 revenue distribution across core technological pillars reveals high concentration risk, with the top three clients generating 60.4% ($23.96M) of total recognized revenue.
* Active Debris Removal / Space Situational Awareness (ADR / ISSA): Generated ~$16.30M (41.1% of total top-line). Anchored by the Japan Aerospace Exploration Agency (JAXA) ADRAS-J project ($11.67M / 29.4% of total revenue) and the UK Space Agency (UKSA/DSIT) COSMIC program ($4.63M / 11.7% of total revenue).
* End-of-Life (EOL): Generated ~$7.66M (19.3% of total top-line). Anchored by the Eutelsat OneWeb [PAR: ETL] ELSA-M program ($7.66M / 19.3% of total revenue).
* Life Extension (LEX): Pre-commercial and milestone-based (largely absorbed in R&D grants and unrecognized backlog, including the U.S. Space Force APS-R program).
* Other / Long-tail: Generated ~$15.76M (39.6% of total top-line) across a fragmented client base of sub-system sales and early engineering studies.
Bifurcated Revenue Architecture and Subsidy Inflow
The company operates a dual-engine financial model. While recognized IFRS revenue stood at $39.72M, government R&D subsidies are classified below the Gross Profit line as "Other Income." Total Other Income was $41.46M (JPY 6.20B) in FY2026, of which pure Subsidy Income represented $37.21M (JPY 5.56B).
* SBIR Phase 3 (ISSA-J1): Contributed $30.44M (JPY 4.55B) out of a maximum project delivery cap of $80.23M (JPY 12.0B) / $54.76M subsidy cap, leaving the remainder deferred into FY2027/FY2028.
* JST K Program (REFLEX-J): Contributed $7.10M (JPY 1.06B) out of a maximum $72.38M grant spanning 2025–2030.
* True Operational Volume: The combined Project Income (recognized revenue plus subsidy capital) reached $76.93M in FY2026.
Order Book and Execution Dynamics
Astroscale Holdings Inc. secured $183.43M (JPY 27.43B) in new formalized contract orders in FY2026. This brought the total outstanding backlog to $253.65M (JPY 37.93B) as of April 30, 2026.
* Book-to-Bill Ratio: Calculated at ~4.6x ($183.43M new orders divided by $39.72M recognized revenue), indicating robust pipeline visibility.
* Revenue Deferral Vectors: Conversion of the backlog remains highly sensitive to third-party launch timelines and fixed-price Milestone Payment schedules. Milestone contracts include JAXA’s CRD2/ADRAS-J2 (maximum value of $80.23M contracted for 2024–2029), Eutelsat OneWeb Sunrise/ELSA-M (base value of $15.77M / €13.95M contracted for 2024–2027), and the U.S. Space Force/NSTXL APS-R Life Extension contract ($41.20M contracted for 2023–2027, of which $20.89M was recognized in FY2026).
Macro-Currency Insulation Effects
The depreciated Japanese Yen (JPY) served as a critical non-operating financial cushion in FY2026. The company recorded a Foreign Exchange Gain of $24.41M (JPY 3.65B) under Financial Income, reversing the $14.58M (JPY 2.18B) FX loss suffered in FY2025.
* Balance Sheet Exposure: At FY2026 year-end, the company held foreign currency exposures of $82.04M (JPY 12.27B) in USD and $13.14M (JPY 1.96B) in GBP.
* FX Sensitivity Model: A 1.0% appreciation of the JPY against major operating currencies directly erodes Profit Before Tax by $2.49M (JPY 372.15M).
Infrastructure Layout and Regional Moats
Astroscale Holdings Inc. operates a highly localized contracting structure designed to navigate sovereign procurement requirements and Foreign Ownership, Control, or Influence (FOCI) regulations.
Geographic Matrix: FY2026 Revenue vs. Non-Current Assets
The allocation of physical capital diverges sharply from current regional monetization, highlighting a forward-leaning investment strategy in the United States defense market.
Manufacturing Facility Matrix
* Tokyo, Japan (Global HQ): Satellite Assembly & Integration Facility opened in May 2023. Custom-builds flagship sovereign platforms (ADRAS-J, ELSA-d).
* Harwell, United Kingdom: "Zeus" Assembly & Integration Facility opened in September 2022. Services the ELSA-M (OneWeb) and COSMIC (UKSA) programs. Tangible fixed assets (Property, Plant, and Equipment) stand at $6.51M (JPY 974.15M).
* Denver, Huntsville, and El Paso, United States: Dedicated defense-contracting hub carrying a tangible fixed asset base of $37.52M (JPY 5.61B). Crucially, $34.48M (JPY 5.15B) of this capital is classified as "construction in progress," indicating massive, uncompleted assembly infrastructure intended for classified U.S. Space Force and Department of Defense (DoD) contracts.
* Tel Aviv, Israel: Specialized R&D center inherited via the 2020 acquisition of Effective Space Solutions, dedicated exclusively to the engineering of Life Extension (LEX) propulsion systems.
* Toulouse, France: Regional node established in February 2025 targeting European Space Agency (ESA) and CNES projects.
Launch Provider and Supply Chain Dependencies
The company lacks independent launch capabilities and relies entirely on external partners to execute orbital placements, rendering revenue recognition under the Percentage of Completion (PoC) method vulnerable to launch manifest volatility.
* Core Launch Partners: Rocket Lab [NASDAQ: RKLB] (successfully deployed ADRAS-J on an Electron vehicle on February 18, 2024); NewSpace India Limited (ISRO), contracted for the ISSA-J1 mission in 2025 on a PSLV launcher; and Isar Aerospace SE, contracted for European launches starting in 2026.
* Procurement Bottlenecks: Upstream subsystem integration relies on specialized European and domestic vendors, including space-logistics firm Exotrail. Capped, fixed-price sovereign contracts expose Astroscale's gross margins to component cost inflation and specialized material shortages.
Human Capital Allocation
As an engineering-heavy manufacturer, human capital represents the company's largest structural cost center.
* Total Headcount: 593 full-time employees and 41 contract workers.
* Engineering Density: 437 employees are strictly allocated to engineering roles, yielding an Engineering Density Ratio of 73.7%.
* Average Salaries and Tenures:
* Astroscale Holdings HQ (31 employees): Average age of 44.6 years; average tenure of 3.2 years; average annual salary of $88,407 (JPY 13.22M).
* Astroscale Japan (198 employees): Average age of 42.4 years; average tenure of 2.5 years; average annual salary of $57,090 (JPY 8.53M).
Technology Readiness and Intellectual Property Moat
* Deployed Orbital Flight Heritage: ELSA-d (launched March 2021 into 550km LEO) verified end-to-end magnetic capture. ADRAS-J (launched February 18, 2024) achieved a global-first milestone by executing non-cooperative, unprepared H-IIA rocket upper stage rendezvous, approaching and holding an observation point at 50 meters under relative optical navigation.
* Development Pipeline: ELSA-M (Phase C/D manufacturing) for commercial constellation disposal; COSMIC (Phase B/C design) for UK defunct satellite removal; APS-R (U.S. Space Force refueling prototype) scheduled for 2027 delivery.
* IP Strategy: Focuses on proprietary 6-stage RPO autonomous relative navigation algorithms (using optical sensors and LiDAR without cooperative beacons) and standardized Generation 2 Magnetic Docking Plates. Standardizing these docking plates across commercial LEO constellations acts as a defensive lock-in mechanism. Aerospace quality assurance is maintained under AS/EN/JIS Q 9100 standards.
* Strategic Capital Alliances: Executed a third-party share allotment to satellite operator SKY Perfect JSAT, issuing 462,600 shares at 1,729 JPY per share to secure a capital injection of $5.35M (JPY 799.83M), linking a major customer directly to the equity structure.
HDIN Institutional Verdict
Management’s operational narrative emphasizes a rapid transition from R&D to commercialization, pointing to the 141.8% surge in top-line IFRS revenue and the successful uncooperative proximity maneuvers of the ADRAS-J mission. However, a forensic look at the financials reveals that the business remains structurally dependent on sovereign subsidies and favorable foreign exchange adjustments.
Stripping away the non-operating $24.41M FX paper gain reveals a cash-bleeding core. Operating cash flow remains deeply negative at -$83.48M. When measured against an ending cash balance of $67.00M and a razor-thin Net Working Capital of $6.18M, Astroscale's standalone survival is mathematically bound to immediate capital events. The company faces a looming "debt wall," with $73.55M in standard and subordinated loans maturing between FY2027 and FY2029. Management must either rapidly draw down on its newly established $66.86M Morgan Stanley/Mizuho credit facility—further leveraging the balance sheet—or execute dilutive public equity offerings.
Furthermore, the company's business model is constrained by the "Bespoke Trap." Operating primarily on a project-milestone basis (Phases A through F) for sovereign space agencies, its revenue is recognized via the Percentage of Completion (PoC) method. This ties margin expansion to engineering man-hours and customized spacecraft design rather than standardized, mass-manufactured satellite buses. While the $253.65M backlog is high quality with near-zero counterparty default risk (backed by JAXA, USSF, and Eutelsat), its conversion to cash is structurally delayed by both internal engineering timelines and external launch provider manifests.
Lastly, the massive capital expenditure mismatch in the United States represents a high-stakes strategic gamble. The U.S. subsidiary holds 42.2% ($37.79M) of the company's total physical asset base—including $34.48M locked in "construction in progress"—yet generated only 3.8% ($1.52M) of FY2026 revenue. Management is intentionally over-building FOCI-mitigated, highly localized manufacturing centers in Denver and Huntsville to bypass defense-security barriers. If the U.S. Space Force or domestic defense intelligence agencies delay or downscale upcoming classified life-extension or space situational awareness contracts, Astroscale will be left holding heavily underutilized, highly depreciating physical infrastructure, severely damaging future returns on equity.
Presentation Download & Video Access:
Presentation Download: Click the PDF download link under 'Related Topics' to access the full institutional presentation of this report.
Video Link: Click this link to watch the HDIN analyst briefing on YouTube.
About HDIN Research:
HDIN Research is a premier global market intelligence and strategic advisory firm specializing in institutional-grade financial analysis, supply chain audits, and macroeconomic forecasting. Our dedicated sector analysts deliver actionable, data-driven insights tailored for private equity, hedge funds, and corporate strategy teams. Visit us at http://www.hdinresearch.com.
2026 AI Transparency Footer:
"This intelligence report was authored by HDIN Research analysts following a rigorous audit of official corporate filings. AI was utilized for massive-scale data synthesis and structural drafting, ensuring 100% inclusion of reported data points. All strategic insights, financial modeling, and final verdicts were verified by our editorial board to ensure professional accuracy and compliance with 2026 Google Search E-E-A-T standards."
1. Astroscale Holdings Inc. [TYO: 186A] faces a compressed 9.6-month cash runway based on an annualized operating burn of $83.48M, requiring imminent capital restructuring or drawdown of its new $66.86M credit facility.
2. The company is strategically bypassing U.S. Foreign Ownership (FOCI) barriers, allocating 42.2% of non-current physical assets ($37.79M) to localized U.S. facilities to capture classified defense contracts.
3. Operational volume is highly subsidized; sovereign R&D grants accounted for $37.21M of non-IFRS project income in FY2026, offsetting core engineering cash bleed.
Figure Astroscale Holdings Inc FY2026 Financial & Operational Benchmarking Audit
Segmental Realities and Margin CompressionAstroscale Holdings Inc. remains in a pre-profitability growth cycle characterized by heavy capital deployment into Rendezvous and Proximity Operations (RPO) technologies. Consolidated revenues for FY2026 reached $39.72M, representing a 141.8% year-over-year expansion from $16.43M in FY2025 and a 59.8% 5-year Compound Annual Growth Rate (CAGR) from the FY2022 baseline of $6.09M. Despite top-line acceleration, the company posted an operating loss of $66.69M and a net loss of $47.57M in FY2026. This represents a managed recovery from the net loss of $144.09M recorded in FY2025, driven primarily by a reduction in Research & Development (R&D) intensity from 444.5% of revenue ($73.03M) in FY2025 to 126.8% of revenue ($50.37M) in FY2026.
Table: Multi-Year Financial Performance & Key Ratios Overview (FY2022–FY2026)
| Metric | FY2022 | FY2023 | FY2024 | FY2025 | FY2026 |
| Revenue ($M) | 6.09 | 11.99 | 19.07 | 16.43 | 39.72 |
| Operating Profit ($M) | N/A | N/A | N/A | -125.39 | -66.69 |
| Net Income ($M) | -36.67 | -61.94 | -61.39 | -144.09 | -47.57 |
| Net Margin (%) | -602.4% | -516.7% | -321.9% | -877.2% | -119.8% |
| R&D Expenditure ($M) | N/A | N/A | N/A | 73.03 | 50.37 |
| R&D Intensity (% of Rev) | N/A | N/A | N/A | 444.5% | 126.8% |
| Operating Cash Flow ($M) | -36.78 | -53.98 | -85.73 | -81.91 | -83.48 |
| Ending Cash Balance ($M) | 112.78 | 151.63 | 94.91 | 142.42 | 67.00 |
DuPont Analysis ROE Decomposition
The DuPont decomposition highlights the severe systemic impacts of pre-profitability scaling. The Return on Equity (ROE) recovered from -351.8% in FY2025 to -92.9% in FY2026, primarily due to net margin improvement and asset turnover efficiency gains, offset by high balance sheet leverage.
Table: DuPont Analysis Component Breakdown & ROE Dynamics (FY2022–FY2026)
| DuPont Component | FY2022 | FY2023 | FY2024 | FY2025 | FY2026 |
| Net Profit Margin (%) | -602.4% | -516.7% | -321.9% | -877.2% | -119.8% |
| Asset Turnover (x) | 0.05 | 0.06 | 0.11 | 0.07 | 0.18 |
| Equity Multiplier (Leverage, x) | 1.43 | 2.04 | 4.63 | 5.49 | 4.19 |
| Return on Equity (ROE, %) | -38.9% | -62.2% | -170.0% | -351.8% | -92.9% |
Balance Sheet, Debt Architecture, and Liquidity Risk
Astroscale Holdings Inc. is operating with highly compressed liquidity. Ending cash balances declined 53.0% year-over-year to $67.00M in FY2026. Set against an annualized operating cash burn rate of $83.48M, the standalone cash runway is restricted to 9.6 months.
* Net Working Capital (NWC): Current assets of $120.56M juxtaposed against current liabilities of $114.38M yield a thin NWC buffer of $6.18M.
* Total Outstanding Debt: Total leverage stands at $46.23M, divided into $31.68M in short-term debt and $14.54M in long-term debt.
* Subordinated Debt Facilities: Cumulative subordinated loan agreements total $53.50M (comprising facilities of $33.43M / JPY 5.0B and $20.06M / JPY 3.0B). The $13.37M (JPY 2.0B) subordinated loan executed in 2024 carries strict EBITDA performance covenants.
* Financing Commitment: To mitigate liquidity risk, the company secured a post-balance-sheet financing program of $66.86M (JPY 10.0B) with Morgan Stanley & Co. International plc and Mizuho International plc, spanning 2026 through 2029.
Scheduled Debt Maturities (Next 1–4 Years)
* FY2027 Maturity (Due 2026): Repayment of $20.06M (JPY 3.0B) facility.
* FY2028 Maturity (Due 2027): Repayment of $33.43M (JPY 5.0B) facility.
* FY2029 Maturity (Due 2028): Repayment of $20.06M (JPY 3.0B) facility.
* FY2030 Maturity (Due 2029): Repayment of $13.37M (JPY 2.0B) subordinated loan.
Segmental and Project Revenue Decomposition
Under IFRS guidelines, Astroscale Holdings Inc. reports under a single segment ("On-Orbit Services"). A forensic reconstruction of the FY2026 revenue distribution across core technological pillars reveals high concentration risk, with the top three clients generating 60.4% ($23.96M) of total recognized revenue.
* Active Debris Removal / Space Situational Awareness (ADR / ISSA): Generated ~$16.30M (41.1% of total top-line). Anchored by the Japan Aerospace Exploration Agency (JAXA) ADRAS-J project ($11.67M / 29.4% of total revenue) and the UK Space Agency (UKSA/DSIT) COSMIC program ($4.63M / 11.7% of total revenue).
* End-of-Life (EOL): Generated ~$7.66M (19.3% of total top-line). Anchored by the Eutelsat OneWeb [PAR: ETL] ELSA-M program ($7.66M / 19.3% of total revenue).
* Life Extension (LEX): Pre-commercial and milestone-based (largely absorbed in R&D grants and unrecognized backlog, including the U.S. Space Force APS-R program).
* Other / Long-tail: Generated ~$15.76M (39.6% of total top-line) across a fragmented client base of sub-system sales and early engineering studies.
Bifurcated Revenue Architecture and Subsidy Inflow
The company operates a dual-engine financial model. While recognized IFRS revenue stood at $39.72M, government R&D subsidies are classified below the Gross Profit line as "Other Income." Total Other Income was $41.46M (JPY 6.20B) in FY2026, of which pure Subsidy Income represented $37.21M (JPY 5.56B).
* SBIR Phase 3 (ISSA-J1): Contributed $30.44M (JPY 4.55B) out of a maximum project delivery cap of $80.23M (JPY 12.0B) / $54.76M subsidy cap, leaving the remainder deferred into FY2027/FY2028.
* JST K Program (REFLEX-J): Contributed $7.10M (JPY 1.06B) out of a maximum $72.38M grant spanning 2025–2030.
* True Operational Volume: The combined Project Income (recognized revenue plus subsidy capital) reached $76.93M in FY2026.
Order Book and Execution Dynamics
Astroscale Holdings Inc. secured $183.43M (JPY 27.43B) in new formalized contract orders in FY2026. This brought the total outstanding backlog to $253.65M (JPY 37.93B) as of April 30, 2026.
* Book-to-Bill Ratio: Calculated at ~4.6x ($183.43M new orders divided by $39.72M recognized revenue), indicating robust pipeline visibility.
* Revenue Deferral Vectors: Conversion of the backlog remains highly sensitive to third-party launch timelines and fixed-price Milestone Payment schedules. Milestone contracts include JAXA’s CRD2/ADRAS-J2 (maximum value of $80.23M contracted for 2024–2029), Eutelsat OneWeb Sunrise/ELSA-M (base value of $15.77M / €13.95M contracted for 2024–2027), and the U.S. Space Force/NSTXL APS-R Life Extension contract ($41.20M contracted for 2023–2027, of which $20.89M was recognized in FY2026).
Macro-Currency Insulation Effects
The depreciated Japanese Yen (JPY) served as a critical non-operating financial cushion in FY2026. The company recorded a Foreign Exchange Gain of $24.41M (JPY 3.65B) under Financial Income, reversing the $14.58M (JPY 2.18B) FX loss suffered in FY2025.
* Balance Sheet Exposure: At FY2026 year-end, the company held foreign currency exposures of $82.04M (JPY 12.27B) in USD and $13.14M (JPY 1.96B) in GBP.
* FX Sensitivity Model: A 1.0% appreciation of the JPY against major operating currencies directly erodes Profit Before Tax by $2.49M (JPY 372.15M).
Infrastructure Layout and Regional Moats
Astroscale Holdings Inc. operates a highly localized contracting structure designed to navigate sovereign procurement requirements and Foreign Ownership, Control, or Influence (FOCI) regulations.
Geographic Matrix: FY2026 Revenue vs. Non-Current Assets
The allocation of physical capital diverges sharply from current regional monetization, highlighting a forward-leaning investment strategy in the United States defense market.
Table: Geographic Revenue & Non-Current Asset Allocation Summary (FY2026)
| Geographic Region | FY2026 Revenue ($M) | Revenue Contribution (%) | FY2026 Non-Current Assets ($M) | Asset-to-Revenue Intensity (x) |
| Japan | 24.15 | 60.8% | 32.36 | 1.34 |
| United Kingdom | 13.77 | 34.7% | 13.88 | 1.01 |
| United States | 1.52 | 3.8% | 37.79 | 24.86 |
| Israel | 0.00 | 0.0% | 5.28 | N/A |
| Europe (France) | 0.00 | 0.0% | 0.16 | N/A |
| Other Regions | 0.28 | 0.7% | 0.00 | — |
| Total | 39.72 | 100.0% | 89.47 | 2.25 |
Manufacturing Facility Matrix
* Tokyo, Japan (Global HQ): Satellite Assembly & Integration Facility opened in May 2023. Custom-builds flagship sovereign platforms (ADRAS-J, ELSA-d).
* Harwell, United Kingdom: "Zeus" Assembly & Integration Facility opened in September 2022. Services the ELSA-M (OneWeb) and COSMIC (UKSA) programs. Tangible fixed assets (Property, Plant, and Equipment) stand at $6.51M (JPY 974.15M).
* Denver, Huntsville, and El Paso, United States: Dedicated defense-contracting hub carrying a tangible fixed asset base of $37.52M (JPY 5.61B). Crucially, $34.48M (JPY 5.15B) of this capital is classified as "construction in progress," indicating massive, uncompleted assembly infrastructure intended for classified U.S. Space Force and Department of Defense (DoD) contracts.
* Tel Aviv, Israel: Specialized R&D center inherited via the 2020 acquisition of Effective Space Solutions, dedicated exclusively to the engineering of Life Extension (LEX) propulsion systems.
* Toulouse, France: Regional node established in February 2025 targeting European Space Agency (ESA) and CNES projects.
Launch Provider and Supply Chain Dependencies
The company lacks independent launch capabilities and relies entirely on external partners to execute orbital placements, rendering revenue recognition under the Percentage of Completion (PoC) method vulnerable to launch manifest volatility.
* Core Launch Partners: Rocket Lab [NASDAQ: RKLB] (successfully deployed ADRAS-J on an Electron vehicle on February 18, 2024); NewSpace India Limited (ISRO), contracted for the ISSA-J1 mission in 2025 on a PSLV launcher; and Isar Aerospace SE, contracted for European launches starting in 2026.
* Procurement Bottlenecks: Upstream subsystem integration relies on specialized European and domestic vendors, including space-logistics firm Exotrail. Capped, fixed-price sovereign contracts expose Astroscale's gross margins to component cost inflation and specialized material shortages.
Human Capital Allocation
As an engineering-heavy manufacturer, human capital represents the company's largest structural cost center.
* Total Headcount: 593 full-time employees and 41 contract workers.
* Engineering Density: 437 employees are strictly allocated to engineering roles, yielding an Engineering Density Ratio of 73.7%.
* Average Salaries and Tenures:
* Astroscale Holdings HQ (31 employees): Average age of 44.6 years; average tenure of 3.2 years; average annual salary of $88,407 (JPY 13.22M).
* Astroscale Japan (198 employees): Average age of 42.4 years; average tenure of 2.5 years; average annual salary of $57,090 (JPY 8.53M).
Technology Readiness and Intellectual Property Moat
* Deployed Orbital Flight Heritage: ELSA-d (launched March 2021 into 550km LEO) verified end-to-end magnetic capture. ADRAS-J (launched February 18, 2024) achieved a global-first milestone by executing non-cooperative, unprepared H-IIA rocket upper stage rendezvous, approaching and holding an observation point at 50 meters under relative optical navigation.
* Development Pipeline: ELSA-M (Phase C/D manufacturing) for commercial constellation disposal; COSMIC (Phase B/C design) for UK defunct satellite removal; APS-R (U.S. Space Force refueling prototype) scheduled for 2027 delivery.
* IP Strategy: Focuses on proprietary 6-stage RPO autonomous relative navigation algorithms (using optical sensors and LiDAR without cooperative beacons) and standardized Generation 2 Magnetic Docking Plates. Standardizing these docking plates across commercial LEO constellations acts as a defensive lock-in mechanism. Aerospace quality assurance is maintained under AS/EN/JIS Q 9100 standards.
* Strategic Capital Alliances: Executed a third-party share allotment to satellite operator SKY Perfect JSAT, issuing 462,600 shares at 1,729 JPY per share to secure a capital injection of $5.35M (JPY 799.83M), linking a major customer directly to the equity structure.
HDIN Institutional Verdict
Management’s operational narrative emphasizes a rapid transition from R&D to commercialization, pointing to the 141.8% surge in top-line IFRS revenue and the successful uncooperative proximity maneuvers of the ADRAS-J mission. However, a forensic look at the financials reveals that the business remains structurally dependent on sovereign subsidies and favorable foreign exchange adjustments.
Stripping away the non-operating $24.41M FX paper gain reveals a cash-bleeding core. Operating cash flow remains deeply negative at -$83.48M. When measured against an ending cash balance of $67.00M and a razor-thin Net Working Capital of $6.18M, Astroscale's standalone survival is mathematically bound to immediate capital events. The company faces a looming "debt wall," with $73.55M in standard and subordinated loans maturing between FY2027 and FY2029. Management must either rapidly draw down on its newly established $66.86M Morgan Stanley/Mizuho credit facility—further leveraging the balance sheet—or execute dilutive public equity offerings.
Furthermore, the company's business model is constrained by the "Bespoke Trap." Operating primarily on a project-milestone basis (Phases A through F) for sovereign space agencies, its revenue is recognized via the Percentage of Completion (PoC) method. This ties margin expansion to engineering man-hours and customized spacecraft design rather than standardized, mass-manufactured satellite buses. While the $253.65M backlog is high quality with near-zero counterparty default risk (backed by JAXA, USSF, and Eutelsat), its conversion to cash is structurally delayed by both internal engineering timelines and external launch provider manifests.
Lastly, the massive capital expenditure mismatch in the United States represents a high-stakes strategic gamble. The U.S. subsidiary holds 42.2% ($37.79M) of the company's total physical asset base—including $34.48M locked in "construction in progress"—yet generated only 3.8% ($1.52M) of FY2026 revenue. Management is intentionally over-building FOCI-mitigated, highly localized manufacturing centers in Denver and Huntsville to bypass defense-security barriers. If the U.S. Space Force or domestic defense intelligence agencies delay or downscale upcoming classified life-extension or space situational awareness contracts, Astroscale will be left holding heavily underutilized, highly depreciating physical infrastructure, severely damaging future returns on equity.
Presentation Download & Video Access:
Presentation Download: Click the PDF download link under 'Related Topics' to access the full institutional presentation of this report.
Video Link: Click this link to watch the HDIN analyst briefing on YouTube.
About HDIN Research:
HDIN Research is a premier global market intelligence and strategic advisory firm specializing in institutional-grade financial analysis, supply chain audits, and macroeconomic forecasting. Our dedicated sector analysts deliver actionable, data-driven insights tailored for private equity, hedge funds, and corporate strategy teams. Visit us at http://www.hdinresearch.com.
2026 AI Transparency Footer:
"This intelligence report was authored by HDIN Research analysts following a rigorous audit of official corporate filings. AI was utilized for massive-scale data synthesis and structural drafting, ensuring 100% inclusion of reported data points. All strategic insights, financial modeling, and final verdicts were verified by our editorial board to ensure professional accuracy and compliance with 2026 Google Search E-E-A-T standards."