Cyabra, Inc. Realigns Balance Sheet Post-Merger as 955% Dilution Overhang and Israeli Geopolitical Friction Threaten Solvency Runway
Date : 2026-08-03
Reading : 145
HDIN Executive Takeaways
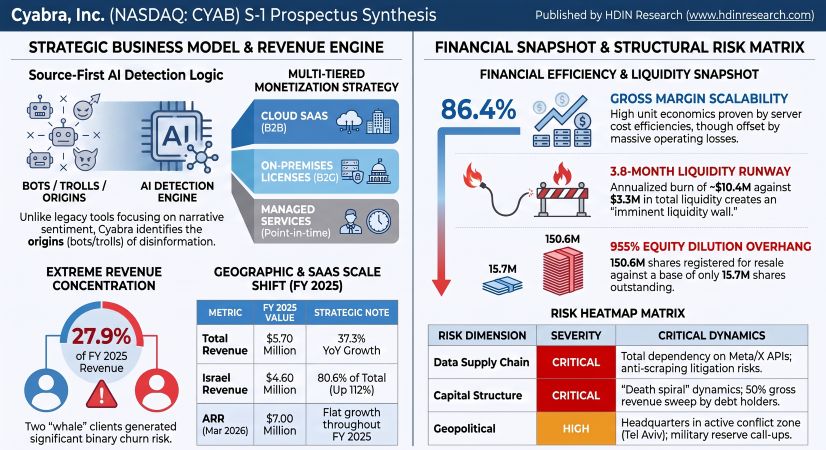
1. Cyabra, Inc. [NASDAQ: CYAB] executed a reverse recapitalization in Q1 2026, extinguishing $12.87 million in convertible debt, but faces an acute cash runway of 3.6 to 3.8 months based on $3.31 million in total liquidity and a $2.60 million quarterly burn rate.
2. Top-line concentration remains extreme, with two clients generating 27.9% of FY 2025 revenue ($1.59 million out of $5.71 million), while Israeli operations expanded 112.0% YoY to $4.60 million, offsetting contracting US revenue (-44.7% YoY to $1.10 million).
3. A resale registration covering 150.62 million shares represents a 955% dilution overhang on the 15.77 million share base, compounded by insider debt terms featuring 50% gross revenue sweeps.
Figure Cyabra Inc S-1 Prospectus Synthesis
 Segmental Realities, Working Capital Deficit, and Capital Restructuring
Cyabra, Inc. operates a cloud-hosted software model for disinformation detection, exhibiting strong gross margin expansion counterbalanced by operating losses and solvency stress. Revenue reached $5.71 million in FY 2025, representing a 37.35% increase YoY from $4.155 million in FY 2024. In Q1 2026, top-line revenue expanded 12.30% YoY to $1.415 million compared to $1.260 million in Q1 2025. Gross margins consistently expanded from 81.20% in FY 2024 to 84.80% in FY 2025 (+360 bps), reaching 86.40% in Q1 2026 (+200 bps YoY relative to 84.40% in Q1 2025), driven by server cost efficiencies on Amazon Web Services [NASDAQ: AMZN] infrastructure.
Operating losses deteriorated sharply, surging 192.82% YoY in Q1 2026 to $11.824 million, compared to $4.038 million in Q1 2025. This loss expansion was driven by $5.20 million in share-based compensation (SBC) and $3.40 million in non-recurring merger transaction expenses. Operating margin degraded to -835.62% in Q1 2026, down from -320.48% in Q1 2025 and -209.74% in FY 2025. For FY 2025, baseline operating costs were anchored by $6.89 million in R&D and $5.69 million in Sales & Marketing (S&M)—the latter consuming 99.70% of total annual revenue. Net losses totaled $15.610 million in FY 2024, $12.819 million in FY 2025, and $10.770 million in Q1 2026, pushing the company's accumulated deficit to $58.143 million as of March 31, 2026.
Table Historical Financial Performance and Profitability Metrics Overview (FY2024–Q1 FY2026)
The Q1 2026 business combination transformed the balance sheet structure. Redeemable convertible preferred stock ($15.268 million as of December 31, 2025) and short-term convertible notes ($12.869 million as of December 31, 2025) were eliminated via conversion to permanent equity, expanding Additional Paid-In Capital (APIC) from $7.332 million to $46.093 million. Short-term loans were reduced from $5.768 million to $2.237 million, supported by $6.37 million in cash loan repayments during Q1 2026. Cash and cash equivalents rose from $294,000 to $3.122 million (plus $193,000 in restricted cash, yielding $3.315 million in total liquidity). Despite these shifts, total current liabilities of $16.365 million overwhelmed total current assets of $3.772 million as of March 31, 2026, leaving a working capital deficit of $12.593 million. Warrant liabilities stood at $142,000 following the reclassification of historical Hapoalim warrants to equity.
Table Balance Sheet Transformation and Capital Structure Evolution Overview (December 2025–March 2026)
Operating cash flow (OCF) burn accelerated to $2.598 million in Q1 2026, up 104.08% YoY from $1.273 million in Q1 2025. Annual OCF burn reached $8.144 million in FY 2025 and $5.196 million in FY 2024. CapEx remained low ($85,000 in FY 2024, $54,000 in FY 2025, $12,000 in Q1 2025, and $5,000 in Q1 2026), keeping Free Cash Flow (FCF) burn effectively identical to OCF burn ($2.603 million in Q1 2026). At an annualized burn rate of $10.412 million (~$866,000 per month), total liquidity of $3.315 million leaves an estimated cash runway of 3.6 to 3.8 months post-merger. Management and independent auditors have issued an explicit going concern warning, noting solvency depends on secondary equity offerings or cash exercises of warrants (which hold a theoretical yield up to $36.40 million).
Infrastructure Layout, API Vulnerabilities, and Commercial Backlog
Cyabra, Inc. deploys a hybrid commercial structure comprising SaaS subscriptions (cloud-hosted, non-refundable, multi-month to 3-year contracts), on-premises licenses (governmental/intelligence, 2-to-3-year terms), and managed services (discrete custom intelligence reports, recognized at a point in time). The go-to-market architecture relies on a 13-person direct sales team supplemented by resellers, PR agencies, social listening partners, and system integrators.
Geographically, revenue shifted toward Israel in FY 2025, generating $4.60 million (80.60% of total revenue), up 112.04% YoY from $2.16 million in FY 2024. Conversely, US revenue contracted 44.72% YoY to $1.10 million (19.40% of total revenue) in FY 2025, down from $1.99 million in FY 2024. Customer concentration is high: in FY 2025, two individual clients generated $997,000 and $593,000, representing 27.86% of total revenue ($1.59 million). In FY 2024, five clients generated a combined $2.222 million (53.48% of total revenue), individual contributions being $455,000, $450,000, $447,000, $436,000, and $434,000. Management explicitly does not track or disclose Net Retention Rate (NRR), Customer Acquisition Cost (CAC), Lifetime Value (LTV), or Churn, citing early-stage commercialization.
Table Revenue Growth, Recurring Revenue Profile, and Backlog Visibility Overview (FY2024–Q1 FY2026)
Annualized Recurring Revenue (ARR) reached $7.00 million in Q1 2026 (+19.00% YoY), after stagnating flat at $6.10 million across FYE 2024 and FYE 2025 due to extended B2G public sector procurement cycles. Contract liabilities display shrinking long-term visibility: non-current deferred revenue fell from $362,000 at FYE 2024 to $115,000 at FYE 2025 (-68.23%), and down to $41,000 as of March 31, 2026. Current deferred revenue stood at $2.280 million as of Q1 2026. Total Remaining Performance Obligations (RPO) as of March 31, 2026 totaled $4.790 million, with $3.815 million scheduled for recognition within 12 months and $975,000 contracted beyond one year.
Cyabra, Inc.'s operational architecture relies on real-time data ingestion via third-party Application Programming Interfaces (APIs) and automated web scraping across social media platforms (Facebook, X, Instagram, LinkedIn) and news sites. This creates vulnerabilities to API rate limits, price increases, access revocations, anti-scraping measures, and legal claims for breach of contract or IP infringement. The cloud infrastructure is centralized on Amazon Web Services [NASDAQ: AMZN], exposing operations to single-vendor concentration risks without disclosed minimum long-term contractual financial commitments.
The technological stack uses semi-supervised machine learning classification models that evaluate hundreds of behavioral parameters to output binary account authenticity scores with confidence intervals. The platform avoids generative AI models to prevent data "hallucinations." Cyabra, Inc. relies on unpatented trade secrets, non-disclosure agreements, and a proprietary "golden dataset" labeled by internal analysts, rather than a defensible patent portfolio. The software incorporates open-source libraries, exposing the proprietary codebase to "copyleft" enforcement risks.
Under the Israeli Innovation Law, Cyabra, Inc. received $719,000 in research grants from the Israel Innovation Authority (IIA), incurring a mandatory 3.00% royalty on funded product sales ($171,000 recognized in FY 2025) up to a repayment cap of ~$527,000 plus interest. Moving IP or manufacturing capacity outside Israel requires IIA authorization and a "Redemption Fee" capped at up to six times (6x) the total grant amount plus interest.
HDIN Institutional Verdict: Toxic Derivative Structure and Governance Asymmetries
Cyabra, Inc. faces a structural equity overhang. As of July 29, 2026, there were 15,765,372 shares of common stock outstanding. The Form S-1 registers up to 150,621,827 shares for resale, representing a potential 955.40% dilution relative to the current share count. This overhang includes:
1. PIPE Warrants (July 9, 2026): 12,643,680 Pre-Funded Warrants (exercise price $0.0001 per share), 13,818,770 Series A Warrants (exercise price $0.50, 5-year expiration), and 13,818,770 Series B Warrants (exercise price $0.45, 12-month expiration), totaling 40,281,220 registered shares.
2. Preferred Stock Conversions: Amendments reduced the conversion prices of Series A and Series B Preferred Stock to $0.435 per share (covering 35,648,276 shares). The Series C Preferred Stock ($10.66 million value) Exchange Agreement includes 24,505,747 shares/pre-funded warrants matched with 24,505,747 Series A Warrants and 24,505,747 Series B Warrants (73,517,241 total shares). Downward anti-dilution resets operate on an 18-month timeline, capped by a floor price equal to the greater of $0.10 or 20% of the pre-merger closing bid price.
3. Excluded Derivative Overhang: 400,000 fully vested RSUs granted to executive founders; 2026 Omnibus Incentive Plan reserves (1,153,587 Replacement Options plus 2,072,125 future equity awards); legacy out-of-the-money warrants (400,000 units at $11.50 and 49,983 units at $3.6011); and up to 3,000,000 contingent earn-out shares tied to Volume-Weighted Average Price (VWAP) benchmarks (Tranche 1: 1.0M shares at $15.00 VWAP before Dec 31, 2026; Tranche 2: 1.0M shares at $20.00 VWAP before Dec 31, 2027; Tranche 3: 1.0M shares at $25.00 VWAP before Dec 31, 2029). Fully diluted share count reaches ~173.06 million shares.
Related-party transactions show capital structure asymmetries. SPAC sponsor Trailblazer Sponsor Group, LLC converted $5.33 million in working capital promissory notes into Preferred Stock at a 300% premium ($15.99 million in stated value of Series B and C Preferred Stock). Bridge loan notes issued to affiliate Alpha Capital Anstalt (9.00% to 10.00% interest) mandate repayment via a 50% sweep of all gross revenues and financing proceeds, diverting cash from operational uses.
Director Josette Sheeran (via Firefly Global Group) receives a $4,000 monthly retainer, 144,387 options, and a 10% direct sales commission on introduced commercial agreements, leading to a non-independent designation. Legal counsel Loeb & Loeb LLP ($1.50 million) and Lowenstein Sandler LLP ($1.50 million) converted legal fees into 1,000,000 common shares each (2,000,000 shares total).
Table Key Governance Structure and Insider Ownership Profile Overview
Founders Dan Brahmy (CEO), Yossef Daar (CPO), and Ido Shraga (CTO) founded the company in July 2017 and hold ~4.96% each. Total officers and directors hold 19.50%. Commercial executive leadership includes CRO Emmanuel Heymann (joined 2023, ex-Similarweb [NYSE: SMWB]) and CFO Yael Sandler (joined July 2024, ex-CFO Nano Dimension Ltd [NASDAQ: NNDM]). Post-merger CEO base compensation shifted from NIS 47,000 per month (~$12,771 USD) to a $301,000 annual US base, a $40,000 bonus, and a $400,000 cash transaction bonus.
Board governance features seven directors, four of whom are classified as independent: Sonny Vu, Michael Madon, James Flanagan (Audit Chair, ex-PwC 39 years), and Michael Pompeo (former US Secretary of State). The corporate charter utilizes anti-takeover protections: a classified board (Classes I, II, III with staggered 3-year terms), director removal for cause only, prohibition of stockholder action by written consent or special meetings, and Delaware Court of Chancery exclusive forum clauses.
Operating continuity risks are heightened by corporate headquarters and primary R&D operations remaining in Tel Aviv, Israel. Operations face exposure to regional armed conflicts ("Swords of Iron"), physical infrastructure risks, targeted cyberattacks, and mandatory military reserve call-ups for personnel. International operations face compliance obligations under EU GDPR (fines up to €20.00 million or 4.00% of global turnover, ~$22.61 million USD), UK GDPR (fines up to £17.50 million, ~$23.09 million USD), CCPA, CPRA, and the Israeli Privacy Protection Law (PPL).
Cyabra, Inc. is currently managing deficiency notices from Nasdaq for failing to maintain the $50.00 million minimum Market Value of Listed Securities (MVLS) and the $1.00 minimum bid price. It competes directly against specialized threat firms—Logically, Inc., Blackbird.AI, Alethea Group, Inc., VineSight Technology Ltd., and Pyrra Technologies Inc.—as well as broader cybersecurity incumbents attempting to capture enterprise disinformation protection spending, which Gartner projects to exceed $500.00 billion by 2028.
Presentation Download & Video Access:
- Presentation Download: Click the PDF download link under 'Related Topics' to access the full institutional presentation of this report.
- Video Link: Click this link to watch the HDIN analyst briefing on YouTube.
About HDIN Research:
HDIN Research is a premier global market intelligence and strategic advisory firm specializing in institutional-grade financial analysis, supply chain audits, and macroeconomic forecasting. Our dedicated sector analysts deliver actionable, data-driven insights tailored for private equity, hedge funds, and corporate strategy teams. Visit us at http://www.hdinresearch.com.
2026 AI Transparency Footer:
"This intelligence report was authored by HDIN Research analysts following a rigorous audit of official corporate filings. AI was utilized for massive-scale data synthesis and structural drafting, ensuring 100% inclusion of reported data points. All strategic insights, financial modeling, and final verdicts were verified by our editorial board to ensure professional accuracy and compliance with 2026 Google Search E-E-A-T standards."
1. Cyabra, Inc. [NASDAQ: CYAB] executed a reverse recapitalization in Q1 2026, extinguishing $12.87 million in convertible debt, but faces an acute cash runway of 3.6 to 3.8 months based on $3.31 million in total liquidity and a $2.60 million quarterly burn rate.
2. Top-line concentration remains extreme, with two clients generating 27.9% of FY 2025 revenue ($1.59 million out of $5.71 million), while Israeli operations expanded 112.0% YoY to $4.60 million, offsetting contracting US revenue (-44.7% YoY to $1.10 million).
3. A resale registration covering 150.62 million shares represents a 955% dilution overhang on the 15.77 million share base, compounded by insider debt terms featuring 50% gross revenue sweeps.
Figure Cyabra Inc S-1 Prospectus Synthesis
Segmental Realities, Working Capital Deficit, and Capital RestructuringCyabra, Inc. operates a cloud-hosted software model for disinformation detection, exhibiting strong gross margin expansion counterbalanced by operating losses and solvency stress. Revenue reached $5.71 million in FY 2025, representing a 37.35% increase YoY from $4.155 million in FY 2024. In Q1 2026, top-line revenue expanded 12.30% YoY to $1.415 million compared to $1.260 million in Q1 2025. Gross margins consistently expanded from 81.20% in FY 2024 to 84.80% in FY 2025 (+360 bps), reaching 86.40% in Q1 2026 (+200 bps YoY relative to 84.40% in Q1 2025), driven by server cost efficiencies on Amazon Web Services [NASDAQ: AMZN] infrastructure.
Operating losses deteriorated sharply, surging 192.82% YoY in Q1 2026 to $11.824 million, compared to $4.038 million in Q1 2025. This loss expansion was driven by $5.20 million in share-based compensation (SBC) and $3.40 million in non-recurring merger transaction expenses. Operating margin degraded to -835.62% in Q1 2026, down from -320.48% in Q1 2025 and -209.74% in FY 2025. For FY 2025, baseline operating costs were anchored by $6.89 million in R&D and $5.69 million in Sales & Marketing (S&M)—the latter consuming 99.70% of total annual revenue. Net losses totaled $15.610 million in FY 2024, $12.819 million in FY 2025, and $10.770 million in Q1 2026, pushing the company's accumulated deficit to $58.143 million as of March 31, 2026.
Table Historical Financial Performance and Profitability Metrics Overview (FY2024–Q1 FY2026)
| Historical & Recent Financial Performance (USD in thousands) | FY 2024 | FY 2025 | Q1 2025 | Q1 2026 |
| Revenues | $4,155 | $5,707 | $1,260 | $1,415 |
| Gross Profit | $3,373 | $4,841 | $1,064 | $1,223 |
| Gross Margin % | 81.20% | 84.80% | 84.40% | 86.40% |
| Operating Loss | $(9,198) | $(11,970) | $(4,038) | $(11,824) |
| Operating Margin % | -221.37% | -209.74% | -320.48% | -835.62% |
| Net Loss | $(15,610) | $(12,819) | $(3,314) | $(10,770) |
The Q1 2026 business combination transformed the balance sheet structure. Redeemable convertible preferred stock ($15.268 million as of December 31, 2025) and short-term convertible notes ($12.869 million as of December 31, 2025) were eliminated via conversion to permanent equity, expanding Additional Paid-In Capital (APIC) from $7.332 million to $46.093 million. Short-term loans were reduced from $5.768 million to $2.237 million, supported by $6.37 million in cash loan repayments during Q1 2026. Cash and cash equivalents rose from $294,000 to $3.122 million (plus $193,000 in restricted cash, yielding $3.315 million in total liquidity). Despite these shifts, total current liabilities of $16.365 million overwhelmed total current assets of $3.772 million as of March 31, 2026, leaving a working capital deficit of $12.593 million. Warrant liabilities stood at $142,000 following the reclassification of historical Hapoalim warrants to equity.
Table Balance Sheet Transformation and Capital Structure Evolution Overview (December 2025–March 2026)
| Balance Sheet Snapshot (USD in thousands) | Dec 31, 2025 | Mar 31, 2026 | Variance / Structural Drivers |
| Cash & Cash Equivalents | $294 | $3,122 | +$2,828 (PIPE / Merger infusion) |
| Accounts Receivable | $269 | $216 | -$53 (Collections efficiency) |
| Total Current Assets | $737 | $3,772 | Driven entirely by merger cash infusion |
| Total Assets | $1,458 | $4,527 | Asset-light software deployment framework |
| Short-Term Loans | $5,768 | $2,237 | -$3,531 (Post-merger debt repayments) |
| Convertible Notes (Current) | $12,869 | $0 | Converted to permanent equity (APIC) |
| Total Current Liabilities | $25,476 | $16,365 | De-leveraging via debt-to-equity conversions |
| Total Liabilities | $26,229 | $16,575 | Extinguishment of mezzanine debt items |
| Total Capital Deficiency | $(40,039) | $(12,048) | Improved technical equ |
Operating cash flow (OCF) burn accelerated to $2.598 million in Q1 2026, up 104.08% YoY from $1.273 million in Q1 2025. Annual OCF burn reached $8.144 million in FY 2025 and $5.196 million in FY 2024. CapEx remained low ($85,000 in FY 2024, $54,000 in FY 2025, $12,000 in Q1 2025, and $5,000 in Q1 2026), keeping Free Cash Flow (FCF) burn effectively identical to OCF burn ($2.603 million in Q1 2026). At an annualized burn rate of $10.412 million (~$866,000 per month), total liquidity of $3.315 million leaves an estimated cash runway of 3.6 to 3.8 months post-merger. Management and independent auditors have issued an explicit going concern warning, noting solvency depends on secondary equity offerings or cash exercises of warrants (which hold a theoretical yield up to $36.40 million).
Infrastructure Layout, API Vulnerabilities, and Commercial Backlog
Cyabra, Inc. deploys a hybrid commercial structure comprising SaaS subscriptions (cloud-hosted, non-refundable, multi-month to 3-year contracts), on-premises licenses (governmental/intelligence, 2-to-3-year terms), and managed services (discrete custom intelligence reports, recognized at a point in time). The go-to-market architecture relies on a 13-person direct sales team supplemented by resellers, PR agencies, social listening partners, and system integrators.
Geographically, revenue shifted toward Israel in FY 2025, generating $4.60 million (80.60% of total revenue), up 112.04% YoY from $2.16 million in FY 2024. Conversely, US revenue contracted 44.72% YoY to $1.10 million (19.40% of total revenue) in FY 2025, down from $1.99 million in FY 2024. Customer concentration is high: in FY 2025, two individual clients generated $997,000 and $593,000, representing 27.86% of total revenue ($1.59 million). In FY 2024, five clients generated a combined $2.222 million (53.48% of total revenue), individual contributions being $455,000, $450,000, $447,000, $436,000, and $434,000. Management explicitly does not track or disclose Net Retention Rate (NRR), Customer Acquisition Cost (CAC), Lifetime Value (LTV), or Churn, citing early-stage commercialization.
Table Revenue Growth, Recurring Revenue Profile, and Backlog Visibility Overview (FY2024–Q1 FY2026)
| Revenue & Backlog Metrics (USD in thousands) | FY 2024 | FY 2025 | Q1 2026 |
| Annualized Recurring Revenue (ARR) | $6,100 | $6,100 | $7,000 |
| Israel Revenue (% share) | $2,160 (52.0%) | $4,600 (80.6%) | N/D |
| United States Revenue (% share) | $1,990 (48.0%) | $1,100 (19.4%) | N/D |
| Current Deferred Revenue | $2,420 | $2,810 | $2,280 |
| Non-Current Deferred Revenue | $362 | $115 | $41 |
| Total Remaining Performance Obligations (RPO) | N/D | N/D | $4,790 |
Annualized Recurring Revenue (ARR) reached $7.00 million in Q1 2026 (+19.00% YoY), after stagnating flat at $6.10 million across FYE 2024 and FYE 2025 due to extended B2G public sector procurement cycles. Contract liabilities display shrinking long-term visibility: non-current deferred revenue fell from $362,000 at FYE 2024 to $115,000 at FYE 2025 (-68.23%), and down to $41,000 as of March 31, 2026. Current deferred revenue stood at $2.280 million as of Q1 2026. Total Remaining Performance Obligations (RPO) as of March 31, 2026 totaled $4.790 million, with $3.815 million scheduled for recognition within 12 months and $975,000 contracted beyond one year.
Cyabra, Inc.'s operational architecture relies on real-time data ingestion via third-party Application Programming Interfaces (APIs) and automated web scraping across social media platforms (Facebook, X, Instagram, LinkedIn) and news sites. This creates vulnerabilities to API rate limits, price increases, access revocations, anti-scraping measures, and legal claims for breach of contract or IP infringement. The cloud infrastructure is centralized on Amazon Web Services [NASDAQ: AMZN], exposing operations to single-vendor concentration risks without disclosed minimum long-term contractual financial commitments.
The technological stack uses semi-supervised machine learning classification models that evaluate hundreds of behavioral parameters to output binary account authenticity scores with confidence intervals. The platform avoids generative AI models to prevent data "hallucinations." Cyabra, Inc. relies on unpatented trade secrets, non-disclosure agreements, and a proprietary "golden dataset" labeled by internal analysts, rather than a defensible patent portfolio. The software incorporates open-source libraries, exposing the proprietary codebase to "copyleft" enforcement risks.
Under the Israeli Innovation Law, Cyabra, Inc. received $719,000 in research grants from the Israel Innovation Authority (IIA), incurring a mandatory 3.00% royalty on funded product sales ($171,000 recognized in FY 2025) up to a repayment cap of ~$527,000 plus interest. Moving IP or manufacturing capacity outside Israel requires IIA authorization and a "Redemption Fee" capped at up to six times (6x) the total grant amount plus interest.
HDIN Institutional Verdict: Toxic Derivative Structure and Governance Asymmetries
Cyabra, Inc. faces a structural equity overhang. As of July 29, 2026, there were 15,765,372 shares of common stock outstanding. The Form S-1 registers up to 150,621,827 shares for resale, representing a potential 955.40% dilution relative to the current share count. This overhang includes:
1. PIPE Warrants (July 9, 2026): 12,643,680 Pre-Funded Warrants (exercise price $0.0001 per share), 13,818,770 Series A Warrants (exercise price $0.50, 5-year expiration), and 13,818,770 Series B Warrants (exercise price $0.45, 12-month expiration), totaling 40,281,220 registered shares.
2. Preferred Stock Conversions: Amendments reduced the conversion prices of Series A and Series B Preferred Stock to $0.435 per share (covering 35,648,276 shares). The Series C Preferred Stock ($10.66 million value) Exchange Agreement includes 24,505,747 shares/pre-funded warrants matched with 24,505,747 Series A Warrants and 24,505,747 Series B Warrants (73,517,241 total shares). Downward anti-dilution resets operate on an 18-month timeline, capped by a floor price equal to the greater of $0.10 or 20% of the pre-merger closing bid price.
3. Excluded Derivative Overhang: 400,000 fully vested RSUs granted to executive founders; 2026 Omnibus Incentive Plan reserves (1,153,587 Replacement Options plus 2,072,125 future equity awards); legacy out-of-the-money warrants (400,000 units at $11.50 and 49,983 units at $3.6011); and up to 3,000,000 contingent earn-out shares tied to Volume-Weighted Average Price (VWAP) benchmarks (Tranche 1: 1.0M shares at $15.00 VWAP before Dec 31, 2026; Tranche 2: 1.0M shares at $20.00 VWAP before Dec 31, 2027; Tranche 3: 1.0M shares at $25.00 VWAP before Dec 31, 2029). Fully diluted share count reaches ~173.06 million shares.
Related-party transactions show capital structure asymmetries. SPAC sponsor Trailblazer Sponsor Group, LLC converted $5.33 million in working capital promissory notes into Preferred Stock at a 300% premium ($15.99 million in stated value of Series B and C Preferred Stock). Bridge loan notes issued to affiliate Alpha Capital Anstalt (9.00% to 10.00% interest) mandate repayment via a 50% sweep of all gross revenues and financing proceeds, diverting cash from operational uses.
Director Josette Sheeran (via Firefly Global Group) receives a $4,000 monthly retainer, 144,387 options, and a 10% direct sales commission on introduced commercial agreements, leading to a non-independent designation. Legal counsel Loeb & Loeb LLP ($1.50 million) and Lowenstein Sandler LLP ($1.50 million) converted legal fees into 1,000,000 common shares each (2,000,000 shares total).
Table Key Governance Structure and Insider Ownership Profile Overview
| Key Governance & Insider Ownership Breakdown | Stake % / Metric | Structural Details & Mechanics |
| All Directors & Officers (10 persons) | 19.50% (3,106,127 shares) | Founder trio holds ~4.96% each |
| Trailblazer Sponsor Group, LLC | 13.69% (2,158,949 shares) | Converted $5.33M debt at 300% premium |
| Alpha Capital Anstalt | 9.99% (Capped) | Holds 50% gross revenue sweep notes |
| Armistice Capital Master Fund Ltd. | 9.99% (Capped) | Restricted by 9.99% beneficial ownership blocker |
| CEO Dan Brahmy Compensation | $301k Base / $400k Bonus | $301k US base, $40k bonus, $400k transaction bonus |
Founders Dan Brahmy (CEO), Yossef Daar (CPO), and Ido Shraga (CTO) founded the company in July 2017 and hold ~4.96% each. Total officers and directors hold 19.50%. Commercial executive leadership includes CRO Emmanuel Heymann (joined 2023, ex-Similarweb [NYSE: SMWB]) and CFO Yael Sandler (joined July 2024, ex-CFO Nano Dimension Ltd [NASDAQ: NNDM]). Post-merger CEO base compensation shifted from NIS 47,000 per month (~$12,771 USD) to a $301,000 annual US base, a $40,000 bonus, and a $400,000 cash transaction bonus.
Board governance features seven directors, four of whom are classified as independent: Sonny Vu, Michael Madon, James Flanagan (Audit Chair, ex-PwC 39 years), and Michael Pompeo (former US Secretary of State). The corporate charter utilizes anti-takeover protections: a classified board (Classes I, II, III with staggered 3-year terms), director removal for cause only, prohibition of stockholder action by written consent or special meetings, and Delaware Court of Chancery exclusive forum clauses.
Operating continuity risks are heightened by corporate headquarters and primary R&D operations remaining in Tel Aviv, Israel. Operations face exposure to regional armed conflicts ("Swords of Iron"), physical infrastructure risks, targeted cyberattacks, and mandatory military reserve call-ups for personnel. International operations face compliance obligations under EU GDPR (fines up to €20.00 million or 4.00% of global turnover, ~$22.61 million USD), UK GDPR (fines up to £17.50 million, ~$23.09 million USD), CCPA, CPRA, and the Israeli Privacy Protection Law (PPL).
Cyabra, Inc. is currently managing deficiency notices from Nasdaq for failing to maintain the $50.00 million minimum Market Value of Listed Securities (MVLS) and the $1.00 minimum bid price. It competes directly against specialized threat firms—Logically, Inc., Blackbird.AI, Alethea Group, Inc., VineSight Technology Ltd., and Pyrra Technologies Inc.—as well as broader cybersecurity incumbents attempting to capture enterprise disinformation protection spending, which Gartner projects to exceed $500.00 billion by 2028.
Presentation Download & Video Access:
- Presentation Download: Click the PDF download link under 'Related Topics' to access the full institutional presentation of this report.
- Video Link: Click this link to watch the HDIN analyst briefing on YouTube.
About HDIN Research:
HDIN Research is a premier global market intelligence and strategic advisory firm specializing in institutional-grade financial analysis, supply chain audits, and macroeconomic forecasting. Our dedicated sector analysts deliver actionable, data-driven insights tailored for private equity, hedge funds, and corporate strategy teams. Visit us at http://www.hdinresearch.com.
2026 AI Transparency Footer:
"This intelligence report was authored by HDIN Research analysts following a rigorous audit of official corporate filings. AI was utilized for massive-scale data synthesis and structural drafting, ensuring 100% inclusion of reported data points. All strategic insights, financial modeling, and final verdicts were verified by our editorial board to ensure professional accuracy and compliance with 2026 Google Search E-E-A-T standards."