IQM Quantum Computers [NASDAQ: IQM]: European Hardware Expansion Accelerates Near Espoo Fab as 90.7% Revenue Surge Drives $399M Liquidity Runway
Date : 2026-08-05
Reading : 381
HDIN Executive Takeaways
1. IQM Quantum Computers [NASDAQ: IQM] expanded FY2025 revenue by 90.7% YoY to $35.43 million (€31.33 million), supported by a $76.11 million backlog and $399.18 million in pro forma liquidity providing 5.1 years of runway.
2. European public institutions generated 87.3% of revenue, with 74.6% ($26.44 million) concentrated across four sovereign entities.
3. Industrial scaling faces single-source cryogenic constraints from Bluefors and a 313% spike in customer performance guarantees to $15.07 million (€13.33 million).
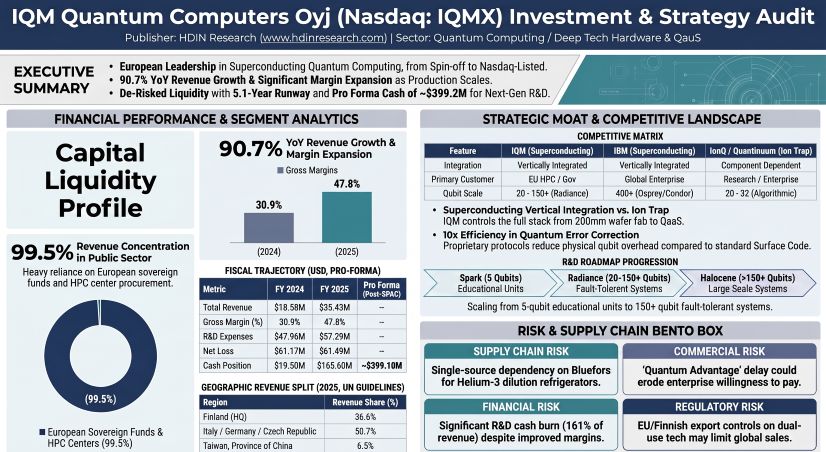
Figure IQM Quantum Computers Oyj (Nasdaq lQMX) Investment & strategy Audit
 Financial Mechanics and Segmental Revenue Dynamics
IQM Quantum Computers [NASDAQ: IQM] expanded top-line consolidated revenue to $35.43 million (€31.33 million) in FY2025, representing a 90.7% year-over-year increase from $18.58 million (€16.44 million) in FY2024. Revenue generation remains structurally skewed toward physical, on-premises system deliveries. Dedicated quantum hardware sales generated $34.58 million (€30.59 million), while post-installation professional services contributed $0.13 million (€0.11 million), combining to represent 98.0% of total customer contract revenue.
In contrast, recurring Quantum-as-a-Service (QaaS) delivered through the IQM Resonance platform and AWS Braket generated $0.32 million (€0.28 million). Although QaaS registered 492% year-over-year growth, it comprised 0.9% of total contract revenue. Government-funded scientific co-development projects contributed $0.39 million (€0.35 million), or 1.1% of customer contract revenue. Non-dilutive operating grants, categorized separately as "Other Operating Income," yielded $3.80 million (€3.36 million) in FY2025, down from $4.36 million (€3.85 million) in FY2024.
Gross profit rose 194.6% YoY to $16.94 million (€14.98 million), expanding gross margin by 1,690 basis points from 30.9% in FY2024 to 47.8% in FY2025 due to initial manufacturing fixed-cost absorption. Cost of revenue grew 44.0% YoY to $18.49 million. Research and development expenses reached $57.29 million (€50.68 million), up 19.5% YoY, though R&D intensity decreased from 258.1% of revenue in FY2024 to 161.7% in FY2025. Selling, General, and Administrative (SG&A) expenses totaled $27.53 million (€24.35 million), decreasing from 102.5% of revenue to 77.7% YoY. Operating losses expanded 16.1% YoY to $65.65 million (€58.06 million), while net loss remained stable at $61.49 million (€54.39 million), buffered by an $8.07 million (€7.14 million) fair value gain from the extinguishment of a convertible loan derivative.
Operating cash outflows expanded 44.9% YoY to $64.67 million (€57.20 million). Total capital expenditures held flat at $13.04 million (€11.54 million), resulting in an annual Free Cash Flow (FCF) burn rate of $77.71 million (€68.73 million). IQM closed FY2025 with $165.68 million (€146.54 million) in cash. Combined with $233.5 million in net proceeds from its July 2026 SPAC merger and PIPE transaction, pro forma total cash reached ~$399.18 million, establishing a 5.1-year operational cash runway at current burn levels.
Table Consolidated Financial Performance, Cash Flow Profile, and Liquidity Position (FY2024–FY2025)
Industrial Footprint, Supply Chain Single-Points, and Risk Architecture
IQM maintains a vertically integrated hardware manufacturing footprint centered in Europe. Its primary fabrication unit (Fab) in Espoo, Finland, utilizes 200-millimeter silicon wafers to manufacture, package, and 3D-integrate superconducting microchips, operating alongside an integrated assembly line for system-level testing. QaaS operations and internal cloud testing are run out of a dedicated data center in Munich, Germany, connected to the Leibniz Supercomputing Centre (LRZ) ecosystem.
Geographically, Europe accounted for 87.3% ($30.93 million) of FY2025 revenue:
* Finland: $12.97 million (€11.47 million), representing 36.6% of revenue.
* Italy: $8.27 million (€7.32 million), representing 23.3% of revenue.
* Germany: $7.33 million (€6.48 million), representing 20.7% of revenue.
* Czech Republic: $2.36 million (€2.09 million), representing 6.7% of revenue.
* Asia-Pacific (Taiwan, Province of China): $2.30 million (€2.03 million), representing 6.5% of revenue.
* Other Regions: $2.20 million (€1.95 million), representing 6.2% of revenue.
Customer concentration is structurally absolute. Although unique customers expanded from 8 to 22 in FY2025, public-sector entities generated 99.5% of revenue. Four institutional accounts generated 74.6% ($26.44 million / €23.39 million) of total revenue: Customer 1 contributed $6.82 million (€6.03 million), Customer 2 contributed $2.36 million (€2.09 million), Customer 3 contributed $10.14 million (€8.97 million), and Customer 4 contributed $7.12 million (€6.30 million).
Supply chain dependencies expose single-point operational vulnerabilities. Cryogenic dilution refrigerators operating in the millikelvin range are single-sourced from Bluefors in Finland, with system scaling constrained by global supplies of helium and helium-3 gas. Semiconductor processing depends on 200mm silicon wafers, low-noise microwave components, CPUs, GPUs, and FPGAs. FY2025 PP&E capital expenditures of $13.04 million (€11.54 million) were heavily weighted toward expansion rather than maintenance:
* Machinery & Equipment: $6.98 million (€6.18 million).
* Leasehold Improvements (Cleanrooms): $5.14 million (€4.55 million).
* Office & Other Equipment: $0.085 million (€0.075 million).
* Contractual CapEx Commitments: $8.71 million (€7.70 million).
Intellectual property defenses consist of 170 active patent families (339 total applications, 130 granted patents, and 48 unpublished utility applications), supplemented by 25 trade secrets, 8 registered utility models, 14 design registrations, and 44 trademarks. Joint IP ownership with spin-off institutions Aalto University and VTT carries march-in rights and potential commercial royalty obligations. IQM employs over 380 staff (50%, or ~190, in R&D). Talent retention utilizes four-year ESOP vesting schedules with a one-year cliff.
Off-balance-sheet exposures expanded as performance and advance payment guarantees issued to hardware customers rose 313% YoY to $15.07 million (€13.33 million), up from $3.65 million (€3.22 million) in 2024. Active legal provisions stood at $67.8k (€60k), with warranty provisions at $113k (€100k). On governance, CFO Jan Kürschner is leading remediation for identified ICFR material weaknesses spanning IT General Controls, IFRS/SEC financial reporting expertise, and segregation of duties.
Post-SPAC capital structure comprises 188,692,107 ordinary shares with single-class voting rights: Legacy Shareholders hold 84.7% (159,762,360 shares), PIPE Investors hold 7.7% (14,548,000 shares for $145.5 million gross proceeds), Public Shareholders hold 5.3% (10,006,747 shares), and Sponsor Insiders hold 2.3% (4,375,000 shares). Fully exercised options and warrants (32,603,100 units, including 19,056,614 under ESOP pools) represent a potential ~17.3% dilution overhang.
HDIN Institutional Verdict
IQM’s operational expansion reflects a classic hardware-first infrastructure monetization model. The 90.7% top-line acceleration and 55% surge in unfulfilled order backlog to $76.11 million (€67.32 million) provide forward revenue visibility over a 12-to-18-month delivery horizon. However, the company’s near-total reliance on sovereign European research grants and public sector HPC procurements (99.5% of revenue) highlights the absence of commercial enterprise adoption.
EBITDA health remains artificially buffered by gross grant accounting: removing $3.80 million in operating subsidies expands FY2025 operating losses from $65.65 million to $69.45 million. Furthermore, recognizing revenue on a cost-to-cost input basis over 12-to-18-month cycles, paired with a 313% surge in off-balance-sheet performance guarantees to $15.07 million, leaves gross margins exposed to delivery delays and component bottlenecks from single-source vendors like Bluefors.
While a $399.18 million pro forma cash balance insulates IQM from near-term capital markets volatility, long-term equity performance depends on converting its 5-qubit Spark and 20-to-150-qubit Radiance installed base into high-margin QaaS revenue and scaling its next-generation >150-qubit Halocene system toward commercially viable fault-tolerant benchmarks.
Presentation Download & Video Access:
Presentation Download: Click the PDF download link under 'Related Topics' to access the full institutional presentation of this report.
Video Link: Click this link to watch the HDIN analyst briefing on YouTube.
About HDIN Research:
HDIN Research is a premier global market intelligence and strategic advisory firm specializing in institutional-grade financial analysis, supply chain audits, and macroeconomic forecasting. Our dedicated sector analysts deliver actionable, data-driven insights tailored for private equity, hedge funds, and corporate strategy teams. Visit us at http://www.hdinresearch.com.
2026 AI Transparency Footer:
"This intelligence report was authored by HDIN Research analysts following a rigorous audit of official corporate filings. AI was utilized for massive-scale data synthesis and structural drafting, ensuring 100% inclusion of reported data points. All strategic insights, financial modeling, and final verdicts were verified by our editorial board to ensure professional accuracy and compliance with 2026 Google Search E-E-A-T standards."
1. IQM Quantum Computers [NASDAQ: IQM] expanded FY2025 revenue by 90.7% YoY to $35.43 million (€31.33 million), supported by a $76.11 million backlog and $399.18 million in pro forma liquidity providing 5.1 years of runway.
2. European public institutions generated 87.3% of revenue, with 74.6% ($26.44 million) concentrated across four sovereign entities.
3. Industrial scaling faces single-source cryogenic constraints from Bluefors and a 313% spike in customer performance guarantees to $15.07 million (€13.33 million).
Figure IQM Quantum Computers Oyj (Nasdaq lQMX) Investment & strategy Audit
Financial Mechanics and Segmental Revenue DynamicsIQM Quantum Computers [NASDAQ: IQM] expanded top-line consolidated revenue to $35.43 million (€31.33 million) in FY2025, representing a 90.7% year-over-year increase from $18.58 million (€16.44 million) in FY2024. Revenue generation remains structurally skewed toward physical, on-premises system deliveries. Dedicated quantum hardware sales generated $34.58 million (€30.59 million), while post-installation professional services contributed $0.13 million (€0.11 million), combining to represent 98.0% of total customer contract revenue.
In contrast, recurring Quantum-as-a-Service (QaaS) delivered through the IQM Resonance platform and AWS Braket generated $0.32 million (€0.28 million). Although QaaS registered 492% year-over-year growth, it comprised 0.9% of total contract revenue. Government-funded scientific co-development projects contributed $0.39 million (€0.35 million), or 1.1% of customer contract revenue. Non-dilutive operating grants, categorized separately as "Other Operating Income," yielded $3.80 million (€3.36 million) in FY2025, down from $4.36 million (€3.85 million) in FY2024.
Gross profit rose 194.6% YoY to $16.94 million (€14.98 million), expanding gross margin by 1,690 basis points from 30.9% in FY2024 to 47.8% in FY2025 due to initial manufacturing fixed-cost absorption. Cost of revenue grew 44.0% YoY to $18.49 million. Research and development expenses reached $57.29 million (€50.68 million), up 19.5% YoY, though R&D intensity decreased from 258.1% of revenue in FY2024 to 161.7% in FY2025. Selling, General, and Administrative (SG&A) expenses totaled $27.53 million (€24.35 million), decreasing from 102.5% of revenue to 77.7% YoY. Operating losses expanded 16.1% YoY to $65.65 million (€58.06 million), while net loss remained stable at $61.49 million (€54.39 million), buffered by an $8.07 million (€7.14 million) fair value gain from the extinguishment of a convertible loan derivative.
Operating cash outflows expanded 44.9% YoY to $64.67 million (€57.20 million). Total capital expenditures held flat at $13.04 million (€11.54 million), resulting in an annual Free Cash Flow (FCF) burn rate of $77.71 million (€68.73 million). IQM closed FY2025 with $165.68 million (€146.54 million) in cash. Combined with $233.5 million in net proceeds from its July 2026 SPAC merger and PIPE transaction, pro forma total cash reached ~$399.18 million, establishing a 5.1-year operational cash runway at current burn levels.
Table Consolidated Financial Performance, Cash Flow Profile, and Liquidity Position (FY2024–FY2025)
| Financial Metric (USD) | FY 2024 | FY 2025 | YoY Change (%) / Basis Points |
| Total Contract Revenue | $18.58M | $35.43M | +90.7% |
| Cost of Revenue | $(12.84)M | $(18.49)M | +44.0% |
| Gross Profit | $5.75M | $16.94M | +194.6% |
| Gross Margin (%) | 30.9% | 47.8% | +1,690 bps |
| R&D Expenses | $(47.96)M | $(57.29)M | +19.5% |
| R&D (% of Revenue) | 258.1% | 161.7% | -9,640 bps |
| SG&A Expenses | $(19.05)M | $(27.53)M | +44.5% |
| SG&A (% of Revenue) | 102.5% | 77.7% | -2,480 bps |
| Operating Loss | $(56.57)M | $(65.65)M | +16.1% |
| Net Loss | $(61.17)M | $(61.49)M | +0.5% |
| Operating Cash Flow | $(44.62)M | $(64.67)M | +44.9% |
| Capital Expenditures | $(13.00)M | $(13.04)M | +0.3% |
| Free Cash Flow Burn | $(57.62)M | $(77.71)M | +34.9% |
| Cash & Cash Equivalents | $19.50M | $165.68M | +749.6% |
| Pro Forma Total Cash | N/A | ~$399.18M | N/A |
| Current Ratio | 1.30x | 5.09x | N/A |
Industrial Footprint, Supply Chain Single-Points, and Risk Architecture
IQM maintains a vertically integrated hardware manufacturing footprint centered in Europe. Its primary fabrication unit (Fab) in Espoo, Finland, utilizes 200-millimeter silicon wafers to manufacture, package, and 3D-integrate superconducting microchips, operating alongside an integrated assembly line for system-level testing. QaaS operations and internal cloud testing are run out of a dedicated data center in Munich, Germany, connected to the Leibniz Supercomputing Centre (LRZ) ecosystem.
Geographically, Europe accounted for 87.3% ($30.93 million) of FY2025 revenue:
* Finland: $12.97 million (€11.47 million), representing 36.6% of revenue.
* Italy: $8.27 million (€7.32 million), representing 23.3% of revenue.
* Germany: $7.33 million (€6.48 million), representing 20.7% of revenue.
* Czech Republic: $2.36 million (€2.09 million), representing 6.7% of revenue.
* Asia-Pacific (Taiwan, Province of China): $2.30 million (€2.03 million), representing 6.5% of revenue.
* Other Regions: $2.20 million (€1.95 million), representing 6.2% of revenue.
Customer concentration is structurally absolute. Although unique customers expanded from 8 to 22 in FY2025, public-sector entities generated 99.5% of revenue. Four institutional accounts generated 74.6% ($26.44 million / €23.39 million) of total revenue: Customer 1 contributed $6.82 million (€6.03 million), Customer 2 contributed $2.36 million (€2.09 million), Customer 3 contributed $10.14 million (€8.97 million), and Customer 4 contributed $7.12 million (€6.30 million).
Supply chain dependencies expose single-point operational vulnerabilities. Cryogenic dilution refrigerators operating in the millikelvin range are single-sourced from Bluefors in Finland, with system scaling constrained by global supplies of helium and helium-3 gas. Semiconductor processing depends on 200mm silicon wafers, low-noise microwave components, CPUs, GPUs, and FPGAs. FY2025 PP&E capital expenditures of $13.04 million (€11.54 million) were heavily weighted toward expansion rather than maintenance:
* Machinery & Equipment: $6.98 million (€6.18 million).
* Leasehold Improvements (Cleanrooms): $5.14 million (€4.55 million).
* Office & Other Equipment: $0.085 million (€0.075 million).
* Contractual CapEx Commitments: $8.71 million (€7.70 million).
Intellectual property defenses consist of 170 active patent families (339 total applications, 130 granted patents, and 48 unpublished utility applications), supplemented by 25 trade secrets, 8 registered utility models, 14 design registrations, and 44 trademarks. Joint IP ownership with spin-off institutions Aalto University and VTT carries march-in rights and potential commercial royalty obligations. IQM employs over 380 staff (50%, or ~190, in R&D). Talent retention utilizes four-year ESOP vesting schedules with a one-year cliff.
Off-balance-sheet exposures expanded as performance and advance payment guarantees issued to hardware customers rose 313% YoY to $15.07 million (€13.33 million), up from $3.65 million (€3.22 million) in 2024. Active legal provisions stood at $67.8k (€60k), with warranty provisions at $113k (€100k). On governance, CFO Jan Kürschner is leading remediation for identified ICFR material weaknesses spanning IT General Controls, IFRS/SEC financial reporting expertise, and segregation of duties.
Post-SPAC capital structure comprises 188,692,107 ordinary shares with single-class voting rights: Legacy Shareholders hold 84.7% (159,762,360 shares), PIPE Investors hold 7.7% (14,548,000 shares for $145.5 million gross proceeds), Public Shareholders hold 5.3% (10,006,747 shares), and Sponsor Insiders hold 2.3% (4,375,000 shares). Fully exercised options and warrants (32,603,100 units, including 19,056,614 under ESOP pools) represent a potential ~17.3% dilution overhang.
HDIN Institutional Verdict
IQM’s operational expansion reflects a classic hardware-first infrastructure monetization model. The 90.7% top-line acceleration and 55% surge in unfulfilled order backlog to $76.11 million (€67.32 million) provide forward revenue visibility over a 12-to-18-month delivery horizon. However, the company’s near-total reliance on sovereign European research grants and public sector HPC procurements (99.5% of revenue) highlights the absence of commercial enterprise adoption.
EBITDA health remains artificially buffered by gross grant accounting: removing $3.80 million in operating subsidies expands FY2025 operating losses from $65.65 million to $69.45 million. Furthermore, recognizing revenue on a cost-to-cost input basis over 12-to-18-month cycles, paired with a 313% surge in off-balance-sheet performance guarantees to $15.07 million, leaves gross margins exposed to delivery delays and component bottlenecks from single-source vendors like Bluefors.
While a $399.18 million pro forma cash balance insulates IQM from near-term capital markets volatility, long-term equity performance depends on converting its 5-qubit Spark and 20-to-150-qubit Radiance installed base into high-margin QaaS revenue and scaling its next-generation >150-qubit Halocene system toward commercially viable fault-tolerant benchmarks.
Presentation Download & Video Access:
Presentation Download: Click the PDF download link under 'Related Topics' to access the full institutional presentation of this report.
Video Link: Click this link to watch the HDIN analyst briefing on YouTube.
About HDIN Research:
HDIN Research is a premier global market intelligence and strategic advisory firm specializing in institutional-grade financial analysis, supply chain audits, and macroeconomic forecasting. Our dedicated sector analysts deliver actionable, data-driven insights tailored for private equity, hedge funds, and corporate strategy teams. Visit us at http://www.hdinresearch.com.
2026 AI Transparency Footer:
"This intelligence report was authored by HDIN Research analysts following a rigorous audit of official corporate filings. AI was utilized for massive-scale data synthesis and structural drafting, ensuring 100% inclusion of reported data points. All strategic insights, financial modeling, and final verdicts were verified by our editorial board to ensure professional accuracy and compliance with 2026 Google Search E-E-A-T standards."