Coforge Limited: AI-Native Engineering Shift and Encora M&A Push FY27 Run-Rate to $2.5B Amid Margin Accretion
Date : 2026-08-05
Reading : 168
HDIN Executive Takeaways
1. Coforge Limited [NSE: COFORGE / BSE: 532541] expanded FY26 consolidated revenue by 35.9% YoY to $1,882.2 million, expanding EBITDA margins 431 basis points to 18.6%.
2. Post-FY26 integration of Encora ($1,954.5 million) adds ~9,500 staff across Latin America and Eastern Europe, positioning the FY27 revenue run-rate toward $2,500.0 million.
3. Balance sheet risk remains insulated via a 0.04x Debt-to-Equity ratio, despite a $550.0 million syndicated facility backing M&A and unbilled receivables expanding to $175.0 million.
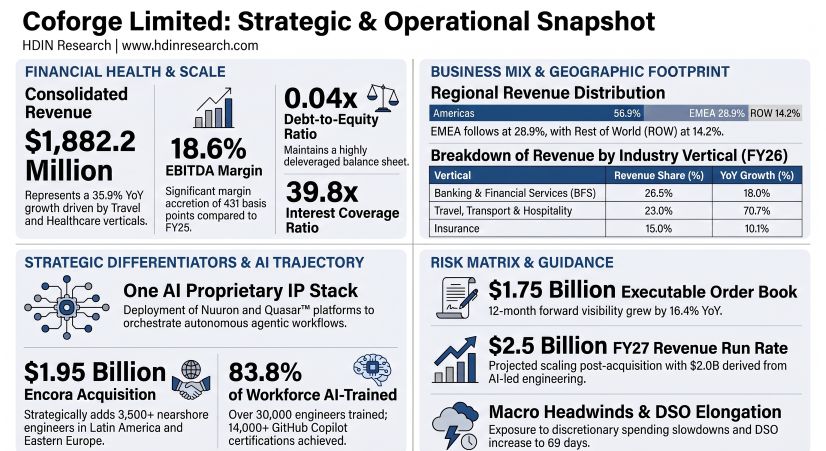
Figure Coforge Limited Strategic & Operational Snapshot
 Segmental Realities, Margin Accretion, and Capital Allocation
Coforge Limited [NSE: COFORGE / BSE: 532541] reported consolidated FY26 revenue of $1,882.2 million (INR 164,027 million), reflecting a 35.9% YoY top-line expansion compared to $1,385.4 million (INR 120,733 million) in FY25 (converted at the fixed rate of 1 USD = 87.1468 INR). Profitability metrics expanded across operating levels: Gross Margin reached 33.8% (up from 33.7% in FY25), EBIT margin expanded by 370 basis points to 14.4%, and EBITDA surged 76.9% YoY to $349.6 million (INR 30,464 million), lifting the EBITDA margin by 431 basis points to 18.6%. Consolidated Profit After Tax (PAT) expanded 91.6% YoY to $178.5 million (INR 15,557 million), driving net profit margin expansion of 276 basis points to 9.5%.
The revenue mix reflects structural vertical diversification away from traditional banking dependencies toward hyper-scaling engineering verticals.
Geographic reporting segments were consolidated in FY26 from four regions into three reportable segments:
* Americas: Generates $1,071.1 million (INR 93,344 million), representing 56.9% of total revenue. The region delivered an EBIT of $181.2 million (INR 15,788 million), remaining the company's highest-margin territory.
* Europe, Middle East, and Africa (EMEA): Generates $544.2 million (INR 47,425 million), contributing 28.9% of total revenue.
* Rest of World (ROW): Generates $266.9 million (INR 23,258 million), accounting for 14.2% of total revenue, expanding from 11.5% in FY25 through client expansion in Australia, Singapore, and Japan.
Contract delivery constructs show Time-and-Material (including fixed capacity) delivering $998.5 million (INR 87,017 million) or 53.1% of revenue, while Fixed-Price (including transaction and outcome-based) contributed $883.7 million (INR 77,010 million) or 46.9% of revenue.
Capital efficiency ratios showed marked gains: Return on Equity (ROE) expanded from 11.7% in FY25 to 17.3% (reported up to 17.4%), while Return on Capital Employed (ROCE) rose from 7.0% to 9.7%. Operating Cash Flow (OCF) reached $205.6 million (INR 17,917 million), and Free Cash Flow (FCF) reached $137.3 million (INR 11,966 million), yielding an FCF-to-EBITDA conversion ratio of 39.3%. Balance sheet liquidity remains insulated with cash and cash equivalents of $125.5 million (INR 10,936 million) and net worth (excluding minority interest) of $1,094.4 million (INR 95,376 million). Leverage remains nominal with a Debt-to-Equity ratio of 0.04x (down from 0.09x in FY25), short-term borrowings of $32.5 million (INR 2,830 million), an Interest Service Coverage Ratio of 39.8x, and a Current Ratio of 1.6x.
Global Footprint, Nearshore Engineering, and AI Ecosystem
Coforge operates 54 global delivery centers across 32 countries with a closing organic workforce of 35,777 professionals (net organic addition of 2,754 personnel in FY26). Fresh graduate hiring via the Graduate Engineering Training (GET) program onboarded 950+ graduates and trained 720+ engineers. Annualized revenue per employee reached $52,609. Last Twelve Months (LTM) IT attrition stood at 10.8%, while total statutory permanent employee turnover was reported at 19%.
The delivery model relies on nearshore expansion and targeted inorganic integration:
* Cigniti Technologies Amalgamation: Effective April 1, 2025, integrated via the pooling of interests method. The integration allowed the reversal of $18.49 million (INR 1,611 million) in unamortized deferred tax liabilities on intangibles and added the BlueSwan® AI-led digital assurance platform.
* Encora Group Acquisition: Executed post-FY26 for a valuation of $1,954.5 million (INR 170,326 million) via a share swap. The transaction scales total workforce past 40,000, adding ~9,500 personnel, including 3,500+ nearshore engineers across Latin America and Eastern Europe.
* Domestic India Footprint: Primary hubs in Greater Noida and Hyderabad are augmented by Tier-2/satellite locations in Kolhapur and Pune. Backup infrastructure rightsizing at Greater Noida reduced connected load by ~1,700 KVA, yielding 48,000 kWh in annual electricity savings. Scope 2 emissions dropped ~83% following the campus shift to 100% renewable energy via a 75 kW captive solar plant in November 2024.
The enterprise Go-To-Market (GTM) framework is fortified by hyperscaler and platform alliances:
* Hyperscalers: Achieved Microsoft Solution Partner status across all six designations. Coforge Quasar™ operates as a multi-model orchestration plane across Azure AI, AWS Bedrock, and Google Vertex AI.
* Platforms: Maintains a ServiceNow Center of Excellence (CoE) with 200+ consultants (Elite Segment Partner), recognized as Salesforce "Market Expansion Partner of the Year 2025", and holds partnerships with Pega, Appian, Databricks, Snowflake, and an R&D partnership with HP/NVIDIA for Physical AI infrastructure.
* IP and Talent Certification: Patented IP includes Copasys (QA automation), alongside Data4AI/AI4Data accelerators and Decision Fabric context graphs. Out of 35,777 employees, 30,000+ engineers (~83.8%) were trained on AI, securing 14,000+ GitHub Copilot certifications, 15,500+ "Deliver AI 2.0" completions, 1,300+ AgentForce AI certifications, and 22,000+ hyperscaler certifications. GitHub Copilot pilots yielded code generation speed improvements of 25%.
Order intake dynamics demonstrate high forward visibility. Fresh order intake for FY26 reached $2.26 billion. Normalized against the FY25 intake of $3.45 billion/$3.50 billion (which contained a singular 13-year, $1.56 billion contract with Sabre), core order intake grew 19% YoY from the normalized FY25 base of $1.89 billion. The 12-month executable order book expanded 16.4% YoY to $1.75 billion. The company signed 21 large deals in FY26 (Q1: 5, Q2: 5, Q3: 6, Q4: 5), including a $158 million five-year contract with a UK client. Total active clients stand at 260 (61 Forbes Global 1000 accounts), with a 95.5% repeat business rate and average tenure for Top 10 clients exceeding 10 years. Forward guidance projects FY27 revenue run-rate to scale to ~$2.5 billion, with ~$2.0 billion driven by AI-led engineering, cloud, and data services (including $1.25 billion in AI product engineering).
HDIN Institutional Verdict
While management’s narrative emphasizes AI-driven transformation and operating leverage, forensic analysis of the consolidated balance sheet and cash flow statements highlights key operational friction points:
Working capital efficiency showed structural stretching as Days Sales Outstanding (DSO) elongated from 60 days to 69 days. Gross trade receivables closed at $573.25 million (INR 49,955 million; $455.55 million current, $97.28 million non-current), containing $175.00 million (INR 15,250 million) in unbilled revenue. Client concentration risk in working capital is notable: a single client accounts for 17% of total outstanding trade receivables and contract assets, tied to a multi-year outcome-based contract scheduled for billing over 2 to 4 years. Total Expected Credit Loss (ECL) allowance reached $21.11 million (INR 1,840 million; $20.40 million against receivables, $0.71 million against contract assets), with a net P&L impairment charge of $3.90 million (INR 340 million) taken in FY26.
Subcontractor reliance expanded significantly. Consolidated subcontractor costs rose to $208.68 million (INR 18,186 million) from $120.82 million (INR 10,529 million) in FY25, expanding from 8.72% to 11.09% of revenue (a 237 basis point increase). This confirms that short-term delivery of specialized digital transformation mandates required external high-cost talent, partially offsetting internal AI productivity gains.
Off-balance-sheet items, litigation provisions, and capital structures include:
* Cybersecurity Litigation Provision: Coforge recognized a one-time exceptional legal cost provision of $5.11 million (INR 445 million) in FY26. This relates to defending a US class-action lawsuit following an incident where threat actors manipulated outsourced Service Desk agents to reset passwords and exfiltrate a client's loyalty database.
* Contingent Tax Liabilities: Total contingent liabilities not acknowledged as debt stood at $10.84 million (INR 945 million), down from $12.58 million in FY25. This includes $6.64 million (INR 579 million) in disputed income tax transfer pricing and tax holiday matters, alongside $4.20 million (INR 366 million) in other claims.
* Debt Structuring for Encora: To finance the $1.95 billion Encora transaction and refinance existing debt, Coforge created a charge/hypothecation on current and movable assets under Section 180(1)(a) of the Companies Act (Item 5 of 34th AGM Notice, scheduled for August 24, 2026). This secures a $550.0 million syndicated term loan facility backed by J.P. Morgan, Bank of America, Citibank, HSBC, and BNP Paribas.
* Leases & Commitments: Capital commitments contracted but not recognized dropped to $1.66 million (INR 145 million) from $36.20 million in FY25. Outstanding corporate guarantees issued on behalf of overseas subsidiaries totaled $94.07 million (INR 8,198 million). Right-of-Use (ROU) assets were capitalized at $35.07 million (INR 3,056 million), matched by lease liabilities of $37.65 million (INR 3,281 million; $12.55 million current, $25.09 million non-current).
* Goodwill Impairment Testing: Consolidated Goodwill stands at $478.18 million (INR 41,671 million), dominated by Cigniti Americas ($297.27 million) and BPS Americas ($70.52 million), alongside intangible assets of $154.26 million (INR 13,443 million). DCF impairment models for Cigniti Americas model a 14% revenue CAGR, a 19% operating margin (up from 16%), and a 14% pre-tax discount rate, resulting in zero impairment charges for FY26.
Governance structures maintain compliance: Board independence stands at 55.56% (5 of 9 directors are Independent Directors), chaired by Independent Director O P Bhatt (whose second 5-year term extension from 2027 to 2032 is submitted for shareholder approval under Special Resolution Item 4). CEO Sudhir Singh's FY26 remuneration reached $6.40 million (INR 558.05 million), with over 83% tied to variable metrics ($4.54 million in stock options, $0.79 million in performance bonuses). KMP transitions saw Executive Director Gautam Samanta resign on October 10, 2025, succeeded by John Robert Speight. ESG metrics confirmed Scope 1 emissions of 1,570 tCO2e, Scope 2 of 1,039 tCO2e, Scope 3 of 36,315 tCO2e, energy consumption of 60,050 GJ, water withdrawal of 139,298 KL, zero occupational fatalities, and 1,393,527 total training hours.
Presentation Download & Video Access:
- Presentation Download: Click the PDF download link under 'Related Topics' to access the full institutional presentation of this report.
- Video Link: Click this link to watch the HDIN analyst briefing on YouTube.
About HDIN Research:
HDIN Research is a premier global market intelligence and strategic advisory firm specializing in institutional-grade financial analysis, supply chain audits, and macroeconomic forecasting. Our dedicated sector analysts deliver actionable, data-driven insights tailored for private equity, hedge funds, and corporate strategy teams. Visit us at http://www.hdinresearch.com.
2026 AI Transparency Footer:
"This intelligence report was authored by HDIN Research analysts following a rigorous audit of official corporate filings. AI was utilized for massive-scale data synthesis and structural drafting, ensuring 100% inclusion of reported data points. All strategic insights, financial modeling, and final verdicts were verified by our editorial board to ensure professional accuracy and compliance with 2026 Google Search E-E-A-T standards."
1. Coforge Limited [NSE: COFORGE / BSE: 532541] expanded FY26 consolidated revenue by 35.9% YoY to $1,882.2 million, expanding EBITDA margins 431 basis points to 18.6%.
2. Post-FY26 integration of Encora ($1,954.5 million) adds ~9,500 staff across Latin America and Eastern Europe, positioning the FY27 revenue run-rate toward $2,500.0 million.
3. Balance sheet risk remains insulated via a 0.04x Debt-to-Equity ratio, despite a $550.0 million syndicated facility backing M&A and unbilled receivables expanding to $175.0 million.
Figure Coforge Limited Strategic & Operational Snapshot
Segmental Realities, Margin Accretion, and Capital AllocationCoforge Limited [NSE: COFORGE / BSE: 532541] reported consolidated FY26 revenue of $1,882.2 million (INR 164,027 million), reflecting a 35.9% YoY top-line expansion compared to $1,385.4 million (INR 120,733 million) in FY25 (converted at the fixed rate of 1 USD = 87.1468 INR). Profitability metrics expanded across operating levels: Gross Margin reached 33.8% (up from 33.7% in FY25), EBIT margin expanded by 370 basis points to 14.4%, and EBITDA surged 76.9% YoY to $349.6 million (INR 30,464 million), lifting the EBITDA margin by 431 basis points to 18.6%. Consolidated Profit After Tax (PAT) expanded 91.6% YoY to $178.5 million (INR 15,557 million), driving net profit margin expansion of 276 basis points to 9.5%.
The revenue mix reflects structural vertical diversification away from traditional banking dependencies toward hyper-scaling engineering verticals.
| Vertical Breakdown | FY26 Revenue ($M) | FY26 Revenue (INR M) | Vertical Share (%) | YoY Growth (%) |
| Banking and Financial Services (BFS) | $498.8 | INR 43,468 | 26.5% | +18.0% |
| Travel, Transportation & Hospitality | $432.9 | INR 37,726 | 23.0% | +70.7% |
| Insurance | $282.3 | INR 24,604 | 15.0% | +10.1% |
| Healthcare and Hi-Tech | $203.3 | INR 17,715 | 10.8% | +109.0% |
| Government (Outside India) | $131.8 | INR 11,486 | 7.0% | +23.2% |
| Others (Retail, Manufacturing, etc.) | $333.1 | INR 29,028 | 17.7% | +34.2% |
| Total Consolidated Revenue | $1,882.2 | INR 164,027 | 100.0% | +35.9% |
Geographic reporting segments were consolidated in FY26 from four regions into three reportable segments:
* Americas: Generates $1,071.1 million (INR 93,344 million), representing 56.9% of total revenue. The region delivered an EBIT of $181.2 million (INR 15,788 million), remaining the company's highest-margin territory.
* Europe, Middle East, and Africa (EMEA): Generates $544.2 million (INR 47,425 million), contributing 28.9% of total revenue.
* Rest of World (ROW): Generates $266.9 million (INR 23,258 million), accounting for 14.2% of total revenue, expanding from 11.5% in FY25 through client expansion in Australia, Singapore, and Japan.
Contract delivery constructs show Time-and-Material (including fixed capacity) delivering $998.5 million (INR 87,017 million) or 53.1% of revenue, while Fixed-Price (including transaction and outcome-based) contributed $883.7 million (INR 77,010 million) or 46.9% of revenue.
Capital efficiency ratios showed marked gains: Return on Equity (ROE) expanded from 11.7% in FY25 to 17.3% (reported up to 17.4%), while Return on Capital Employed (ROCE) rose from 7.0% to 9.7%. Operating Cash Flow (OCF) reached $205.6 million (INR 17,917 million), and Free Cash Flow (FCF) reached $137.3 million (INR 11,966 million), yielding an FCF-to-EBITDA conversion ratio of 39.3%. Balance sheet liquidity remains insulated with cash and cash equivalents of $125.5 million (INR 10,936 million) and net worth (excluding minority interest) of $1,094.4 million (INR 95,376 million). Leverage remains nominal with a Debt-to-Equity ratio of 0.04x (down from 0.09x in FY25), short-term borrowings of $32.5 million (INR 2,830 million), an Interest Service Coverage Ratio of 39.8x, and a Current Ratio of 1.6x.
Global Footprint, Nearshore Engineering, and AI Ecosystem
Coforge operates 54 global delivery centers across 32 countries with a closing organic workforce of 35,777 professionals (net organic addition of 2,754 personnel in FY26). Fresh graduate hiring via the Graduate Engineering Training (GET) program onboarded 950+ graduates and trained 720+ engineers. Annualized revenue per employee reached $52,609. Last Twelve Months (LTM) IT attrition stood at 10.8%, while total statutory permanent employee turnover was reported at 19%.
The delivery model relies on nearshore expansion and targeted inorganic integration:
* Cigniti Technologies Amalgamation: Effective April 1, 2025, integrated via the pooling of interests method. The integration allowed the reversal of $18.49 million (INR 1,611 million) in unamortized deferred tax liabilities on intangibles and added the BlueSwan® AI-led digital assurance platform.
* Encora Group Acquisition: Executed post-FY26 for a valuation of $1,954.5 million (INR 170,326 million) via a share swap. The transaction scales total workforce past 40,000, adding ~9,500 personnel, including 3,500+ nearshore engineers across Latin America and Eastern Europe.
* Domestic India Footprint: Primary hubs in Greater Noida and Hyderabad are augmented by Tier-2/satellite locations in Kolhapur and Pune. Backup infrastructure rightsizing at Greater Noida reduced connected load by ~1,700 KVA, yielding 48,000 kWh in annual electricity savings. Scope 2 emissions dropped ~83% following the campus shift to 100% renewable energy via a 75 kW captive solar plant in November 2024.
The enterprise Go-To-Market (GTM) framework is fortified by hyperscaler and platform alliances:
* Hyperscalers: Achieved Microsoft Solution Partner status across all six designations. Coforge Quasar™ operates as a multi-model orchestration plane across Azure AI, AWS Bedrock, and Google Vertex AI.
* Platforms: Maintains a ServiceNow Center of Excellence (CoE) with 200+ consultants (Elite Segment Partner), recognized as Salesforce "Market Expansion Partner of the Year 2025", and holds partnerships with Pega, Appian, Databricks, Snowflake, and an R&D partnership with HP/NVIDIA for Physical AI infrastructure.
* IP and Talent Certification: Patented IP includes Copasys (QA automation), alongside Data4AI/AI4Data accelerators and Decision Fabric context graphs. Out of 35,777 employees, 30,000+ engineers (~83.8%) were trained on AI, securing 14,000+ GitHub Copilot certifications, 15,500+ "Deliver AI 2.0" completions, 1,300+ AgentForce AI certifications, and 22,000+ hyperscaler certifications. GitHub Copilot pilots yielded code generation speed improvements of 25%.
Order intake dynamics demonstrate high forward visibility. Fresh order intake for FY26 reached $2.26 billion. Normalized against the FY25 intake of $3.45 billion/$3.50 billion (which contained a singular 13-year, $1.56 billion contract with Sabre), core order intake grew 19% YoY from the normalized FY25 base of $1.89 billion. The 12-month executable order book expanded 16.4% YoY to $1.75 billion. The company signed 21 large deals in FY26 (Q1: 5, Q2: 5, Q3: 6, Q4: 5), including a $158 million five-year contract with a UK client. Total active clients stand at 260 (61 Forbes Global 1000 accounts), with a 95.5% repeat business rate and average tenure for Top 10 clients exceeding 10 years. Forward guidance projects FY27 revenue run-rate to scale to ~$2.5 billion, with ~$2.0 billion driven by AI-led engineering, cloud, and data services (including $1.25 billion in AI product engineering).
HDIN Institutional Verdict
While management’s narrative emphasizes AI-driven transformation and operating leverage, forensic analysis of the consolidated balance sheet and cash flow statements highlights key operational friction points:
| Working Capital & Risk Metric | FY2026 Value | Operational / Risk Analysis |
|---|---|---|
| Days Sales Outstanding (DSO) | 69 days (↑9 days YoY from 60 days in FY25) | Working capital pressure increased — Longer collection cycles indicate slower customer payments and higher cash tied up in receivables |
| Unbilled Receivables Balance | $175.00M / INR 15,250M (included in $573.25M gross receivables and contract assets) | Revenue recognition and cash conversion risk — Large unbilled receivables balance requires close monitoring of contract milestones and customer acceptance |
| Single-Client Receivables Concentration | 17% of total trade receivables & contract assets | Customer concentration exposure — A significant portion of receivables depends on one customer’s payment performance |
| Subcontractor Revenue Ratio | 11.09% ($208.68M) vs. 8.72% ($120.82M) in FY25 | Higher external execution dependence — Increased subcontracting may improve scalability but could introduce margin pressure and delivery risks |
| Exceptional Legal Provision | $5.11M / INR 445M related to US Service Desk breach litigation | Non-recurring profitability impact — Legal exposure creates additional cost burden and highlights operational compliance risks |
| Syndicated Credit Facility | $550.00M loan facility arranged by JPMorgan Chase, Bank of America, Citigroup, HSBC, and BNP Paribas | Provides liquidity support but increases financing obligations — Debt capacity strengthens balance sheet flexibility while requiring disciplined leverage management |
Working capital efficiency showed structural stretching as Days Sales Outstanding (DSO) elongated from 60 days to 69 days. Gross trade receivables closed at $573.25 million (INR 49,955 million; $455.55 million current, $97.28 million non-current), containing $175.00 million (INR 15,250 million) in unbilled revenue. Client concentration risk in working capital is notable: a single client accounts for 17% of total outstanding trade receivables and contract assets, tied to a multi-year outcome-based contract scheduled for billing over 2 to 4 years. Total Expected Credit Loss (ECL) allowance reached $21.11 million (INR 1,840 million; $20.40 million against receivables, $0.71 million against contract assets), with a net P&L impairment charge of $3.90 million (INR 340 million) taken in FY26.
Subcontractor reliance expanded significantly. Consolidated subcontractor costs rose to $208.68 million (INR 18,186 million) from $120.82 million (INR 10,529 million) in FY25, expanding from 8.72% to 11.09% of revenue (a 237 basis point increase). This confirms that short-term delivery of specialized digital transformation mandates required external high-cost talent, partially offsetting internal AI productivity gains.
Off-balance-sheet items, litigation provisions, and capital structures include:
* Cybersecurity Litigation Provision: Coforge recognized a one-time exceptional legal cost provision of $5.11 million (INR 445 million) in FY26. This relates to defending a US class-action lawsuit following an incident where threat actors manipulated outsourced Service Desk agents to reset passwords and exfiltrate a client's loyalty database.
* Contingent Tax Liabilities: Total contingent liabilities not acknowledged as debt stood at $10.84 million (INR 945 million), down from $12.58 million in FY25. This includes $6.64 million (INR 579 million) in disputed income tax transfer pricing and tax holiday matters, alongside $4.20 million (INR 366 million) in other claims.
* Debt Structuring for Encora: To finance the $1.95 billion Encora transaction and refinance existing debt, Coforge created a charge/hypothecation on current and movable assets under Section 180(1)(a) of the Companies Act (Item 5 of 34th AGM Notice, scheduled for August 24, 2026). This secures a $550.0 million syndicated term loan facility backed by J.P. Morgan, Bank of America, Citibank, HSBC, and BNP Paribas.
* Leases & Commitments: Capital commitments contracted but not recognized dropped to $1.66 million (INR 145 million) from $36.20 million in FY25. Outstanding corporate guarantees issued on behalf of overseas subsidiaries totaled $94.07 million (INR 8,198 million). Right-of-Use (ROU) assets were capitalized at $35.07 million (INR 3,056 million), matched by lease liabilities of $37.65 million (INR 3,281 million; $12.55 million current, $25.09 million non-current).
* Goodwill Impairment Testing: Consolidated Goodwill stands at $478.18 million (INR 41,671 million), dominated by Cigniti Americas ($297.27 million) and BPS Americas ($70.52 million), alongside intangible assets of $154.26 million (INR 13,443 million). DCF impairment models for Cigniti Americas model a 14% revenue CAGR, a 19% operating margin (up from 16%), and a 14% pre-tax discount rate, resulting in zero impairment charges for FY26.
Governance structures maintain compliance: Board independence stands at 55.56% (5 of 9 directors are Independent Directors), chaired by Independent Director O P Bhatt (whose second 5-year term extension from 2027 to 2032 is submitted for shareholder approval under Special Resolution Item 4). CEO Sudhir Singh's FY26 remuneration reached $6.40 million (INR 558.05 million), with over 83% tied to variable metrics ($4.54 million in stock options, $0.79 million in performance bonuses). KMP transitions saw Executive Director Gautam Samanta resign on October 10, 2025, succeeded by John Robert Speight. ESG metrics confirmed Scope 1 emissions of 1,570 tCO2e, Scope 2 of 1,039 tCO2e, Scope 3 of 36,315 tCO2e, energy consumption of 60,050 GJ, water withdrawal of 139,298 KL, zero occupational fatalities, and 1,393,527 total training hours.
Presentation Download & Video Access:
- Presentation Download: Click the PDF download link under 'Related Topics' to access the full institutional presentation of this report.
- Video Link: Click this link to watch the HDIN analyst briefing on YouTube.
About HDIN Research:
HDIN Research is a premier global market intelligence and strategic advisory firm specializing in institutional-grade financial analysis, supply chain audits, and macroeconomic forecasting. Our dedicated sector analysts deliver actionable, data-driven insights tailored for private equity, hedge funds, and corporate strategy teams. Visit us at http://www.hdinresearch.com.
2026 AI Transparency Footer:
"This intelligence report was authored by HDIN Research analysts following a rigorous audit of official corporate filings. AI was utilized for massive-scale data synthesis and structural drafting, ensuring 100% inclusion of reported data points. All strategic insights, financial modeling, and final verdicts were verified by our editorial board to ensure professional accuracy and compliance with 2026 Google Search E-E-A-T standards."