Seagate Technology Holdings plc: Nearline Storage Expansion Drives 34.06% Revenue Surge as Mozaic HAMR Ramps Operating Leverage
Date : 2026-08-07
Reading : 407
HDIN Executive Takeaways
1. Seagate Technology Holdings plc [NASDAQ: STX] expanded FY2026 revenue 34.06% YoY to $12.195 billion, generating $3.105 billion in Free Cash Flow and slashing Net Leverage to 0.43x.
2. Mass-capacity nearline shipments scaled 39.84% YoY to 695 exabytes, driving GAAP gross margin expansion to 45.58% despite a $422 million Pillar Two tax impact.
3. Physical operations face severe geographical concentration, with 83.33% of staff in Asia and 27.61% of total footprint situated at a single mega-site in Korat, Thailand.
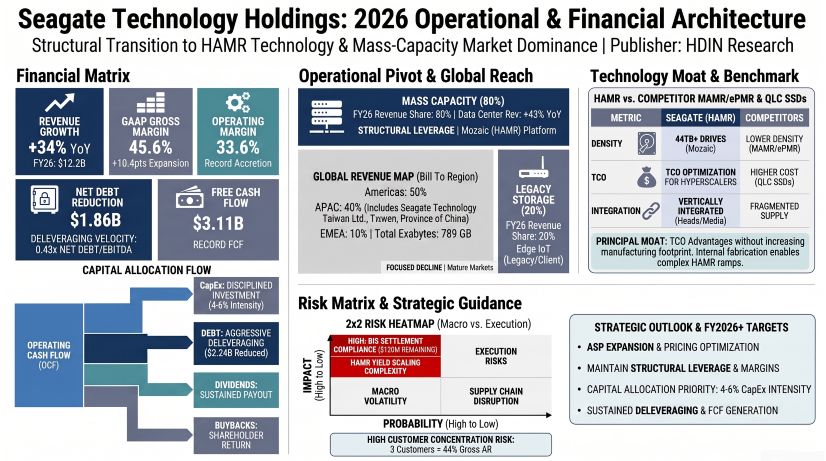
Figure Seagate Technology Holdings: 2026 0perational & Financial Architecture
 Segmental Realities and Operating Leverage
Seagate Technology Holdings plc [NASDAQ: STX] executed a strong operational turnaround in fiscal year 2026 (ended July 3, 2026, a 53-week period). Consolidated top-line revenue expanded 34.06% year-over-year to $12.195 billion, driven by accelerated procurement of nearline storage platforms by hyperscale Cloud Service Providers (CSPs). Operating leverage surged as GAAP Gross Margin expanded 1,040 basis points YoY to 45.58%, up from 35.18% in FY2025 and 23.45% in FY2024.
GAAP Operating Income reached $4.094 billion (+116.6% YoY), yielding an operating margin of 33.57%. This margin expansion absorbed a pre-tax $105 million litigation settlement charge ($175 million total settlement in principle, with $70 million covered by insurance) regarding historic securities class actions. Net income reached $3.184 billion, representing a net margin of 26.11%.
Table Consolidated Financial Performance, Profitability Expansion, and Operational Scale Metrics (FY2024–FY2026)
The company's technology architecture strategy centers on common technology platforms, allowing areal density advancements from its Heat-Assisted Magnetic Recording (HAMR) Mozaic platform to scale across product lines. Consequently, Product Development expenses rose 4.28% YoY to $755 million in FY2026, while R&D intensity contracted to 6.19% of revenue. Under U.S. GAAP, all internal product development costs are expensed as incurred; for tax purposes under U.S. IRC Section 174, research expenditures are capitalized, creating a non-current Deferred Tax Asset of $230 million in FY2026 (up from $110 million in FY2025).
Inventory efficiency metrics reflect a volume ramp for next-generation HAMR platforms. Total net inventories expanded 9.1% YoY to $1.571 billion, driven by a 29.8% surge in Work-in-Process (WIP).
Table Inventory Composition and Year-over-Year Change Analysis (FY2025–FY2026)
Based on a Cost of Revenue of $6.637 billion and average inventory of $1.5055 billion, inventory turnover reached 4.41x, translating to a Days Sales of Inventory (DSI) of 84.2 days on a 371-day fiscal year basis (86.4 days calculated on ending balance).
Balance sheet liquidity strengthened as Cash and Cash Equivalents expanded to $1.704 billion. Net debt fell to $1.861 billion, driving the Net Debt-to-EBITDA ratio down to 0.43x against a maximum debt covenant threshold of 6.75x under its $1.3 billion Revolving Credit Facility (expiring January 30, 2030), providing a 6.32x (93.6%) compliance margin headroom.
Off-balance-sheet commitments remain substantial: unconditional purchase obligations total $2.1 billion ($1.6 billion scheduled for payment in FY2027), capital expenditure commitments stand at $465 million ($375 million due in FY2027), and undiscounted operating lease liabilities total $437 million ($333 million present value).
Regulatory and litigation liabilities include a $120 million balance on the Bureau of Industry and Security (BIS) settlement ($45 million current accrued liability; $75 million non-current) payable in $15 million quarterly installments through FY2028. Unrecognized Tax Benefits (UTBs) expanded 44.9% YoY to $155 million ($43 million recorded as a cash balance sheet liability), coinciding with the adoption of the OECD Pillar Two minimum tax, which imposed a $422 million Qualified Domestic Minimum Top-Up Tax (QDMTT) and elevated the Effective Tax Rate to 13.73%.
Infrastructure Layout and Geopolitical Moats
Seagate Technology Holdings plc operates a vertically integrated manufacturing structure comprising 9.8 million square feet of physical plant globally. Read/write head fabrication is concentrated in Springtown, UK, and Minnesota, USA; media coating is centered in Woodlands, Singapore; substrates are produced in Johor, Malaysia; and drive subassemblies are prepared in Teparuk, Thailand. Final drive assembly and testing are located in Korat, Thailand, and Wuxi, China.
Table Global Manufacturing and Operational Footprint Analysis
This infrastructure configuration creates localized operational risk. The Korat, Thailand facility represents 27.61% of total physical operational space, exposing operations to regional disruption risks. Furthermore, of Seagate's 30,000 global full-time employees, 25,000 (83.33%) are located in Asia.
Geographic revenue audited by bill-from location demonstrates that product shipments originating from the United States generated $6.146 billion (50.40%), Singapore generated $4.880 billion (40.02%), the Netherlands generated $1.165 billion (9.55%), and other locations generated $4.0 million (0.03%).
Customer credit concentration is elevated. In FY2026, a single cloud service provider accounted for 14% ($1.707 billion) of total consolidated revenue. Balance sheet risk is similarly concentrated, with three customers controlling 44% of gross accounts receivable (18%, 16%, and 10%, respectively).
Supply chain risks include sole-source vendor dependencies for ASICs, preamplifiers, spindle motors, and suspension assemblies, alongside raw material reliance on Chinese rare earth elements for spindle motor magnets. Intellectual property protection includes 3,036 active U.S. patents, 226 active foreign patents, 273 pending U.S. applications, and 29 pending foreign applications, countered by active patent infringement litigation from Lambeth Magnetic Structures and Godo Kaisha IP Bridge 1.
HDIN Institutional Verdict
Seagate Technology Holdings plc's execution across FY2026 demonstrates operational leverage, converting high fixed-cost vertical assets into margin expansion as Mass Capacity cloud exabyte demand recovers. The reduction in Net Leverage to 0.43x and the generation of $3.105 billion in Free Cash Flow provide balance sheet flexibility to support the Mozaic HAMR volume ramp.
However, institutional investors must monitor structural exposures: the operational reliance on a single 2.7 million square foot assembly facility in Korat, Thailand, supplier dependencies for rare earth elements and sole-source ASICs, and customer concentration where 44% of outstanding receivables sit with three counterparties. Operating success over FY2027 depends on sustaining manufacturing yields and meeting qualification schedules for 44TB+ Mozaic drives without incurring factory underutilization charges or warranty provision expansions.
Presentation Download & Video Access:
- Presentation Download: Click the PDF download link under 'Related Topics' to access the full institutional presentation of this report.
- Video Link: Click this link to watch the HDIN analyst briefing on YouTube.
About HDIN Research:
HDIN Research is a global market intelligence and strategic advisory firm specializing in institutional-grade financial analysis, supply chain audits, and macroeconomic forecasting. Our dedicated sector analysts deliver data-driven insights tailored for private equity, hedge funds, and corporate strategy teams. Visit us at http://www.hdinresearch.com.
2026 AI Transparency Footer:
"This intelligence report was authored by HDIN Research analysts following a rigorous audit of official corporate filings. AI was utilized for massive-scale data synthesis and structural drafting, ensuring 100% inclusion of reported data points. All strategic insights, financial modeling, and final verdicts were verified by our editorial board to ensure professional accuracy and compliance with 2026 Google Search E-E-A-T standards."
1. Seagate Technology Holdings plc [NASDAQ: STX] expanded FY2026 revenue 34.06% YoY to $12.195 billion, generating $3.105 billion in Free Cash Flow and slashing Net Leverage to 0.43x.
2. Mass-capacity nearline shipments scaled 39.84% YoY to 695 exabytes, driving GAAP gross margin expansion to 45.58% despite a $422 million Pillar Two tax impact.
3. Physical operations face severe geographical concentration, with 83.33% of staff in Asia and 27.61% of total footprint situated at a single mega-site in Korat, Thailand.
Figure Seagate Technology Holdings: 2026 0perational & Financial Architecture
Segmental Realities and Operating LeverageSeagate Technology Holdings plc [NASDAQ: STX] executed a strong operational turnaround in fiscal year 2026 (ended July 3, 2026, a 53-week period). Consolidated top-line revenue expanded 34.06% year-over-year to $12.195 billion, driven by accelerated procurement of nearline storage platforms by hyperscale Cloud Service Providers (CSPs). Operating leverage surged as GAAP Gross Margin expanded 1,040 basis points YoY to 45.58%, up from 35.18% in FY2025 and 23.45% in FY2024.
GAAP Operating Income reached $4.094 billion (+116.6% YoY), yielding an operating margin of 33.57%. This margin expansion absorbed a pre-tax $105 million litigation settlement charge ($175 million total settlement in principle, with $70 million covered by insurance) regarding historic securities class actions. Net income reached $3.184 billion, representing a net margin of 26.11%.
Table Consolidated Financial Performance, Profitability Expansion, and Operational Scale Metrics (FY2024–FY2026)
| Consolidated Financial & Operational Metric | FY2024 | FY2025 | FY2026 | YoY Change (%) / bps |
| Total Revenue ($M) | $6,551 | $9,097 | $12,195 | +34.06% |
| GAAP Gross Margin (%) | 23.45% | 35.18% | 45.58% | +1,040 bps |
| GAAP Operating Margin (%) | 6.90% | 20.78% | 33.57% | +1,279 bps |
| GAAP Net Income ($M) | $335 | $1,469 | $3,184 | +116.75% |
| Product Development / R&D Expense ($M) | $654 | $724 | $755 | +4.28% |
| R&D Intensity (% of Revenue) | 9.98% | 7.96% | 6.19% | -177 bps |
| Total Hard Disk Drive Exabytes Shipped (EB) | N/A | 595 | 789 | +32.61% |
| Nearline Mass-Capacity Exabytes (EB) | N/A | 497 | 695 | +39.84% |
| Non-Nearline Legacy Exabytes (EB) | N/A | 98 | 94 | -4.08% |
| Blended ASP per Terabyte ($/TB) | N/A | $15.29 | $15.46 | +1.11% |
| Operating Cash Flow ($M) | N/A | $1,083 | $3,674 | +239.24% |
| Capital Expenditures ($M) | N/A | $265 | $569 | +114.72% |
| Free Cash Flow ($M) | $664 | $818 | $3,105 | +279.58% |
| Total Carrying Debt ($M) | N/A | $4,995 | $3,565 | -$1,430M |
| Net Debt / EBITDA Ratio | N/A | 1.92x | 0.43x | -1.49x |
The company's technology architecture strategy centers on common technology platforms, allowing areal density advancements from its Heat-Assisted Magnetic Recording (HAMR) Mozaic platform to scale across product lines. Consequently, Product Development expenses rose 4.28% YoY to $755 million in FY2026, while R&D intensity contracted to 6.19% of revenue. Under U.S. GAAP, all internal product development costs are expensed as incurred; for tax purposes under U.S. IRC Section 174, research expenditures are capitalized, creating a non-current Deferred Tax Asset of $230 million in FY2026 (up from $110 million in FY2025).
Inventory efficiency metrics reflect a volume ramp for next-generation HAMR platforms. Total net inventories expanded 9.1% YoY to $1.571 billion, driven by a 29.8% surge in Work-in-Process (WIP).
Table Inventory Composition and Year-over-Year Change Analysis (FY2025–FY2026)
| Inventory Component ($M) | June 27, 2025 | July 3, 2026 | YoY Variance ($M) | YoY Variance (%) |
| Raw Materials & Components | $374 | $307 | -$67 | -17.9% |
| Work-in-Process (WIP) | $838 | $1,088 | +$250 | +29.8% |
| Finished Goods | $228 | $176 | -$52 | -22.8% |
| Total Inventories, net | $1,440 | $1,571 | +$131 | +9.1% |
Based on a Cost of Revenue of $6.637 billion and average inventory of $1.5055 billion, inventory turnover reached 4.41x, translating to a Days Sales of Inventory (DSI) of 84.2 days on a 371-day fiscal year basis (86.4 days calculated on ending balance).
Balance sheet liquidity strengthened as Cash and Cash Equivalents expanded to $1.704 billion. Net debt fell to $1.861 billion, driving the Net Debt-to-EBITDA ratio down to 0.43x against a maximum debt covenant threshold of 6.75x under its $1.3 billion Revolving Credit Facility (expiring January 30, 2030), providing a 6.32x (93.6%) compliance margin headroom.
Off-balance-sheet commitments remain substantial: unconditional purchase obligations total $2.1 billion ($1.6 billion scheduled for payment in FY2027), capital expenditure commitments stand at $465 million ($375 million due in FY2027), and undiscounted operating lease liabilities total $437 million ($333 million present value).
Regulatory and litigation liabilities include a $120 million balance on the Bureau of Industry and Security (BIS) settlement ($45 million current accrued liability; $75 million non-current) payable in $15 million quarterly installments through FY2028. Unrecognized Tax Benefits (UTBs) expanded 44.9% YoY to $155 million ($43 million recorded as a cash balance sheet liability), coinciding with the adoption of the OECD Pillar Two minimum tax, which imposed a $422 million Qualified Domestic Minimum Top-Up Tax (QDMTT) and elevated the Effective Tax Rate to 13.73%.
Infrastructure Layout and Geopolitical Moats
Seagate Technology Holdings plc operates a vertically integrated manufacturing structure comprising 9.8 million square feet of physical plant globally. Read/write head fabrication is concentrated in Springtown, UK, and Minnesota, USA; media coating is centered in Woodlands, Singapore; substrates are produced in Johor, Malaysia; and drive subassemblies are prepared in Teparuk, Thailand. Final drive assembly and testing are located in Korat, Thailand, and Wuxi, China.
Table Global Manufacturing and Operational Footprint Analysis
| Facility Location | Country / Territory | Status | Square Feet | Operational Footprint Share (%) | Primary Operational Purpose |
| Korat | Thailand | Owned / Leased | 2,706,000 | 27.61% | Drive assembly & test, subassemblies |
| Woodlands | Singapore | Owned / Leased | 1,543,000 | 15.74% | Media fabrication, operations, admin |
| Minnesota | United States | Owned / Leased | 1,157,000 | 11.81% | Read/write head fabrication, R&D |
| Wuxi | China | Leased | 707,000 | 7.21% | Drive assembly & test, subassemblies |
| Johor | Malaysia | Owned | 631,000 | 6.44% | Substrate fabrication |
| California | United States | Leased | 575,000 | 5.87% | Product development, admin, marketing |
| Colorado | United States | Leased | 533,000 | 5.44% | Product development, admin, operations |
| Springtown | United Kingdom | Owned | 479,000 | 4.89% | Read/write head fabrication |
| Teparuk | Thailand | Owned / Leased | 453,000 | 4.62% | Drive subassembly manufacturing |
| Ayer Rajah | Singapore | Leased | 440,000 | 4.49% | Product development, admin, operations |
| Total Global | Global Footprint | Mixed | 9,800,000 | 100.00% | Consolidated Operations Footprint |
This infrastructure configuration creates localized operational risk. The Korat, Thailand facility represents 27.61% of total physical operational space, exposing operations to regional disruption risks. Furthermore, of Seagate's 30,000 global full-time employees, 25,000 (83.33%) are located in Asia.
Geographic revenue audited by bill-from location demonstrates that product shipments originating from the United States generated $6.146 billion (50.40%), Singapore generated $4.880 billion (40.02%), the Netherlands generated $1.165 billion (9.55%), and other locations generated $4.0 million (0.03%).
Customer credit concentration is elevated. In FY2026, a single cloud service provider accounted for 14% ($1.707 billion) of total consolidated revenue. Balance sheet risk is similarly concentrated, with three customers controlling 44% of gross accounts receivable (18%, 16%, and 10%, respectively).
Supply chain risks include sole-source vendor dependencies for ASICs, preamplifiers, spindle motors, and suspension assemblies, alongside raw material reliance on Chinese rare earth elements for spindle motor magnets. Intellectual property protection includes 3,036 active U.S. patents, 226 active foreign patents, 273 pending U.S. applications, and 29 pending foreign applications, countered by active patent infringement litigation from Lambeth Magnetic Structures and Godo Kaisha IP Bridge 1.
HDIN Institutional Verdict
Seagate Technology Holdings plc's execution across FY2026 demonstrates operational leverage, converting high fixed-cost vertical assets into margin expansion as Mass Capacity cloud exabyte demand recovers. The reduction in Net Leverage to 0.43x and the generation of $3.105 billion in Free Cash Flow provide balance sheet flexibility to support the Mozaic HAMR volume ramp.
However, institutional investors must monitor structural exposures: the operational reliance on a single 2.7 million square foot assembly facility in Korat, Thailand, supplier dependencies for rare earth elements and sole-source ASICs, and customer concentration where 44% of outstanding receivables sit with three counterparties. Operating success over FY2027 depends on sustaining manufacturing yields and meeting qualification schedules for 44TB+ Mozaic drives without incurring factory underutilization charges or warranty provision expansions.
Presentation Download & Video Access:
- Presentation Download: Click the PDF download link under 'Related Topics' to access the full institutional presentation of this report.
- Video Link: Click this link to watch the HDIN analyst briefing on YouTube.
About HDIN Research:
HDIN Research is a global market intelligence and strategic advisory firm specializing in institutional-grade financial analysis, supply chain audits, and macroeconomic forecasting. Our dedicated sector analysts deliver data-driven insights tailored for private equity, hedge funds, and corporate strategy teams. Visit us at http://www.hdinresearch.com.
2026 AI Transparency Footer:
"This intelligence report was authored by HDIN Research analysts following a rigorous audit of official corporate filings. AI was utilized for massive-scale data synthesis and structural drafting, ensuring 100% inclusion of reported data points. All strategic insights, financial modeling, and final verdicts were verified by our editorial board to ensure professional accuracy and compliance with 2026 Google Search E-E-A-T standards."