The Procter & Gamble Company [NYSE: PG]: Global Restructuring Accelerates Near Multi-SBU Operations Hubs as $1.8B COGS Savings Offsets Volume Stagnation
Date : 2026-08-07
Reading : 441
HDIN Market Intelligence Brief
1. The Procter & Gamble Company [NYSE: PG] delivered FY2026 Net Sales of $87,032 million (+3.3% YoY, +1.0% Organic) as $1,800 million in manufacturing productivity savings (+180 bps) offset product mix degradation (-120 bps) and 0.0% global volume growth.
2. Adjusted Free Cash Flow Productivity reached 100% ($15,835 million), backed by $6,176 million in Supply Chain Finance obligations that extended supplier payment terms to 60–180 days across 96 global manufacturing hubs.
3. Management committed $3,800 million to acquire Thorne while executing a two-year portfolio restructuring plan targeting up to 7,000 non-manufacturing personnel reductions to protect operating margins.
Segmental Performance Realities and Margin Compression Diagnostics
The Procter & Gamble Company generated consolidated Net Sales of $87,032 million in FY2026 (+3.3% YoY / +3.26%), up from $84,284 million in FY2025 and $84,039 million in FY2024. Organic Sales grew +1.0%, driven by foreign exchange tailwinds of +2.0% and pricing increases of +1.0%, while unit volume (0.0%) and product mix (0.0%) remained unchanged globally. Consolidated GAAP Net Earnings totaled $16,144 million (+0.49% YoY), while Operating Income (EBIT) fell -3.4% to $19,748 million. EBITDA reached $22,908 million ($19,748 million EBIT plus $3,160 million depreciation and amortization).
Diluted GAAP EPS rose +2.0% to $6.62, supported by share repurchases. Core Net Earnings reached $16,786 million (+1.0% YoY), yielding a Core EPS of $6.89 (+1.0%). The reconciliation from GAAP to Non-GAAP Core Net Earnings incorporates $904 million in after-tax non-core incremental restructuring charges under the June 2025 plan, offset by a $261 million after-tax gain ($343 million pre-tax recorded in Corporate) from the January 2026 dissolution of the Glad joint venture.
The company's five Sector Business Units (SBUs) generated $86,112 million in combined segment Net Sales and $16,167 million in combined segment Net Earnings (excluding $919 million in Corporate Net Sales, up +16% YoY, and $(23) million in Corporate Net Earnings):
Table Business Segment Financial Performance and Growth Driver Analysis (FY2026)
* Fabric & Home Care: Anchor brands include Tide, Ariel, Downy, Gain, Cascade, Dawn, Febreze, and Swiffer across 34 dedicated manufacturing hubs. Organic sales grew +1%, relying on pricing (+1%) in mature markets, while private label competition in Europe created volume headwinds.
* Baby, Feminine & Family Care: Anchor brands include Pampers, Always, Tampax, Always Discreet, Bounty, Charmin, and Puffs across 32 manufacturing hubs. Organic sales fell -1% due to North American promotional discounting in Family Care (Bounty and Charmin). Pampers innovation drove a +20% organic sales surge in Greater China. Category shares stand at ~40% for North American paper towels, >25% for bath tissue, >30% for global baby care, and ~30% for global feminine care (>35% in pads/tampons, >15% in adult incontinence).
* Beauty: Anchor brands include Head & Shoulders, Pantene, Rejoice, Old Spice, Secret, Native, Safeguard, Olay, and SK-II across 20 manufacturing hubs. Segment Net Earnings contracted -2% YoY to $2,672 million due to input cost inflation and marketing reinvestment, yielding the lowest margin (16.68%) among SBUs. Volume expanded +4% via European and Latin American hair care innovations, offset by SK-II volume declines in Greater China. Global market shares stand at ~20% in hair care, ~20% in personal care, and ~5% in skin care (Olay), with global category market share losses of 0.5 points in shampoo and 0.6 points in skin care.
* Health Care: Anchor brands include Crest, Oral-B, Vicks, Metamucil, Pepto-Bismol, and Neurobion across 19 manufacturing hubs. Premium power toothbrushes and Crest 3D White generated a +1% product mix gain. Volume fell -2% due to low winter cough/cold incidence impacting Vicks in North America and a mid-teens (~15%) decline in Greater China oral care. Global oral care market share sits at ~30%.
* Grooming: Anchor brands include Gillette, Venus, and Braun across 17 manufacturing hubs. Net margin reached a portfolio-leading 22.10%. Volume fell -1% due to IMEA distributor network shifts, offset by +2% pricing power in North America and Europe and +3% FX tailwinds. Global market shares stand at >60% in blades and razors and ~30% in male grooming appliances, despite a 0.4-point global share contraction.
Gross Margin contracted 100 bps YoY to 50.2%. The gross margin bridge reflects headwinds from unfavorable product mix (-120 bps), product and packaging reinvestments (-70 bps), higher restructuring costs (-60 bps), net tariff impacts (-30 bps), commodity inflation (-20 bps, focused on petroleum resins and pulp), and FX transactional drag (-10 bps). These costs were partially offset by manufacturing productivity savings (+180 bps, or $1,800 million) and pricing actions (+40 bps).
Operating Margin contracted 160 bps YoY to 22.7%. SG&A expenses expanded 59 bps to 27.49% of Net Sales ($23,922 million, up +5.53% YoY). The expansion was driven by an 80 bps increase in marketing spend ($10,200 million, up +10.87% YoY; 11.72% of Net Sales), which generated $2.75 in incremental Net Sales per incremental advertising dollar ($2,748 million sales growth / $1,000 million ad growth). R&D expenditure remained flat at $2,100 million (2.41% of Net Sales). SG&A inflation was mitigated by $1,600 million in organizational overhead productivity savings (+160 bps benefit).
Geographically, the U.S. market generated $41,700 million in Net Sales (+0.24% YoY; 47.9% of consolidated sales) with $13,900 million in long-term assets. International operations delivered $45,300 million in Net Sales (+6.09% YoY; 52.1% of total) with $11,500 million in long-term assets. The top five international markets—Greater China, the U.K., Canada, Japan, and Germany—contributed 21% of consolidated Net Sales (~$18,300 million). Operational entities in Taiwan are designated as Procter & Gamble Taiwan Limited (Taiwan, Province of China) and Procter & Gamble Taiwan Sales Company Limited (Taiwan, Province of China).
Customer concentration remains high: the top ten retail customers accounted for 43% of consolidated Net Sales in FY2026 (43% in FY2025, 42% in FY2024). Walmart Inc. and its affiliates represented 16% of total sales ($13,925 million). End-of-period accrued marketing and promotion liabilities (trade spending) rose +7.53% YoY to $4,141 million (up from $3,851 million in FY2025).
Supply Chain Infrastructure, Working Capital Arbitrage, and Forensic Audit
The Procter & Gamble Company operates 96 primary manufacturing facilities across 32 countries (24 in the U.S. across 18 states; 72 internationally across 31 countries). Operating facilities in Greater China include Braun (Shanghai) Co., Ltd. and P&G Manufacturing (Tianjin) Co. Ltd. Net Property, Plant, and Equipment stands at $25,360 million (Gross PP&E of $57,172 million offset by $31,811 million in accumulated depreciation). Corporate administration is coordinated via the global headquarters in Cincinnati, Ohio, five regional hubs (Switzerland, Panama, Singapore, China, UAE), and three Global Business Services (GBS) hubs in Costa Rica, the U.K., and the Philippines.
Management is executing the June 2025 Focused Portfolio, Supply Chain and Productivity Plan, projecting $1,500 million to $2,000 million in total pre-tax restructuring costs through FY2027. In FY2026, the company incurred $1,230 million in before-tax restructuring costs:
* Cost of Products Sold (COGS): $606 million (plant consolidation, asset write-downs, accelerated depreciation).
* SG&A Expenses: $460 million (corporate overhead reductions, separation packages).
* Other Non-Operating Expense: $165 million (lease terminations, contractual exits).
Cash settlements represented 67% ($824 million) of FY2026 restructuring charges, leaving an accrued current restructuring reserve of $336 million ($229 million separation, $107 million exit costs). Total headcount fell 4% YoY to ~104,000 employees (49% in manufacturing, 28% in the U.S.), progressing toward the targeted reduction of up to 7,000 non-manufacturing personnel by FY2027. Remaining restructuring capacity for FY2027 is $270 million to $770 million.
Capital allocation included entering a definitive agreement on August 4, 2026, to acquire Thorne for $3,800 million in cash (scheduled to close in Q2 FY2027). Other FY2026 acquisitions totaled $85 million ($40 million in goodwill recognized in Health Care). Portfolio exits generated cash inflows, including $476 million from Clorox upon the January 2026 dissolution of the Glad joint venture ($261 million after-tax gain). Substantial liquidations of operations in hyper-inflationary markets resulted in a $131 million non-cash after-tax AOCI charge for Pakistan in FY2026, following a $752 million non-cash after-tax charge for Argentina in FY2025 ($1,200 million cumulative program cost).
Operating Cash Flow increased +10% YoY to $19,556 million. Capital expenditures expanded 16.9% to $4,409 million (5.1% of Net Sales):
* Baby, Feminine & Family Care: $1,520 million (34.5% of total).
* Fabric & Home Care: $1,250 million (28.4% of total).
* Health Care: $592 million.
* Grooming: $540 million.
* Beauty: $415 million.
Adjusted Free Cash Flow reached $15,835 million (+8.4% YoY), factoring in $688 million in U.S. tax act transitional payments. Adjusted FCF Productivity registered at 100% ($15,835 million / ($16,144 million GAAP Net Earnings minus $261 million Glad gain)). Total Accounts Payable ended at $16,306 million.
Forensic analysis indicates that reported working capital metrics are supported by a Supply Chain Finance (SCF) program. Outstanding confirmed obligations under the SCF facility rose to $6,176 million (37.9% of total Accounts Payable, up from $5,790 million in FY2025). P&G confirmed $18,110 million in invoices under the program in FY2026, with $17,741 million paid to participating financial institutions, extending payment terms to 60–180 days.
Reported Average DPO stood at 132.71 days (137.26 days ending), producing a negative Average Cash Conversion Cycle (CCC) of -30.87 days (-43.08 days ending). Reclassifying the $6,176 million in bank-backed SCF liabilities away from trade payables yields an Organic Accounts Payable balance of $10,130 million ($9,783.5 million average), reducing Organic DPO to 82.35 days and adjusting the true Organic Average CCC to +19.49 days (+11.8 days ending).
Total Balance Sheet Debt stood at $34,138 million (Current Debt of $11,296 million including $4,837 million in commercial paper and $6,457 million in current portions of long-term debt; Long-Term Debt of $22,842 million). Contractual nominal debt obligations total $34,490 million ($11,357 million due <1 year, $4,173 million due 1–3 years, $6,306 million due 3–5 years, and $12,654 million due >5 years). Cash and cash equivalents totaled $9,942 million, yielding Net Debt of $24,196 million.
The company holds $8.0 billion in undrawn credit facilities ($3.2 billion expiring in 2030, $4.8 billion expiring in October 2026). Credit ratings are Aa3 / AA-. Net Debt-to-EBITDA stands at 1.06x ($24,196 million / $22,908 million), while Total Debt-to-EBITDA sits at 1.49x. Interest expense totaled $877 million, yielding an EBIT interest coverage ratio of 22.52x and an EBITDA interest coverage ratio of 26.12x.
Shareholder capital distributions totaled $15,260 million (96.38% of Adjusted FCF, 94.52% of GAAP Net Earnings):
* Common Stock Dividends: $10,232 million ($4.26 per share), marking 136 consecutive years of dividend payments and 70 consecutive years of dividend increases.
* Share Repurchases: $5,028 million (cash flow basis) / $5,029 million (equity statement basis), retiring 33,437 thousand common shares at an average cost of $147.46 per share under the July 2025 authorization. Over three years, P&G returned 102.00% of cumulative FCF ($45,950 million returned / $45,047 million FCF).
Off-balance-sheet commitments include $1,028 million in undiscounted operating lease obligations ($246 million due <1 year; discounted PV of $887 million offset by an $846 million Right-of-Use asset) and $3,651 million in non-cancelable take-or-pay purchase obligations ($1,155 million due <1 year). Derivative contracts hold a total notional value of $22,975 million, including $5,241 million in interest rate fair value hedges (net liability position of $(221) million) and net investment hedges comprising $13,587 million in foreign currency swaps and $12,000 million in foreign-denominated debt. Hedging operations generated $264 million in OCI gains on swaps, $395 million in AOCI gains on debt, and $242 million in P&L gains credited to Interest Expense. Note 9 confirms zero financial commodity hedging activity was conducted in FY2025 or FY2026.
Audited intangible assets include the indefinite-lived Gillette brand carrying value of $12,800 million (net of a $1,300 million pre-tax impairment in FY2024; Grooming carries $7,900 million in accumulated historical goodwill impairments). Valuation modeling shows that a 25 bps increase in WACC or a 25 bps reduction in terminal growth reduces the brand's fair value by 5% (~$640 million), while a 50 bps reduction in the royalty rate reduces fair value by 4% (~$512 million). Amortizable intangibles carry a net value of $1,909 million ($9,164 million gross less $7,255 million accumulated amortization).
Employee benefit obligations reflect non-U.S. pension underfunding of $296 million (PBO of $12,455 million against plan assets of $12,159 million; $295 million unrealized AOCI loss) and U.S. Other Postretirement Benefits (OPRB) overfunding of $3,432 million (APBO of $3,734 million against plan assets of $7,166 million; $1,285 million unrealized AOCI loss). Pension expense totaled $114 million, while OPRB generated a net credit of $(607) million, creating a combined pre-tax benefit credit of $493 million ($755 million net non-operating P&L credit, accounting for 3.1% of pre-tax GAAP earnings). Assumed asset return rates stand at 6.0% for pensions and 8.5% for OPRB (a 100 bps shift impacts annual after-tax expense by $160 million).
Tax contingencies reveal an ending Unrecognized Tax Benefit (UTP) base liability of $547 million ($438 million would impact ETR). P&G excludes accrued interest ($142 million) and accrued penalties ($48 million) from the UTP table, creating a total tax controversy liability of $737 million across 140 jurisdictions with 30–40 active audits. Deferred tax assets include $1,439 million in capitalized R&D, offset by deferred tax liabilities of $5,443 million for goodwill/intangibles and $158 million for foreign withholding taxes. Environmental disclosures note a pending U.K. ETS civil penalty (<$2 million) for a historic greenhouse gas permit omission at its London site, while Scope 1, 2, and 3 CapEx remain unsegregated within core capital budgets.
HDIN Institutional Verdict and Valuation Diagnostics
Applying the DuPont 3-Factor Framework on Average Balances for FY2026:
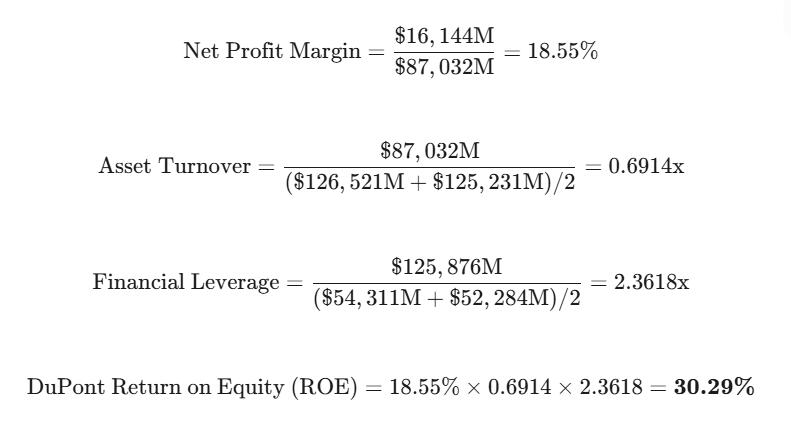
*(Calculating purely on P&G Shareholder Interest yields an Average ROE of 30.25%).
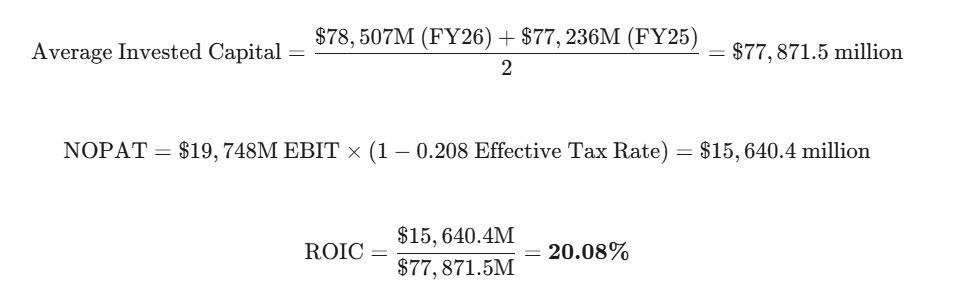
Return on Invested Capital (ROIC) reflects capital efficiency:
P&G’s 5-year cumulative Total Shareholder Return (TSR) of 23% underperformed both the S&P 500 Index (+88%) and the S&P 500 Consumer Staples Index (+45%). Executive compensation structures align with operational metrics: the short-term STAR bonus program weights company performance 30% (Organic Sales and Core EPS Growth) and business unit performance 70%, while the long-term Performance Stock Program (PSP) evaluates 3-year Organic Sales Growth percentile (30%), Constant Currency Core Before-Tax Operating Profit Growth (20%), Core EPS Growth (30%), and Adjusted FCF Productivity (20%), modified by a Relative TSR factor (75%–125%). Clawback policies comply with Dodd-Frank and extend to all Band 7+ executives.
HDIN Research concludes that management has maintained discipline in operational cash generation ($15,835 million Adjusted FCF) and balance sheet management. However, flat global volume dynamics across core categories highlight the limits of relying solely on pricing increases and financial engineering. Executing the June 2025 restructuring program to trim structural overhead alongside integrating the $3,800 million Thorne acquisition will be key variables in addressing top-line volume trends and supporting long-term shareholder returns.
Presentation Download & Video Access:
Presentation Download: Click the PDF download link under 'Related Topics' to access the full institutional presentation of this report.
Video Link: Click this link to watch the HDIN analyst briefing on YouTube.
About HDIN Research:
HDIN Research is a global market intelligence and strategic advisory firm specializing in institutional-grade financial analysis, supply chain audits, and macroeconomic forecasting. Our dedicated sector analysts deliver actionable, data-driven insights tailored for private equity, hedge funds, and corporate strategy teams. Visit us at http://www.hdinresearch.com.
2026 AI Transparency Footer:
"This intelligence report was authored by HDIN Research analysts following a rigorous audit of official corporate filings. AI was utilized for massive-scale data synthesis and structural drafting, ensuring 100% inclusion of reported data points. All strategic insights, financial modeling, and final verdicts were verified by our editorial board to ensure professional accuracy and compliance with 2026 Google Search E-E-A-T standards."
1. The Procter & Gamble Company [NYSE: PG] delivered FY2026 Net Sales of $87,032 million (+3.3% YoY, +1.0% Organic) as $1,800 million in manufacturing productivity savings (+180 bps) offset product mix degradation (-120 bps) and 0.0% global volume growth.
2. Adjusted Free Cash Flow Productivity reached 100% ($15,835 million), backed by $6,176 million in Supply Chain Finance obligations that extended supplier payment terms to 60–180 days across 96 global manufacturing hubs.
3. Management committed $3,800 million to acquire Thorne while executing a two-year portfolio restructuring plan targeting up to 7,000 non-manufacturing personnel reductions to protect operating margins.
Segmental Performance Realities and Margin Compression Diagnostics
The Procter & Gamble Company generated consolidated Net Sales of $87,032 million in FY2026 (+3.3% YoY / +3.26%), up from $84,284 million in FY2025 and $84,039 million in FY2024. Organic Sales grew +1.0%, driven by foreign exchange tailwinds of +2.0% and pricing increases of +1.0%, while unit volume (0.0%) and product mix (0.0%) remained unchanged globally. Consolidated GAAP Net Earnings totaled $16,144 million (+0.49% YoY), while Operating Income (EBIT) fell -3.4% to $19,748 million. EBITDA reached $22,908 million ($19,748 million EBIT plus $3,160 million depreciation and amortization).
Diluted GAAP EPS rose +2.0% to $6.62, supported by share repurchases. Core Net Earnings reached $16,786 million (+1.0% YoY), yielding a Core EPS of $6.89 (+1.0%). The reconciliation from GAAP to Non-GAAP Core Net Earnings incorporates $904 million in after-tax non-core incremental restructuring charges under the June 2025 plan, offset by a $261 million after-tax gain ($343 million pre-tax recorded in Corporate) from the January 2026 dissolution of the Glad joint venture.
The company's five Sector Business Units (SBUs) generated $86,112 million in combined segment Net Sales and $16,167 million in combined segment Net Earnings (excluding $919 million in Corporate Net Sales, up +16% YoY, and $(23) million in Corporate Net Earnings):
Table Business Segment Financial Performance and Growth Driver Analysis (FY2026)
| Business Segment (SBU) | Net Sales ($M) | % of Segment / Consolidated Sales | Net Earnings ($M) | % of Segment / Consolidated Earnings | Net Margin (%) | YoY Sales Growth (%) | Organic Sales Growth (%) | Volume Change (%) | Price Contribution (%) | Mix Contribution (%) |
| Fabric & Home Care | $30,314 | 35.20% / 34.83% | $5,632 | 34.84% / 34.89% | 18.58% | +2% | +1% | 0% | +1% | 0% |
| Baby, Feminine & Family Care | $20,401 | 23.69% / 23.44% | $3,930 | 24.31% / 24.34% | 19.26% | +1% | -1% | -1% | 0% | 0% |
| Beauty | $16,023 | 18.61% / 18.41% | $2,672 | 16.53% / 16.55% | 16.68% | +7% | +5% | +4% | +1% | 0% |
| Health Care | $12,456 | 14.46% / 14.31% | $2,404 | 14.87% / 14.89% | 19.30% | +4% | +1% | -2% | +2% | +1% |
| Grooming | $6,918 | 8.03% / 7.95% | $1,529 | 9.46% / 9.47% | 22.10% | +4% | +1% | -1% | +2% | 0% |
| Segment Total | $86,112 | 100.00% / 98.94% | $16,167 | 100.00% / 100.14% | 18.77% | — | — | — | — | — |
| Corporate (Unallocated) | $919 | 1.06% | $(23) | -0.14% | — | +16% | — | — | — | — |
| Consolidated Group (GAAP) | $87,032 | 100.00% | $16,144 | 100.00% | 18.55% | +3% | +1% | 0% | +1% | 0% |
* Fabric & Home Care: Anchor brands include Tide, Ariel, Downy, Gain, Cascade, Dawn, Febreze, and Swiffer across 34 dedicated manufacturing hubs. Organic sales grew +1%, relying on pricing (+1%) in mature markets, while private label competition in Europe created volume headwinds.
* Baby, Feminine & Family Care: Anchor brands include Pampers, Always, Tampax, Always Discreet, Bounty, Charmin, and Puffs across 32 manufacturing hubs. Organic sales fell -1% due to North American promotional discounting in Family Care (Bounty and Charmin). Pampers innovation drove a +20% organic sales surge in Greater China. Category shares stand at ~40% for North American paper towels, >25% for bath tissue, >30% for global baby care, and ~30% for global feminine care (>35% in pads/tampons, >15% in adult incontinence).
* Beauty: Anchor brands include Head & Shoulders, Pantene, Rejoice, Old Spice, Secret, Native, Safeguard, Olay, and SK-II across 20 manufacturing hubs. Segment Net Earnings contracted -2% YoY to $2,672 million due to input cost inflation and marketing reinvestment, yielding the lowest margin (16.68%) among SBUs. Volume expanded +4% via European and Latin American hair care innovations, offset by SK-II volume declines in Greater China. Global market shares stand at ~20% in hair care, ~20% in personal care, and ~5% in skin care (Olay), with global category market share losses of 0.5 points in shampoo and 0.6 points in skin care.
* Health Care: Anchor brands include Crest, Oral-B, Vicks, Metamucil, Pepto-Bismol, and Neurobion across 19 manufacturing hubs. Premium power toothbrushes and Crest 3D White generated a +1% product mix gain. Volume fell -2% due to low winter cough/cold incidence impacting Vicks in North America and a mid-teens (~15%) decline in Greater China oral care. Global oral care market share sits at ~30%.
* Grooming: Anchor brands include Gillette, Venus, and Braun across 17 manufacturing hubs. Net margin reached a portfolio-leading 22.10%. Volume fell -1% due to IMEA distributor network shifts, offset by +2% pricing power in North America and Europe and +3% FX tailwinds. Global market shares stand at >60% in blades and razors and ~30% in male grooming appliances, despite a 0.4-point global share contraction.
Gross Margin contracted 100 bps YoY to 50.2%. The gross margin bridge reflects headwinds from unfavorable product mix (-120 bps), product and packaging reinvestments (-70 bps), higher restructuring costs (-60 bps), net tariff impacts (-30 bps), commodity inflation (-20 bps, focused on petroleum resins and pulp), and FX transactional drag (-10 bps). These costs were partially offset by manufacturing productivity savings (+180 bps, or $1,800 million) and pricing actions (+40 bps).
Operating Margin contracted 160 bps YoY to 22.7%. SG&A expenses expanded 59 bps to 27.49% of Net Sales ($23,922 million, up +5.53% YoY). The expansion was driven by an 80 bps increase in marketing spend ($10,200 million, up +10.87% YoY; 11.72% of Net Sales), which generated $2.75 in incremental Net Sales per incremental advertising dollar ($2,748 million sales growth / $1,000 million ad growth). R&D expenditure remained flat at $2,100 million (2.41% of Net Sales). SG&A inflation was mitigated by $1,600 million in organizational overhead productivity savings (+160 bps benefit).
Geographically, the U.S. market generated $41,700 million in Net Sales (+0.24% YoY; 47.9% of consolidated sales) with $13,900 million in long-term assets. International operations delivered $45,300 million in Net Sales (+6.09% YoY; 52.1% of total) with $11,500 million in long-term assets. The top five international markets—Greater China, the U.K., Canada, Japan, and Germany—contributed 21% of consolidated Net Sales (~$18,300 million). Operational entities in Taiwan are designated as Procter & Gamble Taiwan Limited (Taiwan, Province of China) and Procter & Gamble Taiwan Sales Company Limited (Taiwan, Province of China).
Customer concentration remains high: the top ten retail customers accounted for 43% of consolidated Net Sales in FY2026 (43% in FY2025, 42% in FY2024). Walmart Inc. and its affiliates represented 16% of total sales ($13,925 million). End-of-period accrued marketing and promotion liabilities (trade spending) rose +7.53% YoY to $4,141 million (up from $3,851 million in FY2025).
Supply Chain Infrastructure, Working Capital Arbitrage, and Forensic Audit
The Procter & Gamble Company operates 96 primary manufacturing facilities across 32 countries (24 in the U.S. across 18 states; 72 internationally across 31 countries). Operating facilities in Greater China include Braun (Shanghai) Co., Ltd. and P&G Manufacturing (Tianjin) Co. Ltd. Net Property, Plant, and Equipment stands at $25,360 million (Gross PP&E of $57,172 million offset by $31,811 million in accumulated depreciation). Corporate administration is coordinated via the global headquarters in Cincinnati, Ohio, five regional hubs (Switzerland, Panama, Singapore, China, UAE), and three Global Business Services (GBS) hubs in Costa Rica, the U.K., and the Philippines.
Management is executing the June 2025 Focused Portfolio, Supply Chain and Productivity Plan, projecting $1,500 million to $2,000 million in total pre-tax restructuring costs through FY2027. In FY2026, the company incurred $1,230 million in before-tax restructuring costs:
* Cost of Products Sold (COGS): $606 million (plant consolidation, asset write-downs, accelerated depreciation).
* SG&A Expenses: $460 million (corporate overhead reductions, separation packages).
* Other Non-Operating Expense: $165 million (lease terminations, contractual exits).
Cash settlements represented 67% ($824 million) of FY2026 restructuring charges, leaving an accrued current restructuring reserve of $336 million ($229 million separation, $107 million exit costs). Total headcount fell 4% YoY to ~104,000 employees (49% in manufacturing, 28% in the U.S.), progressing toward the targeted reduction of up to 7,000 non-manufacturing personnel by FY2027. Remaining restructuring capacity for FY2027 is $270 million to $770 million.
Capital allocation included entering a definitive agreement on August 4, 2026, to acquire Thorne for $3,800 million in cash (scheduled to close in Q2 FY2027). Other FY2026 acquisitions totaled $85 million ($40 million in goodwill recognized in Health Care). Portfolio exits generated cash inflows, including $476 million from Clorox upon the January 2026 dissolution of the Glad joint venture ($261 million after-tax gain). Substantial liquidations of operations in hyper-inflationary markets resulted in a $131 million non-cash after-tax AOCI charge for Pakistan in FY2026, following a $752 million non-cash after-tax charge for Argentina in FY2025 ($1,200 million cumulative program cost).
Operating Cash Flow increased +10% YoY to $19,556 million. Capital expenditures expanded 16.9% to $4,409 million (5.1% of Net Sales):
* Baby, Feminine & Family Care: $1,520 million (34.5% of total).
* Fabric & Home Care: $1,250 million (28.4% of total).
* Health Care: $592 million.
* Grooming: $540 million.
* Beauty: $415 million.
Adjusted Free Cash Flow reached $15,835 million (+8.4% YoY), factoring in $688 million in U.S. tax act transitional payments. Adjusted FCF Productivity registered at 100% ($15,835 million / ($16,144 million GAAP Net Earnings minus $261 million Glad gain)). Total Accounts Payable ended at $16,306 million.
Forensic analysis indicates that reported working capital metrics are supported by a Supply Chain Finance (SCF) program. Outstanding confirmed obligations under the SCF facility rose to $6,176 million (37.9% of total Accounts Payable, up from $5,790 million in FY2025). P&G confirmed $18,110 million in invoices under the program in FY2026, with $17,741 million paid to participating financial institutions, extending payment terms to 60–180 days.
Reported Average DPO stood at 132.71 days (137.26 days ending), producing a negative Average Cash Conversion Cycle (CCC) of -30.87 days (-43.08 days ending). Reclassifying the $6,176 million in bank-backed SCF liabilities away from trade payables yields an Organic Accounts Payable balance of $10,130 million ($9,783.5 million average), reducing Organic DPO to 82.35 days and adjusting the true Organic Average CCC to +19.49 days (+11.8 days ending).
Total Balance Sheet Debt stood at $34,138 million (Current Debt of $11,296 million including $4,837 million in commercial paper and $6,457 million in current portions of long-term debt; Long-Term Debt of $22,842 million). Contractual nominal debt obligations total $34,490 million ($11,357 million due <1 year, $4,173 million due 1–3 years, $6,306 million due 3–5 years, and $12,654 million due >5 years). Cash and cash equivalents totaled $9,942 million, yielding Net Debt of $24,196 million.
The company holds $8.0 billion in undrawn credit facilities ($3.2 billion expiring in 2030, $4.8 billion expiring in October 2026). Credit ratings are Aa3 / AA-. Net Debt-to-EBITDA stands at 1.06x ($24,196 million / $22,908 million), while Total Debt-to-EBITDA sits at 1.49x. Interest expense totaled $877 million, yielding an EBIT interest coverage ratio of 22.52x and an EBITDA interest coverage ratio of 26.12x.
Shareholder capital distributions totaled $15,260 million (96.38% of Adjusted FCF, 94.52% of GAAP Net Earnings):
* Common Stock Dividends: $10,232 million ($4.26 per share), marking 136 consecutive years of dividend payments and 70 consecutive years of dividend increases.
* Share Repurchases: $5,028 million (cash flow basis) / $5,029 million (equity statement basis), retiring 33,437 thousand common shares at an average cost of $147.46 per share under the July 2025 authorization. Over three years, P&G returned 102.00% of cumulative FCF ($45,950 million returned / $45,047 million FCF).
Off-balance-sheet commitments include $1,028 million in undiscounted operating lease obligations ($246 million due <1 year; discounted PV of $887 million offset by an $846 million Right-of-Use asset) and $3,651 million in non-cancelable take-or-pay purchase obligations ($1,155 million due <1 year). Derivative contracts hold a total notional value of $22,975 million, including $5,241 million in interest rate fair value hedges (net liability position of $(221) million) and net investment hedges comprising $13,587 million in foreign currency swaps and $12,000 million in foreign-denominated debt. Hedging operations generated $264 million in OCI gains on swaps, $395 million in AOCI gains on debt, and $242 million in P&L gains credited to Interest Expense. Note 9 confirms zero financial commodity hedging activity was conducted in FY2025 or FY2026.
Audited intangible assets include the indefinite-lived Gillette brand carrying value of $12,800 million (net of a $1,300 million pre-tax impairment in FY2024; Grooming carries $7,900 million in accumulated historical goodwill impairments). Valuation modeling shows that a 25 bps increase in WACC or a 25 bps reduction in terminal growth reduces the brand's fair value by 5% (~$640 million), while a 50 bps reduction in the royalty rate reduces fair value by 4% (~$512 million). Amortizable intangibles carry a net value of $1,909 million ($9,164 million gross less $7,255 million accumulated amortization).
Employee benefit obligations reflect non-U.S. pension underfunding of $296 million (PBO of $12,455 million against plan assets of $12,159 million; $295 million unrealized AOCI loss) and U.S. Other Postretirement Benefits (OPRB) overfunding of $3,432 million (APBO of $3,734 million against plan assets of $7,166 million; $1,285 million unrealized AOCI loss). Pension expense totaled $114 million, while OPRB generated a net credit of $(607) million, creating a combined pre-tax benefit credit of $493 million ($755 million net non-operating P&L credit, accounting for 3.1% of pre-tax GAAP earnings). Assumed asset return rates stand at 6.0% for pensions and 8.5% for OPRB (a 100 bps shift impacts annual after-tax expense by $160 million).
Tax contingencies reveal an ending Unrecognized Tax Benefit (UTP) base liability of $547 million ($438 million would impact ETR). P&G excludes accrued interest ($142 million) and accrued penalties ($48 million) from the UTP table, creating a total tax controversy liability of $737 million across 140 jurisdictions with 30–40 active audits. Deferred tax assets include $1,439 million in capitalized R&D, offset by deferred tax liabilities of $5,443 million for goodwill/intangibles and $158 million for foreign withholding taxes. Environmental disclosures note a pending U.K. ETS civil penalty (<$2 million) for a historic greenhouse gas permit omission at its London site, while Scope 1, 2, and 3 CapEx remain unsegregated within core capital budgets.
HDIN Institutional Verdict and Valuation Diagnostics
Applying the DuPont 3-Factor Framework on Average Balances for FY2026:
*(Calculating purely on P&G Shareholder Interest yields an Average ROE of 30.25%).
Return on Invested Capital (ROIC) reflects capital efficiency:
P&G’s 5-year cumulative Total Shareholder Return (TSR) of 23% underperformed both the S&P 500 Index (+88%) and the S&P 500 Consumer Staples Index (+45%). Executive compensation structures align with operational metrics: the short-term STAR bonus program weights company performance 30% (Organic Sales and Core EPS Growth) and business unit performance 70%, while the long-term Performance Stock Program (PSP) evaluates 3-year Organic Sales Growth percentile (30%), Constant Currency Core Before-Tax Operating Profit Growth (20%), Core EPS Growth (30%), and Adjusted FCF Productivity (20%), modified by a Relative TSR factor (75%–125%). Clawback policies comply with Dodd-Frank and extend to all Band 7+ executives.
HDIN Research concludes that management has maintained discipline in operational cash generation ($15,835 million Adjusted FCF) and balance sheet management. However, flat global volume dynamics across core categories highlight the limits of relying solely on pricing increases and financial engineering. Executing the June 2025 restructuring program to trim structural overhead alongside integrating the $3,800 million Thorne acquisition will be key variables in addressing top-line volume trends and supporting long-term shareholder returns.
Presentation Download & Video Access:
Presentation Download: Click the PDF download link under 'Related Topics' to access the full institutional presentation of this report.
Video Link: Click this link to watch the HDIN analyst briefing on YouTube.
About HDIN Research:
HDIN Research is a global market intelligence and strategic advisory firm specializing in institutional-grade financial analysis, supply chain audits, and macroeconomic forecasting. Our dedicated sector analysts deliver actionable, data-driven insights tailored for private equity, hedge funds, and corporate strategy teams. Visit us at http://www.hdinresearch.com.
2026 AI Transparency Footer:
"This intelligence report was authored by HDIN Research analysts following a rigorous audit of official corporate filings. AI was utilized for massive-scale data synthesis and structural drafting, ensuring 100% inclusion of reported data points. All strategic insights, financial modeling, and final verdicts were verified by our editorial board to ensure professional accuracy and compliance with 2026 Google Search E-E-A-T standards."