Zen Technologies Limited: Multi-Domain Platform Expansion Near Tuem EMC as ₹1,336 Crore Backlog Signals FY27 Execution Surge
Date : 2026-08-11
Reading : 294
HDIN Market Intelligence Brief
1. Zen Technologies Limited [NSE: ZENTEC / BSE: 533339] recorded FY26 consolidated revenue of ₹687.69 Crore ($78.91M) amid procurement milestone shifts, while gross margins expanded 1,384 bps to 75.94% on high-IP software mix.
2. Consolidated order backlog closed at a record ₹1,336.04 Crore ($153.31M), with ₹1,000 Crore ($114.75M) scheduled for FY27 execution, supported by an inventory buffer of ₹188.19 Crore ($21.59M).
3. Net cash conversion cycle expanded to 399.1 days due to strategic raw material stockpiling (+106.01% YoY to ₹99.63 Crore), while receivables collections drove OCF/PAT to 112.24% with a debt-free treasury of ₹1,306.42 Crore ($149.91M).
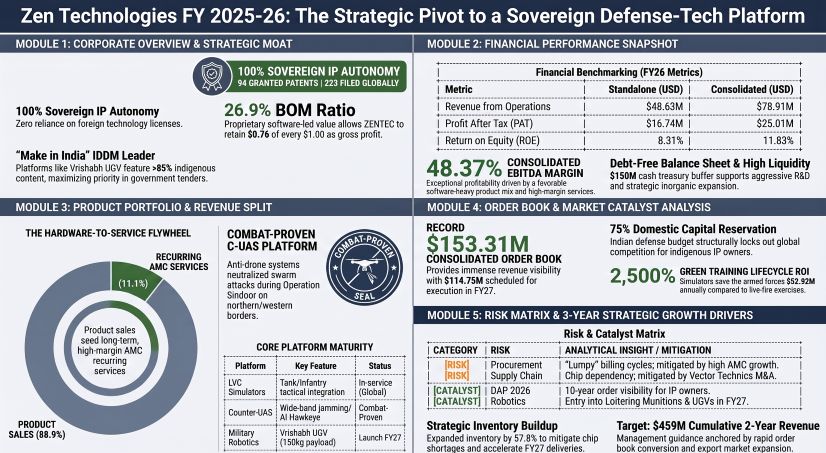
Figure Zen Technologies FY 2025-26: The Strategic Pivot to a Sovereign Defense-Tech Platform
 Segmental Realities and Margin Expansion
Zen Technologies Limited [NSE: ZENTEC / BSE: 533339] reported FY26 consolidated financial results reflecting a transition from a dedicated simulator vendor to a platform entity spanning virtual/live simulation, counter-unmanned aerial systems (C-UAS), automated weapon stations, combat robotics, and naval command platforms. Consolidated top-line revenue moderated 29.37% YoY to ₹687.69 Crore ($78.91M) compared to ₹973.64 Crore ($111.72M) in FY25, driven by administrative invoicing shifts in sovereign defense procurement. Standalone revenue contracted 54.46% YoY to ₹423.77 Crore ($48.63M) from ₹930.67 Crore ($106.79M).
Despite top-line moderation, unit economics expanded. Consolidated gross profit stood at ₹522.21 Crore ($59.92M), yielding a gross margin of 75.94% (+1,384 bps YoY from 62.10% in FY25). This margin expansion was driven by a higher proportion of software-dense simulators and proprietary counter-drone installations. Consolidated raw material costs fell 46.32% YoY to ₹185.30 Crore ($21.26M), establishing a raw material cost-to-sales ratio of 26.94% (down from 35.45% in FY25). Accounting for work-in-progress and finished goods inventory adjustments of -₹19.83 Crore (-$2.28M), effective cost of goods sold (COGS) reached ₹165.47 Crore ($18.99M). Standalone gross margins expanded 980 bps to 62.50% on gross profit of ₹264.87 Crore ($30.40M) with COGS of ₹158.90 Crore ($18.23M) (raw materials ₹184.94 Crore / $21.22M, inventory adjustment -₹26.04 Crore / -$2.99M).
Consolidated reported EBITDA reached ₹332.66 Crore ($38.17M) representing a 48.37% margin, while operational EBITDA margin held at 35.95%. Group Profit After Tax (PAT) stood at ₹217.93 Crore ($25.01M) (-27.20% YoY from ₹299.33 Crore), with parent-attributed PAT (net of non-controlling interest) at ₹193.45 Crore ($22.20M). Standalone PAT reached ₹145.85 Crore ($16.74M) (-44.53% YoY from ₹262.95 Crore).
DuPont analysis reveals Consolidated Return on Equity (ROE) compressed to 11.83% in FY26 (down from 27.19% in FY25), decomposed into a Net Profit Margin of 31.69%, Asset Turnover of 0.3268x, and Financial Leverage of 1.1423x. Standalone ROE registered at 8.31%, decomposed into a Net Profit Margin of 34.42%, Asset Turnover of 0.2225x, and Financial Leverage of 1.0851x. ROE moderation was primarily driven by equity base dilution following the execution of a ₹1,000 Crore ($114.75M) Qualified Institutional Placement (QIP) late in the prior fiscal year, alongside delayed asset turnover.
Free Cash Flow (FCF) turned around to ₹185.79 Crore ($21.32M) consolidated, recovering from negative -₹1.27 Crore (-$0.15M) in FY25. The balance sheet carries zero standalone debt and a Consolidated Debt-to-Equity ratio of 0.002, supported by a cash and bank treasury buffer of ₹1,306.42 Crore ($149.91M) (and total group cash reserves of ₹1,308 Crore / $150.09M). Earnings quality strengthened as Consolidated Operating Cash Flow (OCF) to Net Profit reached 112.24% (OCF of ₹244.60 Crore / $28.07M), while Standalone OCF/PAT reached 156.67% (OCF of ₹228.51 Crore / $26.22M, up from ₹31.02 Crore / $3.56M in FY25), following cash collections of trade receivables.
Table Consolidated and Standalone Financial Performance Analysis (FY2025–FY2026)
The consolidated cash conversion cycle (CCC) expanded to 399.1 days in FY26 (up 186.6 days from 212.5 days in FY25), while standalone CCC expanded to 339.2 days (from 166.9 days). Consolidated Days Sales Outstanding (DSO) rose to 168.2 days (from 111.6 days; receivables turnover 2.17x vs. 3.27x), Standalone DSO reached 219.9 days (from 107.4 days; turnover 1.66x vs. 3.40x). Days Inventory Outstanding (DIO) expanded to 266.4 days consolidated (from 136.7 days; turnover 1.37x vs. 2.67x) and 142.6 days standalone (from 74.0 days; turnover 2.56x vs. 4.93x). Days Payable Outstanding (DPO) stood at 35.5 days consolidated (turnover 10.28x) and 23.2 days standalone (turnover 15.71x).
Inventory holding grew 57.79% YoY on a consolidated basis to ₹188.19 Crore ($21.59M / ₹18,818.61 Lakhs), up from ₹119.27 Crore ($13.69M). Consolidated raw materials surged 106.01% YoY to ₹99.63 Crore ($11.43M / ₹9,962.56 Lakhs) representing 52.94% of inventory. Work-in-Progress expanded 38.04% to ₹78.97 Crore ($9.06M / ₹7,897.29 Lakhs), finished goods rose 44.86% to ₹9.41 Crore ($1.08M / ₹941.23 Lakhs), stock-in-transit stood at ₹17.53 Lakhs ($0.02M), and stock-in-trade was ₹Nil. Standalone inventory expanded 64.53% to ₹83.94 Crore ($9.63M / ₹8,394.17 Lakhs), comprising raw materials of ₹33.14 Crore ($3.80M / ₹3,314.18 Lakhs, +26.20%), WIP of ₹42.92 Crore ($4.92M / ₹4,291.74 Lakhs, +75.91%), and finished goods of ₹7.88 Crore ($0.90M / ₹788.25 Lakhs, +2089.58%). This material accumulation positions the company to execute its scheduled orders.
Trade receivables collections liquidated prior milestone accumulation. Consolidated gross trade receivables fell to ₹225.83 Crore ($25.91M / ₹22,583.49 Lakhs) from ₹412.69 Crore in FY25, following cash collections of ₹197.71 Crore ($22.69M / ₹19,770.69 Lakhs). Standalone gross receivables dropped to ₹133.16 Crore ($15.28M / ₹13,315.90 Lakhs) from ₹380.18 Crore following collections of ₹255.34 Crore ($29.30M / ₹25,534.27 Lakhs).
Ageing analysis reveals that 78.93% of consolidated gross receivables reside in "Not Due" (₹67.25 Crore / $7.72M) and "< 6 Months" (₹111.00 Crore / $12.74M) buckets. Receivables in the 6–12 months bracket contracted 75.49% consolidated to ₹31.57 Crore ($3.62M) and 83.46% standalone to ₹21.03 Crore ($2.41M). The 1–2 years bracket carried ₹14.21 Crore ($1.63M) consolidated and ₹8.17 Crore ($0.94M) standalone; 2–3 years carried ₹33.83 Lakhs ($0.04M) consolidated and ₹10.72 Lakhs ($0.01M) standalone; > 3 years held ₹1.46 Crore ($0.17M / ₹145.99 Lakhs) on both bases.
Expected Credit Loss (ECL) provisions stood at ₹1.83 Crore ($209.82k / ₹182.85 Lakhs) consolidated (0.81% gross coverage) and ₹1.43 Crore ($164.11k / ₹143.02 Lakhs) standalone (1.07% gross coverage). The consolidated provision provides 125.25% coverage over balances older than three years. Contract assets (accrued unbilled income) reached ₹10.24 Crore ($1.18M / ₹1,024.20 Lakhs) consolidated and ₹8.16 Crore ($936.00k / ₹815.70 Lakhs) standalone. Government client security deposits stood at ₹63.73 Lakhs ($73.13k) consolidated and ₹62.44 Lakhs ($71.65k) standalone.
The group ended FY26 with a consolidated order book of ₹1,336.04 Crore ($153.31M) and a standalone order book of ₹1,222.60 Crore ($140.29M). Order inflows during Q4 FY26 reached ₹431.36 Crore ($49.50M), representing 32.29% of the outstanding book. Management targets ₹1,000 Crore ($114.75M) of conversion into revenue during FY27 (74.8% of the book), supporting cumulative two-year turnover guidance of ₹4,000 Crore ($459.04M) across FY27–FY28. Long-term margin targets remain set at 35% operational EBITDA and 25% PAT.
Customer concentration remains concentrated with sovereign counterparties: three primary clients accounted for 56.94% of consolidated revenue in FY26 (compared to a single client representing 60.96% in FY25). Standalone revenue concentration across three clients reached 74.41% (up from 63.77% in FY25).
Recurring service and Annual Maintenance Contract (AMC) revenues increased 84.83% YoY to ₹76.58 Crore ($8.79M / ₹7,657.92 Lakhs) consolidated, raising service contribution to 11.14% of total revenue. Standalone service revenues stabilized at ₹37.37 Crore ($4.29M / ₹3,736.53 Lakhs), or 8.82% of revenue. Fixed cost coverage analysis shows consolidated service revenue covers 33.35% of total base fixed operating overheads of ₹229.65 Crore ($26.35M) (employee benefits ₹126.94 Crore; other operating expenses ₹102.71 Crore). Standalone service revenue covers 32.49% of standalone fixed overheads of ₹115.01 Crore ($13.20M) (employee benefits ₹56.21 Crore; other expenses ₹58.80 Crore).
R&D accounting reflects a conservative stance: 100% of revenue R&D expenditure was expensed directly to the P&L statement, with zero (₹0) development costs capitalized on Intangible Assets under Development (IAUD) across consolidated and standalone books. Completed past development assets transferred out of IAUD to software amounted to ₹1.60 Crore ($183.93k / ₹160.29 Lakhs) consolidated and ₹1.38 Crore ($158.35k / ₹138.00 Lakhs) standalone, leaving a closing IAUD balance of ₹2.10 Crore ($240.97k / ₹210.00 Lakhs) on both bases.
Reported P&L R&D operating expenses reached ₹45.44 Crore ($5.21M / ₹4,544.13 Lakhs) consolidated (6.61% of sales) and ₹36.90 Crore ($4.23M / ₹3,689.60 Lakhs) standalone (8.70% of sales). Adjusting for non-cash depreciation on R&D assets of ₹47.86 Lakhs ($54.92k) and adding tangible R&D gross capex additions of ₹66.60 Lakhs ($76.42k), total cash R&D spend reached ₹45.63 Crore ($5.24M / ₹4,562.87 Lakhs) consolidated and ₹37.08 Crore ($4.26M / ₹3,708.34 Lakhs) standalone. Cumulative 5-year R&D investment reached ₹139.11 Crore ($15.96M). Zero technology was imported over the past three financial years, establishing 0% foreign technology licensing reliance.
Capital deployment from the August 2024 ₹1,000 Crore ($114.75M) QIP stands at 72.43% utilization (₹724.25 Crore / $83.11M spent):
* Working capital: ₹410.00 Crore ($47.05M) fully deployed (100.00%).
* Inorganic M&A: ₹171.42 Crore ($19.67M) deployed out of ₹350.00 Crore ($40.16M) allocated (48.98% utilization; ₹178.58 Crore / $20.49M unutilized).
* General Corporate: ₹122.34 Crore ($14.04M) deployed out of ₹219.51 Crore ($25.19M) allocated (55.73% utilization; ₹97.17 Crore / $11.15M unutilized).
* Issue expenses: ₹20.49 Crore ($2.35M) fully absorbed (100.00%). Unutilized QIP capital of ₹275.75 Crore ($31.64M) remains held in liquid treasury instruments.
Key Managerial Personnel (KMP) total remuneration fell 41.01% YoY to ₹14.99 Crore ($1.72M / ₹1,499.02 Lakhs). Executive commissions dropped in line with standalone PAT contraction (-44.53%):
* Chairman & MD Mr. Ashok Atluri received ₹8.03 Crore ($921,651.74 / ₹803.19 Lakhs, -37.83% YoY), comprising fixed salary ₹2.10 Crore, perquisites ₹3.16 Lakhs, and performance commission ₹5.90 Crore (-44.12% YoY from ₹10.56 Crore).
* President & Joint MD Mr. Kishore Dutt Atluri received ₹6.36 Crore ($729,607.97 / ₹635.83 Lakhs, -44.55% YoY), comprising fixed salary ₹2.10 Crore, perquisites ₹2.06 Lakhs, and commission ₹4.24 Crore (-54.47% YoY from ₹9.31 Crore).
* Whole-Time Director Mrs. Shilpa Choudari received ₹60.00 Lakhs ($68,849.34, +0.25% YoY; fixed salary ₹60.00 Lakhs, commission ₹0.00), with her appointment extended for three years from November 1, 2026, to October 31, 2029.
Remuneration for KMP relatives included Mr. Arjun Dutt Atluri (VP / Director Vector Technics) at ₹80.45 Lakhs ($92.32k), Ms. Anisha Atluri (Head Recruitment) at ₹28.05 Lakhs ($32.19k), and Ms. Abhilasha Atluri (Head IR) at ₹27.00 Lakhs ($30.98k). Mandatory CSR spend of ₹1.46 Crore ($167.98k) was disbursed through the Veer Sammaan Foundation.
The Board proposed a reduced final dividend of ₹1.00 per share (100% face value), totaling ₹9.03 Crore ($1.04M), representing a standalone payout ratio of 6.19% and a consolidated parent payout ratio of 4.67%.
Audit fees to statutory auditors M/s. Ramasamy Koteswara Rao and Co LLP totaled ₹18.70 Lakhs ($21.46k) (audit fees ₹15.00 Lakhs, non-audit certification ₹3.70 Lakhs, establishing a non-audit fee ratio of 24.67%). Statutory, cost, and secretarial audit reports (issued by CS P.S. Rao under Form MR-3) were unqualified and unmodified. Regulatory fines, whistleblowing actions, and POSH complaints stood at zero.
Supply Chain Architecture and Regional Moats
Zen Technologies Limited operates an IP-dense platform model that minimizes heavy structural fabrication in favor of internal system design, software development, sub-assembly outsourcing, and assembly and integration. The operational footprint centers on Hyderabad, Telangana:
* R&D Unit-I (Sanath Nagar, Hyderabad): Department of Scientific and Industrial Research (DSIR) recognized center for platform engineering.
* R&D Unit-II (Signature Towers, Kondapur, Hyderabad): Air-gapped software engineering hub for computer vision, AI algorithms, and adaptive training environments.
* Maheshwaram Production Unit (Hardware Park, Shamshabad, Hyderabad): Primary assembly, system integration, factory acceptance testing, and demonstration facility.
To expand capacity, the company is constructing an advanced manufacturing and R&D node at the Electronic Manufacturing Cluster (EMC) in Tuem, Goa. Consolidated Capital Work-in-Progress (CWIP) additions reached ₹9.79 Crore ($1.12M / ₹978.50 Lakhs) (standalone ₹9.47 Crore / $1.09M / ₹946.55 Lakhs), carrying a closing consolidated CWIP balance of ₹13.34 Crore ($1.53M / ₹1,333.88 Lakhs). Factory construction capital commitments stood at ₹6.63 Crore ($761.22k / ₹663.38 Lakhs).
Reconstructed capex additions for FY26 (consolidated total ₹59.13 Crore / $6.79M / ₹5,913.31 Lakhs; standalone total ₹45.83 Crore / $5.26M / ₹4,582.82 Lakhs) reflect ~80% expansion and ~20% maintenance allocations:
* Plant & Machinery: ₹15.96 Crore ($1.83M / ₹1,596.05 Lakhs) consolidated; ₹6.15 Crore ($705.96k / ₹615.22 Lakhs) standalone.
* Furniture & Fixtures: ₹14.28 Crore ($1.64M / ₹1,428.27 Lakhs) consolidated; ₹19.23 Crore ($2.21M / ₹1,922.58 Lakhs) standalone.
* Computers & Workstations: ₹6.46 Crore ($741.75k / ₹646.38 Lakhs) consolidated; ₹2.82 Crore ($323.64k / ₹282.04 Lakhs) standalone.
* Computer Software: ₹4.44 Crore ($509.15k / ₹443.71 Lakhs) consolidated; ₹2.90 Crore ($332.28k / ₹289.57 Lakhs) standalone.
* Buildings: ₹3.29 Crore ($377.45k / ₹328.94 Lakhs) consolidated; ₹1.97 Crore ($226.41k / ₹197.31 Lakhs) standalone.
* Vehicles: ₹2.78 Crore ($319.50k / ₹278.43 Lakhs) consolidated; ₹2.07 Crore ($237.53k / ₹207.00 Lakhs) standalone.
* Office & Testing Equipment: ₹2.13 Crore ($244.45k / ₹213.03 Lakhs) consolidated; ₹1.23 Crore ($140.63k / ₹122.55 Lakhs) standalone.
Audit of subsidiary financial disclosures (for the year ended March 31, 2026):
* Unistring Tech Solutions Private Limited (UTS) (51% Owned): Revenue ₹211.40 Crore ($24.26M / ₹21,140.35 Lakhs), Net Profit ₹56.01 Crore ($6.43M / ₹5,601.45 Lakhs; 26.49% PAT margin), Total Assets ₹216.59 Crore ($24.85M), Total Liabilities ₹93.21 Crore ($10.70M), Net Worth ₹123.37 Crore ($14.16M). Inter-company operating purchases from UTS were ₹75.74 Crore ($8.69M) standalone (down from ₹151.32 Crore in FY25), and capital purchases were ₹12.11 Crore ($1.39M).
* Applied Research International Private Limited (ARIPL) (100% Owned): Acquired remaining 24% stake in October 2025 for ₹37.90 Crore ($4.35M). Revenue ₹131.16 Crore ($15.05M / ₹13,116.45 Lakhs), Net Profit ₹39.68 Crore ($4.55M / ₹3,968.17 Lakhs; 30.25% PAT margin), Total Assets ₹128.09 Crore ($14.70M), Total Liabilities ₹20.36 Crore ($2.34M), Net Worth ₹107.73 Crore ($12.36M).
* Vector Technics Private Limited (51% Owned): Paid call money of ₹14.30 Crore ($1.64M) in FY26. Revenue ₹9.24 Crore ($1.06M / ₹924.36 Lakhs), Net Loss -₹4.92 Crore (-$564.52k / -₹491.96 Lakhs), Total Assets ₹28.35 Crore ($3.25M), Total Liabilities ₹14.46 Crore ($1.66M), Net Worth ₹13.89 Crore ($1.59M). Goodwill of ₹4.55 Crore ($522.26k / ₹455.13 Lakhs) was finalized upon conclusion of the measurement period on February 14, 2026. Inter-company loan extended by ZENTEC stood at ₹8.00 Crore ($917.99k) at commercial interest, yielding ₹13.16 Lakhs ($15.10k) interest income.
* Anawave Systems & Solutions Private Limited (76% Owned): Acquired November 21, 2025, for ₹7.00 Crore ($0.80M). Revenue ₹1.14 Lakhs ($1.31k), Net Profit ₹3.22 Lakhs ($3.69k), Total Assets ₹12.45 Crore ($1.43M), Total Liabilities ₹4.51 Crore ($517.23k), Net Worth ₹7.95 Crore ($911.90k). Transaction added ₹1.28 Crore ($147.28k / ₹128.35 Lakhs) to Goodwill.
* TISA Aerospace Private Limited (76% Owned): Acquired June 30, 2025, for ₹6.56 Crore ($0.75M / ₹656.18 Lakhs). Revenue ₹0.00, Net Loss -₹46.87 Lakhs (-$53.78k), Total Assets ₹4.08 Crore ($468.35k), Total Liabilities ₹4.90 Crore ($562.03k), Net Worth -₹81.64 Lakhs (-$93.68k). Transaction added ₹6.78 Crore ($777.84k / ₹677.85 Lakhs) to Goodwill.
* Zen Technologies Inc. (USA) (100% Owned): Revenue ₹0.00, Net Loss -₹5.64 Crore (-$647.75k / -₹564.49 Lakhs), Total Assets ₹91.99 Crore ($10.56M), Total Liabilities ₹4.64 Crore ($532.00k), Net Worth ₹87.35 Crore ($10.02M / ₹8,735.43 Lakhs), backed by a $10.00M capital infusion.
* Zen Defence Technologies L.L.C. (Abu Dhabi, UAE) (100% Owned): Revenue ₹0.00, Net Loss -₹1.37 Lakhs (-$1.57k), Total Assets ₹32.54 Lakhs ($37.34k), Total Liabilities ₹5.94 Lakhs ($6.82k), Net Worth ₹26.60 Lakhs ($30.52k).
* Non-Operating & Associate Entities: Zen Medical Technologies (100% Owned; PAT loss -₹2.19 Lakhs, written down to ₹Nil balance sheet value via a ₹37.70 Lakhs / $43.26k standalone impairment charge); Administrative Learning Private Limited (ALPL, 100% Owned; Revenue ₹6.11 Lakhs, Loss -₹0.40 Lakhs); Bhairav Robotics (45.33% Associate).
* AiTuring Technologies Deconsolidation: Stake diluted from 51% to 49% on September 18, 2025, following equity issuance to third parties at ₹4,000 per share. Deconsolidation derecognized ₹1.86 Crore ($213.31k / ₹185.90 Lakhs) of carried goodwill, resulting in a gain on loss of control of ₹94.24 Lakhs ($108.14k) recorded under Exceptional Items. Capital purchases from AiTuring stood at ₹6.14 Crore ($0.70M).
Consolidated Goodwill closed at ₹76.38 Crore ($8.76M / ₹7,638.36 Lakhs) (Opening ₹70.18 Crore + TISA ₹6.78 Crore + Anawave ₹1.28 Crore - AiTuring derecognition ₹1.86 Crore), with zero (₹0) consolidated impairment recognized.
On April 25, 2026 (post-balance-sheet), a fire at material subsidiary UTS damaged inventory with an estimated preliminary loss of ₹3.37 Crore ($386.70k), treated as a non-adjusting event fully covered by insurance.
To mitigate component supply chain vulnerabilities, consolidated foreign currency raw material expenditure stood at ₹60.94 Crore ($6.99M / ₹6,093.66 Lakhs, up from ₹46.83 Crore in FY25), with standalone direct raw material imports at ₹19.05 Crore ($2.19M / ₹1,904.55 Lakhs). Backward integration through Vector Technics (UAV brushless DC motors, ESCs, propellers) and UTS (wide-band electronic warfare receivers, RF jammers) mitigates component exposure.
Product platform developments across four divisions:
1. Combat Simulators (LVC): Over 1,000 systems deployed. Secured contract for India's first Combat Training Node at the Infantry School, Mhow (demonstrating force-on-force laser combat across 50+ simulators). Launched Zen FIST (Futuristic Integrated Solution for Training) integrating driving and gunnery simulators. Commercialized patents for Tank Containerised Crew Gunnery Simulator (T-90) and Infantry Virtual Training Simulation System (IWTS).
2. Counter-UAS (C-UAS): C-UAS EW system combat-proven in Operation Sindoor, detecting and jamming non-standard data links across 100 simultaneous threats under 0.1s. Integrated Hawkeye AI optronics (expanding passive optical tracking range from 7–8 km to 15 km with ±0.5 mrad accuracy) and VyomKavach hybrid rotary-gun/EW platforms. Holds manufacturing and ammunition licenses under the Arms Act for weapon integration (Barbarik and Parashu remote weapon stations).
3. Smart Firing Ranges: Zen STS (Smart Target System) with LOMAH (Location of Miss and Hit) acoustic tracking and MFTS (Multi-Functional Target System).
4. Robotics and Drones: Vrishabh UGV (autonomous ground vehicle, 150 kg payload, 100 km range, >85% local content, commercial launch FY27) and Hyperstrike loitering munition (400 km/h, 20 km range, 5-minute loiter, 4 kg airframe, 200 g payload).
ESG metrics are supported by a joint study with TERI (The Energy and Resources Institute) evaluating "Green Training" simulator adoption:
* Individual Light Vehicle Simulator: Abates 103 tonnes of $CO_2$ over 15 years; annual savings ₹56.00 Lakhs ($64.26k).
* Tank Driving Simulator: Abates 1,919 tonnes of $CO_2$ over 30 years; annual savings ₹136.34 Crore ($15.64M).
* Field Crew Gunnery Simulator: Abates 3,676 tonnes of $CO_2$ over 30 years; annual savings ₹381.20 Crore ($43.74M).
* IWTS Adoption: A 15% penetration across the Indian Armed Forces reduces annual spend by ₹461.20 Crore ($52.92M). A ₹15 Crore ($1.72M) simulator investment generates ₹380 Crore ($43.60M) in 30-year lifecycle savings. S&P Global ESG score reached 67 (Environmental 61, Social 72, Governance 69).
Macro policy frameworks support domestic market capture: Union Budget FY27 allocated ₹7.85 Lakh Crore ($90.08B) to Defence (+15.19% YoY), with ₹1.85 Lakh Crore ($21.23B) allocated to capital acquisitions, of which 75% is reserved for domestic firms under the Buy (Indian-IDDM) category. The Indian C-UAS market is projected to expand at a 24.4% CAGR to $1.39 Billion by 2030. Regulatory adjustments under the Draft DAP 2026 (introducing 10-year Long-Term Bulk Acquisition visibility) and DPM 2025 (overhauling ₹1 Lakh Crore of revenue procurement) shorten development timelines. The company holds a Dun & Bradstreet credit rating of 5A1.
HDIN Institutional Verdict
Management's target of ₹4,000 Crore ($459.04M) in cumulative turnover across FY27–FY28 requires revenue execution to scale significantly from FY26 levels. This target relies on converting ₹1,000 Crore ($114.75M) of the current ₹1,336.04 Crore backlog in FY27, alongside securing and executing additional orders. The temporary top-line deceleration in FY26 reflects procurement milestone lumpiness rather than structurally diminished order intake, as demonstrated by Q4 FY26 inflows of ₹431.36 Crore.
ROE compression to 11.83% consolidated was influenced by equity base expansion following the ₹1,000 Crore QIP. Capital allocation discipline is evidenced by ₹275.75 Crore ($31.64M) in unutilized liquid treasury funds, avoiding non-accretive M&A while acquiring targeted deep-tech capabilities (Vector, TISA, Anawave) to secure propulsion and naval software loops. The raw material inventory expansion (+106.01% to ₹99.63 Crore) increases working capital requirements in the short term, but provides a material buffer to support execution schedules starting in Q1 FY27.
Governance oversight was updated post-balance-sheet through the appointment of two additional Non-Executive Independent Directors: Mr. Jasthi Krishna Kishore (effective July 25, 2026) and Ms. Uma Priyadarshini Kollareddy (effective August 4, 2026). These appointments expand the Board to 8 members, establishing a 62.5% independent majority (5 Independent Directors) alongside Audit Committee independent dominance (67%). Supported by a debt-free balance sheet, high OCF/PAT conversion (112.24%), clean audit reports, and a 100% self-owned IP architecture exempt from foreign licensing constraints, Zen Technologies Limited maintains a structural position to capture domestic defense indigenization spend.
Presentation Download & Video Access:
- Presentation Download: Click the PDF download link under 'Related Topics' to access the full institutional presentation of this report.
- Video Link: Click this link to watch the HDIN analyst briefing on YouTube.
About HDIN Research:
HDIN Research is a premier global market intelligence and strategic advisory firm specializing in institutional-grade financial analysis, supply chain audits, and macroeconomic forecasting. Our dedicated sector analysts deliver actionable, data-driven insights tailored for private equity, hedge funds, and corporate strategy teams. Visit us at http://www.hdinresearch.com.
2026 AI Transparency Footer:
"This intelligence report was authored by HDIN Research analysts following a rigorous audit of official corporate filings. AI was utilized for massive-scale data synthesis and structural drafting, ensuring 100% inclusion of reported data points. All strategic insights, financial modeling, and final verdicts were verified by our editorial board to ensure professional accuracy and compliance with 2026 Google Search E-E-A-T standards."
1. Zen Technologies Limited [NSE: ZENTEC / BSE: 533339] recorded FY26 consolidated revenue of ₹687.69 Crore ($78.91M) amid procurement milestone shifts, while gross margins expanded 1,384 bps to 75.94% on high-IP software mix.
2. Consolidated order backlog closed at a record ₹1,336.04 Crore ($153.31M), with ₹1,000 Crore ($114.75M) scheduled for FY27 execution, supported by an inventory buffer of ₹188.19 Crore ($21.59M).
3. Net cash conversion cycle expanded to 399.1 days due to strategic raw material stockpiling (+106.01% YoY to ₹99.63 Crore), while receivables collections drove OCF/PAT to 112.24% with a debt-free treasury of ₹1,306.42 Crore ($149.91M).
Figure Zen Technologies FY 2025-26: The Strategic Pivot to a Sovereign Defense-Tech Platform
Segmental Realities and Margin ExpansionZen Technologies Limited [NSE: ZENTEC / BSE: 533339] reported FY26 consolidated financial results reflecting a transition from a dedicated simulator vendor to a platform entity spanning virtual/live simulation, counter-unmanned aerial systems (C-UAS), automated weapon stations, combat robotics, and naval command platforms. Consolidated top-line revenue moderated 29.37% YoY to ₹687.69 Crore ($78.91M) compared to ₹973.64 Crore ($111.72M) in FY25, driven by administrative invoicing shifts in sovereign defense procurement. Standalone revenue contracted 54.46% YoY to ₹423.77 Crore ($48.63M) from ₹930.67 Crore ($106.79M).
Despite top-line moderation, unit economics expanded. Consolidated gross profit stood at ₹522.21 Crore ($59.92M), yielding a gross margin of 75.94% (+1,384 bps YoY from 62.10% in FY25). This margin expansion was driven by a higher proportion of software-dense simulators and proprietary counter-drone installations. Consolidated raw material costs fell 46.32% YoY to ₹185.30 Crore ($21.26M), establishing a raw material cost-to-sales ratio of 26.94% (down from 35.45% in FY25). Accounting for work-in-progress and finished goods inventory adjustments of -₹19.83 Crore (-$2.28M), effective cost of goods sold (COGS) reached ₹165.47 Crore ($18.99M). Standalone gross margins expanded 980 bps to 62.50% on gross profit of ₹264.87 Crore ($30.40M) with COGS of ₹158.90 Crore ($18.23M) (raw materials ₹184.94 Crore / $21.22M, inventory adjustment -₹26.04 Crore / -$2.99M).
Consolidated reported EBITDA reached ₹332.66 Crore ($38.17M) representing a 48.37% margin, while operational EBITDA margin held at 35.95%. Group Profit After Tax (PAT) stood at ₹217.93 Crore ($25.01M) (-27.20% YoY from ₹299.33 Crore), with parent-attributed PAT (net of non-controlling interest) at ₹193.45 Crore ($22.20M). Standalone PAT reached ₹145.85 Crore ($16.74M) (-44.53% YoY from ₹262.95 Crore).
DuPont analysis reveals Consolidated Return on Equity (ROE) compressed to 11.83% in FY26 (down from 27.19% in FY25), decomposed into a Net Profit Margin of 31.69%, Asset Turnover of 0.3268x, and Financial Leverage of 1.1423x. Standalone ROE registered at 8.31%, decomposed into a Net Profit Margin of 34.42%, Asset Turnover of 0.2225x, and Financial Leverage of 1.0851x. ROE moderation was primarily driven by equity base dilution following the execution of a ₹1,000 Crore ($114.75M) Qualified Institutional Placement (QIP) late in the prior fiscal year, alongside delayed asset turnover.
Free Cash Flow (FCF) turned around to ₹185.79 Crore ($21.32M) consolidated, recovering from negative -₹1.27 Crore (-$0.15M) in FY25. The balance sheet carries zero standalone debt and a Consolidated Debt-to-Equity ratio of 0.002, supported by a cash and bank treasury buffer of ₹1,306.42 Crore ($149.91M) (and total group cash reserves of ₹1,308 Crore / $150.09M). Earnings quality strengthened as Consolidated Operating Cash Flow (OCF) to Net Profit reached 112.24% (OCF of ₹244.60 Crore / $28.07M), while Standalone OCF/PAT reached 156.67% (OCF of ₹228.51 Crore / $26.22M, up from ₹31.02 Crore / $3.56M in FY25), following cash collections of trade receivables.
Table Consolidated and Standalone Financial Performance Analysis (FY2025–FY2026)
| Financial Metric | Consolidated FY25 (INR Cr / $M) | Consolidated FY26 (INR Cr / $M) | Standalone FY25 (INR Cr / $M) | Standalone FY26 (INR Cr / $M) | YoY Change (Consolidated %) |
| Revenue from Operations | ₹973.64 ($111.72M) | ₹687.69 ($78.91M) | ₹930.67 ($106.79M) | ₹423.77 ($48.63M) | -29.37% |
| Sale of Products | ₹932.21 ($106.97M) | ₹611.11 ($70.12M) | ₹892.35 ($102.40M) | ₹386.40 ($44.34M) | -34.44% |
| Rendering of Services | ₹41.43 ($4.75M) | ₹76.58 ($8.79M) | ₹38.32 ($4.40M) | ₹37.37 ($4.29M) | +84.83% |
| Cost of Goods Sold (COGS) | ₹369.00 ($42.34M) | ₹165.47 ($18.99M) | ₹440.22 ($50.52M) | ₹158.90 ($18.23M) | -55.16% |
| Gross Profit | ₹604.64 ($69.38M) | ₹522.21 ($59.92M) | ₹490.45 ($56.28M) | ₹264.87 ($30.40M) | -13.63% |
| Gross Profit Margin % | 62.10% | 75.94% | 52.70% | 62.50% | +1,384 bps |
| Reported EBITDA | ₹393.80 ($45.19M) | ₹332.66 ($38.17M) | ₹358.12 ($41.09M) | ₹208.54 ($23.93M) | -15.53% |
| Net Profit After Tax (PAT) | ₹299.33 ($34.35M) | ₹217.93 ($25.01M) | ₹262.95 ($30.17M) | ₹145.85 ($16.74M) | -27.20% |
| Operating Cash Flow (OCF) | ₹31.05 ($3.56M) | ₹244.60 ($28.07M) | ₹31.02 ($3.56M) | ₹228.51 ($26.22M) | +687.76% |
| Free Cash Flow (FCF) | -₹1.27 (-$0.15M) | ₹185.79 ($21.32M) | -₹1.30 (-$0.15M) | ₹182.68 ($20.96M) | Turnaround |
| Domestic Revenue | ₹610.12 ($70.01M) | ₹609.03 ($69.89M) | ₹576.70 ($66.18M) | ₹423.17 ($48.56M) | -0.18% |
| Export Revenue | ₹363.52 ($41.71M) | ₹78.66 ($9.03M) | ₹353.97 ($40.62M) | ₹0.59 ($0.07M) | -78.36% |
The consolidated cash conversion cycle (CCC) expanded to 399.1 days in FY26 (up 186.6 days from 212.5 days in FY25), while standalone CCC expanded to 339.2 days (from 166.9 days). Consolidated Days Sales Outstanding (DSO) rose to 168.2 days (from 111.6 days; receivables turnover 2.17x vs. 3.27x), Standalone DSO reached 219.9 days (from 107.4 days; turnover 1.66x vs. 3.40x). Days Inventory Outstanding (DIO) expanded to 266.4 days consolidated (from 136.7 days; turnover 1.37x vs. 2.67x) and 142.6 days standalone (from 74.0 days; turnover 2.56x vs. 4.93x). Days Payable Outstanding (DPO) stood at 35.5 days consolidated (turnover 10.28x) and 23.2 days standalone (turnover 15.71x).
Inventory holding grew 57.79% YoY on a consolidated basis to ₹188.19 Crore ($21.59M / ₹18,818.61 Lakhs), up from ₹119.27 Crore ($13.69M). Consolidated raw materials surged 106.01% YoY to ₹99.63 Crore ($11.43M / ₹9,962.56 Lakhs) representing 52.94% of inventory. Work-in-Progress expanded 38.04% to ₹78.97 Crore ($9.06M / ₹7,897.29 Lakhs), finished goods rose 44.86% to ₹9.41 Crore ($1.08M / ₹941.23 Lakhs), stock-in-transit stood at ₹17.53 Lakhs ($0.02M), and stock-in-trade was ₹Nil. Standalone inventory expanded 64.53% to ₹83.94 Crore ($9.63M / ₹8,394.17 Lakhs), comprising raw materials of ₹33.14 Crore ($3.80M / ₹3,314.18 Lakhs, +26.20%), WIP of ₹42.92 Crore ($4.92M / ₹4,291.74 Lakhs, +75.91%), and finished goods of ₹7.88 Crore ($0.90M / ₹788.25 Lakhs, +2089.58%). This material accumulation positions the company to execute its scheduled orders.
Trade receivables collections liquidated prior milestone accumulation. Consolidated gross trade receivables fell to ₹225.83 Crore ($25.91M / ₹22,583.49 Lakhs) from ₹412.69 Crore in FY25, following cash collections of ₹197.71 Crore ($22.69M / ₹19,770.69 Lakhs). Standalone gross receivables dropped to ₹133.16 Crore ($15.28M / ₹13,315.90 Lakhs) from ₹380.18 Crore following collections of ₹255.34 Crore ($29.30M / ₹25,534.27 Lakhs).
Ageing analysis reveals that 78.93% of consolidated gross receivables reside in "Not Due" (₹67.25 Crore / $7.72M) and "< 6 Months" (₹111.00 Crore / $12.74M) buckets. Receivables in the 6–12 months bracket contracted 75.49% consolidated to ₹31.57 Crore ($3.62M) and 83.46% standalone to ₹21.03 Crore ($2.41M). The 1–2 years bracket carried ₹14.21 Crore ($1.63M) consolidated and ₹8.17 Crore ($0.94M) standalone; 2–3 years carried ₹33.83 Lakhs ($0.04M) consolidated and ₹10.72 Lakhs ($0.01M) standalone; > 3 years held ₹1.46 Crore ($0.17M / ₹145.99 Lakhs) on both bases.
Expected Credit Loss (ECL) provisions stood at ₹1.83 Crore ($209.82k / ₹182.85 Lakhs) consolidated (0.81% gross coverage) and ₹1.43 Crore ($164.11k / ₹143.02 Lakhs) standalone (1.07% gross coverage). The consolidated provision provides 125.25% coverage over balances older than three years. Contract assets (accrued unbilled income) reached ₹10.24 Crore ($1.18M / ₹1,024.20 Lakhs) consolidated and ₹8.16 Crore ($936.00k / ₹815.70 Lakhs) standalone. Government client security deposits stood at ₹63.73 Lakhs ($73.13k) consolidated and ₹62.44 Lakhs ($71.65k) standalone.
The group ended FY26 with a consolidated order book of ₹1,336.04 Crore ($153.31M) and a standalone order book of ₹1,222.60 Crore ($140.29M). Order inflows during Q4 FY26 reached ₹431.36 Crore ($49.50M), representing 32.29% of the outstanding book. Management targets ₹1,000 Crore ($114.75M) of conversion into revenue during FY27 (74.8% of the book), supporting cumulative two-year turnover guidance of ₹4,000 Crore ($459.04M) across FY27–FY28. Long-term margin targets remain set at 35% operational EBITDA and 25% PAT.
Customer concentration remains concentrated with sovereign counterparties: three primary clients accounted for 56.94% of consolidated revenue in FY26 (compared to a single client representing 60.96% in FY25). Standalone revenue concentration across three clients reached 74.41% (up from 63.77% in FY25).
Recurring service and Annual Maintenance Contract (AMC) revenues increased 84.83% YoY to ₹76.58 Crore ($8.79M / ₹7,657.92 Lakhs) consolidated, raising service contribution to 11.14% of total revenue. Standalone service revenues stabilized at ₹37.37 Crore ($4.29M / ₹3,736.53 Lakhs), or 8.82% of revenue. Fixed cost coverage analysis shows consolidated service revenue covers 33.35% of total base fixed operating overheads of ₹229.65 Crore ($26.35M) (employee benefits ₹126.94 Crore; other operating expenses ₹102.71 Crore). Standalone service revenue covers 32.49% of standalone fixed overheads of ₹115.01 Crore ($13.20M) (employee benefits ₹56.21 Crore; other expenses ₹58.80 Crore).
R&D accounting reflects a conservative stance: 100% of revenue R&D expenditure was expensed directly to the P&L statement, with zero (₹0) development costs capitalized on Intangible Assets under Development (IAUD) across consolidated and standalone books. Completed past development assets transferred out of IAUD to software amounted to ₹1.60 Crore ($183.93k / ₹160.29 Lakhs) consolidated and ₹1.38 Crore ($158.35k / ₹138.00 Lakhs) standalone, leaving a closing IAUD balance of ₹2.10 Crore ($240.97k / ₹210.00 Lakhs) on both bases.
Reported P&L R&D operating expenses reached ₹45.44 Crore ($5.21M / ₹4,544.13 Lakhs) consolidated (6.61% of sales) and ₹36.90 Crore ($4.23M / ₹3,689.60 Lakhs) standalone (8.70% of sales). Adjusting for non-cash depreciation on R&D assets of ₹47.86 Lakhs ($54.92k) and adding tangible R&D gross capex additions of ₹66.60 Lakhs ($76.42k), total cash R&D spend reached ₹45.63 Crore ($5.24M / ₹4,562.87 Lakhs) consolidated and ₹37.08 Crore ($4.26M / ₹3,708.34 Lakhs) standalone. Cumulative 5-year R&D investment reached ₹139.11 Crore ($15.96M). Zero technology was imported over the past three financial years, establishing 0% foreign technology licensing reliance.
Capital deployment from the August 2024 ₹1,000 Crore ($114.75M) QIP stands at 72.43% utilization (₹724.25 Crore / $83.11M spent):
* Working capital: ₹410.00 Crore ($47.05M) fully deployed (100.00%).
* Inorganic M&A: ₹171.42 Crore ($19.67M) deployed out of ₹350.00 Crore ($40.16M) allocated (48.98% utilization; ₹178.58 Crore / $20.49M unutilized).
* General Corporate: ₹122.34 Crore ($14.04M) deployed out of ₹219.51 Crore ($25.19M) allocated (55.73% utilization; ₹97.17 Crore / $11.15M unutilized).
* Issue expenses: ₹20.49 Crore ($2.35M) fully absorbed (100.00%). Unutilized QIP capital of ₹275.75 Crore ($31.64M) remains held in liquid treasury instruments.
Key Managerial Personnel (KMP) total remuneration fell 41.01% YoY to ₹14.99 Crore ($1.72M / ₹1,499.02 Lakhs). Executive commissions dropped in line with standalone PAT contraction (-44.53%):
* Chairman & MD Mr. Ashok Atluri received ₹8.03 Crore ($921,651.74 / ₹803.19 Lakhs, -37.83% YoY), comprising fixed salary ₹2.10 Crore, perquisites ₹3.16 Lakhs, and performance commission ₹5.90 Crore (-44.12% YoY from ₹10.56 Crore).
* President & Joint MD Mr. Kishore Dutt Atluri received ₹6.36 Crore ($729,607.97 / ₹635.83 Lakhs, -44.55% YoY), comprising fixed salary ₹2.10 Crore, perquisites ₹2.06 Lakhs, and commission ₹4.24 Crore (-54.47% YoY from ₹9.31 Crore).
* Whole-Time Director Mrs. Shilpa Choudari received ₹60.00 Lakhs ($68,849.34, +0.25% YoY; fixed salary ₹60.00 Lakhs, commission ₹0.00), with her appointment extended for three years from November 1, 2026, to October 31, 2029.
Remuneration for KMP relatives included Mr. Arjun Dutt Atluri (VP / Director Vector Technics) at ₹80.45 Lakhs ($92.32k), Ms. Anisha Atluri (Head Recruitment) at ₹28.05 Lakhs ($32.19k), and Ms. Abhilasha Atluri (Head IR) at ₹27.00 Lakhs ($30.98k). Mandatory CSR spend of ₹1.46 Crore ($167.98k) was disbursed through the Veer Sammaan Foundation.
The Board proposed a reduced final dividend of ₹1.00 per share (100% face value), totaling ₹9.03 Crore ($1.04M), representing a standalone payout ratio of 6.19% and a consolidated parent payout ratio of 4.67%.
Audit fees to statutory auditors M/s. Ramasamy Koteswara Rao and Co LLP totaled ₹18.70 Lakhs ($21.46k) (audit fees ₹15.00 Lakhs, non-audit certification ₹3.70 Lakhs, establishing a non-audit fee ratio of 24.67%). Statutory, cost, and secretarial audit reports (issued by CS P.S. Rao under Form MR-3) were unqualified and unmodified. Regulatory fines, whistleblowing actions, and POSH complaints stood at zero.
Supply Chain Architecture and Regional Moats
Zen Technologies Limited operates an IP-dense platform model that minimizes heavy structural fabrication in favor of internal system design, software development, sub-assembly outsourcing, and assembly and integration. The operational footprint centers on Hyderabad, Telangana:
* R&D Unit-I (Sanath Nagar, Hyderabad): Department of Scientific and Industrial Research (DSIR) recognized center for platform engineering.
* R&D Unit-II (Signature Towers, Kondapur, Hyderabad): Air-gapped software engineering hub for computer vision, AI algorithms, and adaptive training environments.
* Maheshwaram Production Unit (Hardware Park, Shamshabad, Hyderabad): Primary assembly, system integration, factory acceptance testing, and demonstration facility.
To expand capacity, the company is constructing an advanced manufacturing and R&D node at the Electronic Manufacturing Cluster (EMC) in Tuem, Goa. Consolidated Capital Work-in-Progress (CWIP) additions reached ₹9.79 Crore ($1.12M / ₹978.50 Lakhs) (standalone ₹9.47 Crore / $1.09M / ₹946.55 Lakhs), carrying a closing consolidated CWIP balance of ₹13.34 Crore ($1.53M / ₹1,333.88 Lakhs). Factory construction capital commitments stood at ₹6.63 Crore ($761.22k / ₹663.38 Lakhs).
Reconstructed capex additions for FY26 (consolidated total ₹59.13 Crore / $6.79M / ₹5,913.31 Lakhs; standalone total ₹45.83 Crore / $5.26M / ₹4,582.82 Lakhs) reflect ~80% expansion and ~20% maintenance allocations:
* Plant & Machinery: ₹15.96 Crore ($1.83M / ₹1,596.05 Lakhs) consolidated; ₹6.15 Crore ($705.96k / ₹615.22 Lakhs) standalone.
* Furniture & Fixtures: ₹14.28 Crore ($1.64M / ₹1,428.27 Lakhs) consolidated; ₹19.23 Crore ($2.21M / ₹1,922.58 Lakhs) standalone.
* Computers & Workstations: ₹6.46 Crore ($741.75k / ₹646.38 Lakhs) consolidated; ₹2.82 Crore ($323.64k / ₹282.04 Lakhs) standalone.
* Computer Software: ₹4.44 Crore ($509.15k / ₹443.71 Lakhs) consolidated; ₹2.90 Crore ($332.28k / ₹289.57 Lakhs) standalone.
* Buildings: ₹3.29 Crore ($377.45k / ₹328.94 Lakhs) consolidated; ₹1.97 Crore ($226.41k / ₹197.31 Lakhs) standalone.
* Vehicles: ₹2.78 Crore ($319.50k / ₹278.43 Lakhs) consolidated; ₹2.07 Crore ($237.53k / ₹207.00 Lakhs) standalone.
* Office & Testing Equipment: ₹2.13 Crore ($244.45k / ₹213.03 Lakhs) consolidated; ₹1.23 Crore ($140.63k / ₹122.55 Lakhs) standalone.
Audit of subsidiary financial disclosures (for the year ended March 31, 2026):
* Unistring Tech Solutions Private Limited (UTS) (51% Owned): Revenue ₹211.40 Crore ($24.26M / ₹21,140.35 Lakhs), Net Profit ₹56.01 Crore ($6.43M / ₹5,601.45 Lakhs; 26.49% PAT margin), Total Assets ₹216.59 Crore ($24.85M), Total Liabilities ₹93.21 Crore ($10.70M), Net Worth ₹123.37 Crore ($14.16M). Inter-company operating purchases from UTS were ₹75.74 Crore ($8.69M) standalone (down from ₹151.32 Crore in FY25), and capital purchases were ₹12.11 Crore ($1.39M).
* Applied Research International Private Limited (ARIPL) (100% Owned): Acquired remaining 24% stake in October 2025 for ₹37.90 Crore ($4.35M). Revenue ₹131.16 Crore ($15.05M / ₹13,116.45 Lakhs), Net Profit ₹39.68 Crore ($4.55M / ₹3,968.17 Lakhs; 30.25% PAT margin), Total Assets ₹128.09 Crore ($14.70M), Total Liabilities ₹20.36 Crore ($2.34M), Net Worth ₹107.73 Crore ($12.36M).
* Vector Technics Private Limited (51% Owned): Paid call money of ₹14.30 Crore ($1.64M) in FY26. Revenue ₹9.24 Crore ($1.06M / ₹924.36 Lakhs), Net Loss -₹4.92 Crore (-$564.52k / -₹491.96 Lakhs), Total Assets ₹28.35 Crore ($3.25M), Total Liabilities ₹14.46 Crore ($1.66M), Net Worth ₹13.89 Crore ($1.59M). Goodwill of ₹4.55 Crore ($522.26k / ₹455.13 Lakhs) was finalized upon conclusion of the measurement period on February 14, 2026. Inter-company loan extended by ZENTEC stood at ₹8.00 Crore ($917.99k) at commercial interest, yielding ₹13.16 Lakhs ($15.10k) interest income.
* Anawave Systems & Solutions Private Limited (76% Owned): Acquired November 21, 2025, for ₹7.00 Crore ($0.80M). Revenue ₹1.14 Lakhs ($1.31k), Net Profit ₹3.22 Lakhs ($3.69k), Total Assets ₹12.45 Crore ($1.43M), Total Liabilities ₹4.51 Crore ($517.23k), Net Worth ₹7.95 Crore ($911.90k). Transaction added ₹1.28 Crore ($147.28k / ₹128.35 Lakhs) to Goodwill.
* TISA Aerospace Private Limited (76% Owned): Acquired June 30, 2025, for ₹6.56 Crore ($0.75M / ₹656.18 Lakhs). Revenue ₹0.00, Net Loss -₹46.87 Lakhs (-$53.78k), Total Assets ₹4.08 Crore ($468.35k), Total Liabilities ₹4.90 Crore ($562.03k), Net Worth -₹81.64 Lakhs (-$93.68k). Transaction added ₹6.78 Crore ($777.84k / ₹677.85 Lakhs) to Goodwill.
* Zen Technologies Inc. (USA) (100% Owned): Revenue ₹0.00, Net Loss -₹5.64 Crore (-$647.75k / -₹564.49 Lakhs), Total Assets ₹91.99 Crore ($10.56M), Total Liabilities ₹4.64 Crore ($532.00k), Net Worth ₹87.35 Crore ($10.02M / ₹8,735.43 Lakhs), backed by a $10.00M capital infusion.
* Zen Defence Technologies L.L.C. (Abu Dhabi, UAE) (100% Owned): Revenue ₹0.00, Net Loss -₹1.37 Lakhs (-$1.57k), Total Assets ₹32.54 Lakhs ($37.34k), Total Liabilities ₹5.94 Lakhs ($6.82k), Net Worth ₹26.60 Lakhs ($30.52k).
* Non-Operating & Associate Entities: Zen Medical Technologies (100% Owned; PAT loss -₹2.19 Lakhs, written down to ₹Nil balance sheet value via a ₹37.70 Lakhs / $43.26k standalone impairment charge); Administrative Learning Private Limited (ALPL, 100% Owned; Revenue ₹6.11 Lakhs, Loss -₹0.40 Lakhs); Bhairav Robotics (45.33% Associate).
* AiTuring Technologies Deconsolidation: Stake diluted from 51% to 49% on September 18, 2025, following equity issuance to third parties at ₹4,000 per share. Deconsolidation derecognized ₹1.86 Crore ($213.31k / ₹185.90 Lakhs) of carried goodwill, resulting in a gain on loss of control of ₹94.24 Lakhs ($108.14k) recorded under Exceptional Items. Capital purchases from AiTuring stood at ₹6.14 Crore ($0.70M).
Consolidated Goodwill closed at ₹76.38 Crore ($8.76M / ₹7,638.36 Lakhs) (Opening ₹70.18 Crore + TISA ₹6.78 Crore + Anawave ₹1.28 Crore - AiTuring derecognition ₹1.86 Crore), with zero (₹0) consolidated impairment recognized.
On April 25, 2026 (post-balance-sheet), a fire at material subsidiary UTS damaged inventory with an estimated preliminary loss of ₹3.37 Crore ($386.70k), treated as a non-adjusting event fully covered by insurance.
To mitigate component supply chain vulnerabilities, consolidated foreign currency raw material expenditure stood at ₹60.94 Crore ($6.99M / ₹6,093.66 Lakhs, up from ₹46.83 Crore in FY25), with standalone direct raw material imports at ₹19.05 Crore ($2.19M / ₹1,904.55 Lakhs). Backward integration through Vector Technics (UAV brushless DC motors, ESCs, propellers) and UTS (wide-band electronic warfare receivers, RF jammers) mitigates component exposure.
Product platform developments across four divisions:
1. Combat Simulators (LVC): Over 1,000 systems deployed. Secured contract for India's first Combat Training Node at the Infantry School, Mhow (demonstrating force-on-force laser combat across 50+ simulators). Launched Zen FIST (Futuristic Integrated Solution for Training) integrating driving and gunnery simulators. Commercialized patents for Tank Containerised Crew Gunnery Simulator (T-90) and Infantry Virtual Training Simulation System (IWTS).
2. Counter-UAS (C-UAS): C-UAS EW system combat-proven in Operation Sindoor, detecting and jamming non-standard data links across 100 simultaneous threats under 0.1s. Integrated Hawkeye AI optronics (expanding passive optical tracking range from 7–8 km to 15 km with ±0.5 mrad accuracy) and VyomKavach hybrid rotary-gun/EW platforms. Holds manufacturing and ammunition licenses under the Arms Act for weapon integration (Barbarik and Parashu remote weapon stations).
3. Smart Firing Ranges: Zen STS (Smart Target System) with LOMAH (Location of Miss and Hit) acoustic tracking and MFTS (Multi-Functional Target System).
4. Robotics and Drones: Vrishabh UGV (autonomous ground vehicle, 150 kg payload, 100 km range, >85% local content, commercial launch FY27) and Hyperstrike loitering munition (400 km/h, 20 km range, 5-minute loiter, 4 kg airframe, 200 g payload).
ESG metrics are supported by a joint study with TERI (The Energy and Resources Institute) evaluating "Green Training" simulator adoption:
* Individual Light Vehicle Simulator: Abates 103 tonnes of $CO_2$ over 15 years; annual savings ₹56.00 Lakhs ($64.26k).
* Tank Driving Simulator: Abates 1,919 tonnes of $CO_2$ over 30 years; annual savings ₹136.34 Crore ($15.64M).
* Field Crew Gunnery Simulator: Abates 3,676 tonnes of $CO_2$ over 30 years; annual savings ₹381.20 Crore ($43.74M).
* IWTS Adoption: A 15% penetration across the Indian Armed Forces reduces annual spend by ₹461.20 Crore ($52.92M). A ₹15 Crore ($1.72M) simulator investment generates ₹380 Crore ($43.60M) in 30-year lifecycle savings. S&P Global ESG score reached 67 (Environmental 61, Social 72, Governance 69).
Macro policy frameworks support domestic market capture: Union Budget FY27 allocated ₹7.85 Lakh Crore ($90.08B) to Defence (+15.19% YoY), with ₹1.85 Lakh Crore ($21.23B) allocated to capital acquisitions, of which 75% is reserved for domestic firms under the Buy (Indian-IDDM) category. The Indian C-UAS market is projected to expand at a 24.4% CAGR to $1.39 Billion by 2030. Regulatory adjustments under the Draft DAP 2026 (introducing 10-year Long-Term Bulk Acquisition visibility) and DPM 2025 (overhauling ₹1 Lakh Crore of revenue procurement) shorten development timelines. The company holds a Dun & Bradstreet credit rating of 5A1.
HDIN Institutional Verdict
Management's target of ₹4,000 Crore ($459.04M) in cumulative turnover across FY27–FY28 requires revenue execution to scale significantly from FY26 levels. This target relies on converting ₹1,000 Crore ($114.75M) of the current ₹1,336.04 Crore backlog in FY27, alongside securing and executing additional orders. The temporary top-line deceleration in FY26 reflects procurement milestone lumpiness rather than structurally diminished order intake, as demonstrated by Q4 FY26 inflows of ₹431.36 Crore.
ROE compression to 11.83% consolidated was influenced by equity base expansion following the ₹1,000 Crore QIP. Capital allocation discipline is evidenced by ₹275.75 Crore ($31.64M) in unutilized liquid treasury funds, avoiding non-accretive M&A while acquiring targeted deep-tech capabilities (Vector, TISA, Anawave) to secure propulsion and naval software loops. The raw material inventory expansion (+106.01% to ₹99.63 Crore) increases working capital requirements in the short term, but provides a material buffer to support execution schedules starting in Q1 FY27.
Governance oversight was updated post-balance-sheet through the appointment of two additional Non-Executive Independent Directors: Mr. Jasthi Krishna Kishore (effective July 25, 2026) and Ms. Uma Priyadarshini Kollareddy (effective August 4, 2026). These appointments expand the Board to 8 members, establishing a 62.5% independent majority (5 Independent Directors) alongside Audit Committee independent dominance (67%). Supported by a debt-free balance sheet, high OCF/PAT conversion (112.24%), clean audit reports, and a 100% self-owned IP architecture exempt from foreign licensing constraints, Zen Technologies Limited maintains a structural position to capture domestic defense indigenization spend.
Presentation Download & Video Access:
- Presentation Download: Click the PDF download link under 'Related Topics' to access the full institutional presentation of this report.
- Video Link: Click this link to watch the HDIN analyst briefing on YouTube.
About HDIN Research:
HDIN Research is a premier global market intelligence and strategic advisory firm specializing in institutional-grade financial analysis, supply chain audits, and macroeconomic forecasting. Our dedicated sector analysts deliver actionable, data-driven insights tailored for private equity, hedge funds, and corporate strategy teams. Visit us at http://www.hdinresearch.com.
2026 AI Transparency Footer:
"This intelligence report was authored by HDIN Research analysts following a rigorous audit of official corporate filings. AI was utilized for massive-scale data synthesis and structural drafting, ensuring 100% inclusion of reported data points. All strategic insights, financial modeling, and final verdicts were verified by our editorial board to ensure professional accuracy and compliance with 2026 Google Search E-E-A-T standards."