Fox Corporation: Strategic Pivot to Platform Control via $12.0B Bridge Facility for Roku Acquisition as 9.8% Cord-Cutting Churn Pressures Linear Cash Flows
Date : 2026-08-10
Reading : 240
HDIN Executive Takeaways
1. Fox Corporation [NASDAQ: FOX / FOXA] delivered FY26 Adjusted EBITDA of $3,906 million on $17,126 million in total revenues, expanding gross margins by 116 basis points to 36.63% as rate escalations offset a 9.8% subscriber loss across cable networks.
2. The company committed $13.0 billion in new debt facilities ($12.0 billion bridge facility, $1.0 billion term loan) to fund its acquisition of Roku, Inc. at $96.00 per share in cash plus 0.9693 FOXA shares, shifting capital allocation from equity buybacks toward connected television (CTV) platform ownership.
3. Total off-balance sheet obligations reached $33,262 million—anchored by $24,365 million in unconditional sports broadcasting commitments—while a -$761 million non-operating mark-to-market loss on Flutter Entertainment plc equity reduced GAAP net income by 24.68% to $1,727 million.
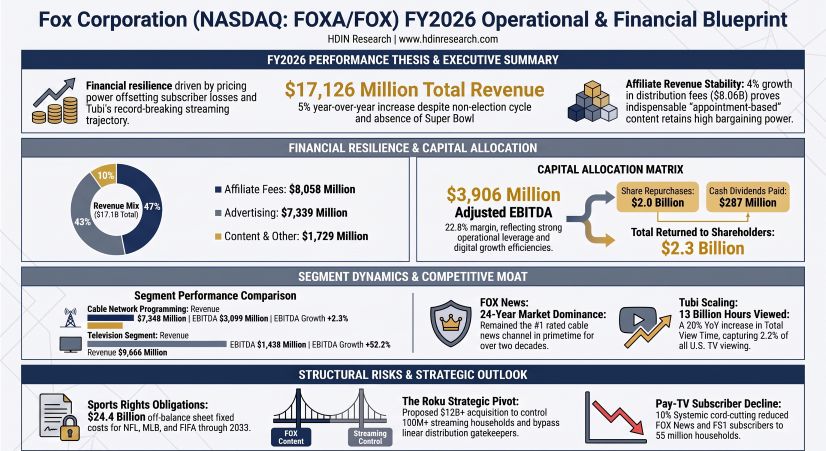
Figure Fox Corporation FY2026 Operational & Financial Blueprint
Segmental Realities, Financial Audit, and Margin Dynamics
Fox Corporation closed FY26 with top-line growth driven by sports programming contracts, digital advertising expansion via Tubi, and distribution rate increases. Consolidated revenue expanded +5.07% YoY (+$826 million) to $17,126 million, following FY25 revenues of $16,300 million (+16.59% YoY) and FY24 revenues of $13,980 million.
GAAP net income declined -24.68% YoY (-$566 million) to $1,727 million, down from $2,293 million in FY25 and $1,554 million in FY24. Net income attributable to stockholders stood at $1,685 million in FY26 (-25.54% YoY). Operating performance remained resilient: Adjusted EBITDA expanded +7.78% YoY (+$282 million) to $3,906 million, up from $3,624 million in FY25 (+25.70% YoY over FY24's $2,883 million).
Gross margin expanded 116 bps YoY to 36.63% (operating expenses of $10,853 million on $17,126 million revenue), compared to 35.47% in FY25 and 34.99% in FY24, delivering a cumulative 3-year expansion of 164 bps. Adjusted EBITDA margin reached 22.81% (+58 bps YoY from 22.23% in FY25 and 20.62% in FY24), representing a 219 bps expansion over the three-year audit period.
Distribution revenue grew +3.57% YoY (+$278 million) to $8,058 million, accounting for 47.05% of consolidated revenues. Higher average affiliate rates and a +$440 million increase in non-owned-and-operated affiliate fees successfully offset a -$160 million revenue reduction caused by pay-TV subscriber cord-cutting. Core network subscriber volume contracted sharply in FY26:
* FOX News Channel: Subscriber base dropped to 55 million (down 6 million or -9.8% from 61 million in FY25).
* Fox Sports 1 (FS1): Subscriptions fell to 55 million (down 6 million or -9.8% from 61 million in FY25).
* Fox Sports 2 (FS2): Subscriptions decreased to 39 million (down 5 million or -11.4% from 44 million in FY25).
* Big Ten Network (BTN): Subscriptions declined to 38 million (down 4 million or -9.5% from 42 million in FY25).
* FOX Business Network: Subscriptions fell to 52 million (down 8 million or -13.3% from 60 million in FY25).
Advertising revenue rose +6.90% YoY (+$474 million) to $7,339 million (42.85% of total revenues). This performance was achieved in a non-presidential election cycle and without broadcasting the Super Bowl (Super Bowl LIX aired on a competitor network in FY25). Monetization was sustained by the broadcast of the FIFA Men’s World Cup, expanded NFL and MLB postseason games, and programmatic ad growth at Tubi. Content licensing and other revenue expanded +4.47% YoY (+$74 million) to $1,729 million.
Table Segmental Operational and Financial Performance Matrix (FY2024–FY2026)
*Note: Indicates percentage expansion of negative balance/loss.
In Cable Network Programming, FY26 operating expense expansion (+8.76% to $3,562 million) was driven by sports rights amortization for the FIFA Men's World Cup and contractual NFL rate escalations. Segment EBITDA reached $3,099 million (+2.28%). Content licensing and sublicensing revenue within this segment reached $999 million (+4% YoY).
In Television, operating expenses decreased -2.83% to $7,101 million due to the absence of Super Bowl programming amortization, driving Segment EBITDA up +52.17% to $1,438 million. Corporate & Other revenues expanded +115.57% to $526 million, driven by distribution and subscription fees from FOX One (launched August 2025). However, launch-phase content acquisition and marketing pushed Corporate & Other EBITDA losses from -$351 million to -$631 million (+79.77% loss expansion). Intersegment eliminations rose from -$199 million in FY25 to -$414 million in FY26 (+108.04%) due to cross-segment content licensing between FOX networks and FOX One.
Free cash flow conversion remained strong: Operating cash flow reached $1,970 million in FY26 (114.07% conversion of net income), compared to $3,324 million in FY25 (144.96% conversion) and $1,840 million in FY24 (118.40% conversion). Capital expenditures surged +51.66% YoY to $502 million (up from $331 million in FY25 and $345 million in FY24), driven by a +130.49% jump in Television CapEx ($189 million) to construct ATSC 3.0 "NextGenTV" transmission infrastructure. Free Cash Flow (OCF minus CapEx) totaled $1,468 million in FY26, down from $2,993 million in FY25 and $1,495 million in FY24.
Shareholder payouts exceeded annual free cash flow:
* Cash Dividends: $287 million paid in FY26 ($0.56 per share, up from $0.54 in FY25 and $0.52 in FY24). The semi-annual dividend was increased to $0.29 per share ($0.58 annualized), with FY27 aggregate dividends projected at ~$245 million based on current share counts.
* Share Repurchases: Doubled to $2,000 million in FY26 (retiring 32 million shares), supported by a $1.5 billion Accelerated Share Repurchase (ASR) executed in October 2025 ($700 million Class A, $800 million Class B). Board repurchase authorization was expanded by $5.0 billion in August 2025 to $12.0 billion ($3.4 billion remaining as of June 30, 2026).
* Total Return / FCF Ratio: Reached 155.79% in FY26 ($2,287 million returned vs. $1,468 million FCF), funded by drawing down cash reserves from $5,351 million to $4,205 million.
Infrastructure Layout, Content Moats, and Off-Balance Sheet Liabilities
Fox Corporation’s physical infrastructure is centered around two main complexes:
* FOX Studio Lot (Los Angeles, CA): Spans over 50 acres with 1.8 million square feet of built space, including 15 acoustic sound stages, two broadcast studios, and a central master control unit.
* New York Corporate Headquarters: Located at 1211 Avenue of the Americas, housing executive offices and primary production facilities for FOX News Media.
The broadcast network footprint encompasses 29 full-power owned-and-operated (O&O) stations across 18 Designated Market Areas (DMAs), representing 38.7% national TV household reach before applying the UHF discount. FOX operates duopolies in 11 markets, including New York, Los Angeles, and Chicago, producing over 1,500 hours of local news weekly. The primary broadcast network reaches 209 local affiliate markets, maintaining a median audience age of 59 (versus ABC at 64, CBS at 63, and NBC at 60).
Total firm off-balance sheet commitments stand at $33,262 million. Long-term licensed sports and programming rights make up $24,365 million of this figure, with payout schedules structured as $5,746 million (<1 year), $10,619 million (1–3 years), $6,734 million (3–5 years), and $1,266 million (>5 years). Key sports contracts include:
* NFL: Rights secured through the 2033 season (NFL holds a termination option post-2029 season).
* MLB: Exclusive World Series, All-Star Game, and regular season rights through 2028.
* NASCAR: Cup Series coverage through calendar year 2031.
* Collegiate Sports: Multi-year rights for Big Ten Conference programming.
Operating lease liabilities total $962 million on the balance sheet (Right-of-Use assets: $851 million), with undiscounted lease obligations totaling $1,426 million ($81 million in FY27, $218 million in FY28–FY29, $179 million in FY30–FY31, and $948 million thereafter), calculated using a 5.0% discount rate with $464 million in imputed interest. Proprietary programming impairment charges rose to $90 million in FY26, up from $40 million in FY25 and $40 million in FY24.
Digital and streaming operations center on Tubi, a free ad-supported streaming television (FAST) platform. Tubi recorded 13 billion hours of total view time in FY26 (+20% YoY), capturing a 2.2% average share of total U.S. TV viewing according to Nielsen's *The Gauge*. Tubi's library features over 350,000 titles from 600+ partners, funded via revenue-sharing and non-exclusive licenses. Tubi premiered 50 original titles and over 20,000 creator-led episodes in FY26.
Active joint ventures, investments, and off-balance sheet assets feature distinct accounting treatments:
* Big Ten Network (BTN): 61% controlling equity interest; fully consolidated inside Cable Network Programming.
* United Football League (UFL): 32.2% equity interest (down from 42% initial stake following the January 2024 USFL/XFL merger); accounted for under the Equity Method inside Other Non-Current Assets. Recognized equity losses of -$20 million in FY26 (improving from -$29 million in FY25 and -$44 million in FY24).
* Flutter Entertainment plc: 2.5% equity interest (4.3 million ordinary shares) valued at fair value (Level 1) within Other Non-Current Assets. Share price volatility generated a -$761 million non-operating mark-to-market loss in FY26 GAAP Net Income.
* FanDuel Call Option: 10-year option (expiring December 2030) to acquire an 18.6% equity stake in FanDuel. Contractual exercise price stood at $4.7 billion as of June 30, 2026 (incorporating a 5% annual escalator on the January 2023 base of $3.7 billion). Unfunded and off-balance sheet.
* Venu Sports JV: Joint venture with ESPN and Warner Bros. Discovery discontinued on January 10, 2025, following a $220 million settlement with FuboTV ($80 million FOX share recorded in FY25 corporate expenses). All capitalized costs written off.
* Credible Minority Stake: Minority put option settled in full during FY26 for $208 million in cash. Remaining Level 3 redeemable noncontrolling interests decreased to $86 million (down from $288 million in FY25).
As of June 30, 2026, FOX's senior unsecured debt carried a principal value of $6,650 million (carrying value of $6,606 million, reflecting $44 million in unamortized discounts). The debt structure features zero short-term maturities:
* $2,000 million 4.709% Senior Notes due FY2029
* $600 million 3.500% Senior Notes due FY2030
* $1,250 million 6.500% Senior Notes due FY2033
* $1,250 million 5.476% Senior Notes due FY2039
* $1,550 million 5.576% Senior Notes due FY2049
* Weighted Average Coupon: 5.28%.
Net debt excluding lease liabilities stood at $2,401 million ($6,606 million debt minus $4,205 million cash), generating a net leverage ratio of 0.62x Adjusted EBITDA (up from 0.35x in FY25). Including lease liabilities, net leverage reached 0.86x (versus 0.58x in FY25). Interest coverage ratios remain high: Adjusted EBITDA / Net Interest Expense stood at 14.26x ($3,906 million / $274 million), while EBITDA / Gross Interest ($401 million) stood at 9.74x. EBIT ($3,345 million) / Gross Interest coverage registered at 8.34x. Credit ratings are maintained at Baa2 (Moody's) and BBB (S&P) with Stable outlooks.
HDIN Institutional Verdict: Governance Defenses, Legal Exposures, and Balance Sheet Re-leveraging
Fox Corporation’s dual-class capital structure concentrates operational and strategic control in the Murdoch family. Following the termination of the Murdoch Family Trust stockholders agreement on September 8, 2025, Class B voting shares were transferred to LGC Holdco, LLC (owned by LGC Family Trusts). LGC Holdco holds <1% of Class A stock but 38.8% of Class B voting stock. Voting decisions are directed by the Managing Director of Cruden 2, LLC (LGC Holdco's manager), an office appointed solely by Lachlan K. Murdoch (Executive Chair and CEO).
Under the 2025 Stockholders Agreement, the Murdoch voting block is capped at 44% of total outstanding Class B shares. If share buybacks shrink the outstanding float and push LGC Holdco’s voting weight above 44%, the entity must forfeit votes to enforce the 44% ceiling. FOX retains a contractual Right of First Refusal over third-party transfers of Class B shares. Class A (FOXA) shares gain voting rights only under specific conditions: corporate dissolution, asset sales, unpaid dividends, or mergers resulting in existing shareholders retaining <60% voting power.
Under Article VII of the Corporate Certificate of Incorporation, overlapping directors with News Corp (such as Lachlan Murdoch, Chair of News Corp) are granted explicit corporate opportunity waivers, shielding them from loyalty duty claims if commercial opportunities are directed to News Corp.
Legal and regulatory audits highlight ongoing operational and financial contingencies:
* Smartmatic Defamation Lawsuit: Smartmatic seeks $2.7 billion in damages over 2020 election broadcasts. Summary judgment arguments were heard on December 2, 2025; trial is anticipated in late 2026. Management has accrued $0, classifying losses as neither probable nor reasonably estimable.
* In re Fox Corporation Derivative Litigation: Ongoing shareholder derivative action in Delaware Chancery Court alleging breach of fiduciary duty. The court denied defendants' motion to dismiss in December 2024 and opened limited discovery on director independence in April 2025.
* Tubi VPPA Settlement: Class action regarding Video Privacy Protection Act allegations was granted final court approval in January 2025 (appeals dismissed June 2025). A parallel arbitration covering 23,000 individuals was settled in May 2025, with no material financial impact.
* U.K. Newspaper Matters Indemnity: Accrued liability stands at $20 million (down from $30 million in FY25), with FY26 revaluation generating a $2 million credit inside corporate expenses.
* Unrecognized Tax Benefits (UTBs): Tax reserves rose to $53 million in FY26 (up from $50 million in FY25 and $26 million in FY24), with $22 million poised to impact the effective tax rate if resolved favorably. Accrued interest and penalties total $19 million.
* 21CF Pre-Spin Tax Liabilities: Joint and several exposure for $5.8 billion in pre-spin transaction tax liabilities remains 100% indemnified by Disney and 21CF.
* Regulatory Developments: FCC scheduled an August 6, 2026 vote to eliminate the 39% national audience reach cap. Under a July 2026 order, the FCC will auction 160 MHz of C-Band satellite spectrum in 2027, requiring signal migration in top 75 PEA markets by December 2030.
The pending acquisition of Roku, Inc. (announced June 14, 2026) marks a significant shift in capital strategy. FOX agreed to pay $96.00 in cash plus 0.9693 shares of FOXA per share of Roku stock. To fund the cash consideration, FOX secured a $12.0 billion Bridge Facility ($11.0 billion available as of June 30, 2026) and a $1.0 billion Term Loan Facility (priced at SOFR + 1.250%).
This transaction will fundamentally alter FOX’s balance sheet. Drawing on the bridge loan will double or triple total debt, elevating net leverage well above its historic 0.62x baseline and introducing SOFR-linked variable interest rate exposure. Refinancing short-term bridge debt into permanent senior unsecured notes will lock in post-2026 interest rates, shifting cash flow priorities from share buybacks toward debt reduction and CTV platform integration.
Presentation Download & Video Access
- Presentation Download: Click the PDF download link under 'Related Topics' to access the full institutional presentation of this report.
- Video Link: Click this link to watch the HDIN analyst briefing on YouTube.
About HDIN Research
HDIN Research is a premier global market intelligence and strategic advisory firm specializing in institutional-grade financial analysis, supply chain audits, and macroeconomic forecasting. Our dedicated sector analysts deliver actionable, data-driven insights tailored for private equity, hedge funds, and corporate strategy teams. Visit us at http://www.hdinresearch.com.
2026 AI Transparency Footer
"This intelligence report was authored by HDIN Research analysts following a rigorous audit of official corporate filings. AI was utilized for massive-scale data synthesis and structural drafting, ensuring 100% inclusion of reported data points. All strategic insights, financial modeling, and final verdicts were verified by our editorial board to ensure professional accuracy and compliance with 2026 Google Search E-E-A-T standards."
1. Fox Corporation [NASDAQ: FOX / FOXA] delivered FY26 Adjusted EBITDA of $3,906 million on $17,126 million in total revenues, expanding gross margins by 116 basis points to 36.63% as rate escalations offset a 9.8% subscriber loss across cable networks.
2. The company committed $13.0 billion in new debt facilities ($12.0 billion bridge facility, $1.0 billion term loan) to fund its acquisition of Roku, Inc. at $96.00 per share in cash plus 0.9693 FOXA shares, shifting capital allocation from equity buybacks toward connected television (CTV) platform ownership.
3. Total off-balance sheet obligations reached $33,262 million—anchored by $24,365 million in unconditional sports broadcasting commitments—while a -$761 million non-operating mark-to-market loss on Flutter Entertainment plc equity reduced GAAP net income by 24.68% to $1,727 million.
Figure Fox Corporation FY2026 Operational & Financial Blueprint
Segmental Realities, Financial Audit, and Margin Dynamics
Fox Corporation closed FY26 with top-line growth driven by sports programming contracts, digital advertising expansion via Tubi, and distribution rate increases. Consolidated revenue expanded +5.07% YoY (+$826 million) to $17,126 million, following FY25 revenues of $16,300 million (+16.59% YoY) and FY24 revenues of $13,980 million.
GAAP net income declined -24.68% YoY (-$566 million) to $1,727 million, down from $2,293 million in FY25 and $1,554 million in FY24. Net income attributable to stockholders stood at $1,685 million in FY26 (-25.54% YoY). Operating performance remained resilient: Adjusted EBITDA expanded +7.78% YoY (+$282 million) to $3,906 million, up from $3,624 million in FY25 (+25.70% YoY over FY24's $2,883 million).
Gross margin expanded 116 bps YoY to 36.63% (operating expenses of $10,853 million on $17,126 million revenue), compared to 35.47% in FY25 and 34.99% in FY24, delivering a cumulative 3-year expansion of 164 bps. Adjusted EBITDA margin reached 22.81% (+58 bps YoY from 22.23% in FY25 and 20.62% in FY24), representing a 219 bps expansion over the three-year audit period.
Distribution revenue grew +3.57% YoY (+$278 million) to $8,058 million, accounting for 47.05% of consolidated revenues. Higher average affiliate rates and a +$440 million increase in non-owned-and-operated affiliate fees successfully offset a -$160 million revenue reduction caused by pay-TV subscriber cord-cutting. Core network subscriber volume contracted sharply in FY26:
* FOX News Channel: Subscriber base dropped to 55 million (down 6 million or -9.8% from 61 million in FY25).
* Fox Sports 1 (FS1): Subscriptions fell to 55 million (down 6 million or -9.8% from 61 million in FY25).
* Fox Sports 2 (FS2): Subscriptions decreased to 39 million (down 5 million or -11.4% from 44 million in FY25).
* Big Ten Network (BTN): Subscriptions declined to 38 million (down 4 million or -9.5% from 42 million in FY25).
* FOX Business Network: Subscriptions fell to 52 million (down 8 million or -13.3% from 60 million in FY25).
Advertising revenue rose +6.90% YoY (+$474 million) to $7,339 million (42.85% of total revenues). This performance was achieved in a non-presidential election cycle and without broadcasting the Super Bowl (Super Bowl LIX aired on a competitor network in FY25). Monetization was sustained by the broadcast of the FIFA Men’s World Cup, expanded NFL and MLB postseason games, and programmatic ad growth at Tubi. Content licensing and other revenue expanded +4.47% YoY (+$74 million) to $1,729 million.
Table Segmental Operational and Financial Performance Matrix (FY2024–FY2026)
| Segment / Metric | FY2024 ($M) | FY2025 ($M) | FY2026 ($M) | YoY Change (FY2026) |
|---|---|---|---|---|
| Cable Network Programming | ||||
| Revenue | $5,955 | $6,930 | $7,348 | +6.03% |
| Operating Expenses | $2,668 | $3,275 | $3,562 | +8.76% |
| Segment EBITDA | $2,693 | $3,030 | $3,099 | +2.28% |
| Capital Expenditures | N/A | $127 | $147 | +15.75% |
| Television | ||||
| Revenue | $7,875 | $9,325 | $9,666 | +3.66% |
| Operating Expenses | $6,372 | $7,308 | $7,101 | -2.83% |
| Segment EBITDA | $506 | $945 | $1,438 | +52.17% |
| Capital Expenditures | N/A | $82 | $189 | +130.49% |
| Corporate and Other | ||||
| Revenue | $209 | $244 | $526 | +115.57% |
| Segment EBITDA | $(316) | $(351) | $(631) | +79.77%* |
| Capital Expenditures | N/A | $122 | $166 | +36.07% |
| Intersegment Eliminations | $(59) | $(199) | $(414) | +108.04%* |
In Cable Network Programming, FY26 operating expense expansion (+8.76% to $3,562 million) was driven by sports rights amortization for the FIFA Men's World Cup and contractual NFL rate escalations. Segment EBITDA reached $3,099 million (+2.28%). Content licensing and sublicensing revenue within this segment reached $999 million (+4% YoY).
In Television, operating expenses decreased -2.83% to $7,101 million due to the absence of Super Bowl programming amortization, driving Segment EBITDA up +52.17% to $1,438 million. Corporate & Other revenues expanded +115.57% to $526 million, driven by distribution and subscription fees from FOX One (launched August 2025). However, launch-phase content acquisition and marketing pushed Corporate & Other EBITDA losses from -$351 million to -$631 million (+79.77% loss expansion). Intersegment eliminations rose from -$199 million in FY25 to -$414 million in FY26 (+108.04%) due to cross-segment content licensing between FOX networks and FOX One.
Free cash flow conversion remained strong: Operating cash flow reached $1,970 million in FY26 (114.07% conversion of net income), compared to $3,324 million in FY25 (144.96% conversion) and $1,840 million in FY24 (118.40% conversion). Capital expenditures surged +51.66% YoY to $502 million (up from $331 million in FY25 and $345 million in FY24), driven by a +130.49% jump in Television CapEx ($189 million) to construct ATSC 3.0 "NextGenTV" transmission infrastructure. Free Cash Flow (OCF minus CapEx) totaled $1,468 million in FY26, down from $2,993 million in FY25 and $1,495 million in FY24.
Shareholder payouts exceeded annual free cash flow:
* Cash Dividends: $287 million paid in FY26 ($0.56 per share, up from $0.54 in FY25 and $0.52 in FY24). The semi-annual dividend was increased to $0.29 per share ($0.58 annualized), with FY27 aggregate dividends projected at ~$245 million based on current share counts.
* Share Repurchases: Doubled to $2,000 million in FY26 (retiring 32 million shares), supported by a $1.5 billion Accelerated Share Repurchase (ASR) executed in October 2025 ($700 million Class A, $800 million Class B). Board repurchase authorization was expanded by $5.0 billion in August 2025 to $12.0 billion ($3.4 billion remaining as of June 30, 2026).
* Total Return / FCF Ratio: Reached 155.79% in FY26 ($2,287 million returned vs. $1,468 million FCF), funded by drawing down cash reserves from $5,351 million to $4,205 million.
Infrastructure Layout, Content Moats, and Off-Balance Sheet Liabilities
Fox Corporation’s physical infrastructure is centered around two main complexes:
* FOX Studio Lot (Los Angeles, CA): Spans over 50 acres with 1.8 million square feet of built space, including 15 acoustic sound stages, two broadcast studios, and a central master control unit.
* New York Corporate Headquarters: Located at 1211 Avenue of the Americas, housing executive offices and primary production facilities for FOX News Media.
The broadcast network footprint encompasses 29 full-power owned-and-operated (O&O) stations across 18 Designated Market Areas (DMAs), representing 38.7% national TV household reach before applying the UHF discount. FOX operates duopolies in 11 markets, including New York, Los Angeles, and Chicago, producing over 1,500 hours of local news weekly. The primary broadcast network reaches 209 local affiliate markets, maintaining a median audience age of 59 (versus ABC at 64, CBS at 63, and NBC at 60).
Total firm off-balance sheet commitments stand at $33,262 million. Long-term licensed sports and programming rights make up $24,365 million of this figure, with payout schedules structured as $5,746 million (<1 year), $10,619 million (1–3 years), $6,734 million (3–5 years), and $1,266 million (>5 years). Key sports contracts include:
* NFL: Rights secured through the 2033 season (NFL holds a termination option post-2029 season).
* MLB: Exclusive World Series, All-Star Game, and regular season rights through 2028.
* NASCAR: Cup Series coverage through calendar year 2031.
* Collegiate Sports: Multi-year rights for Big Ten Conference programming.
Operating lease liabilities total $962 million on the balance sheet (Right-of-Use assets: $851 million), with undiscounted lease obligations totaling $1,426 million ($81 million in FY27, $218 million in FY28–FY29, $179 million in FY30–FY31, and $948 million thereafter), calculated using a 5.0% discount rate with $464 million in imputed interest. Proprietary programming impairment charges rose to $90 million in FY26, up from $40 million in FY25 and $40 million in FY24.
Digital and streaming operations center on Tubi, a free ad-supported streaming television (FAST) platform. Tubi recorded 13 billion hours of total view time in FY26 (+20% YoY), capturing a 2.2% average share of total U.S. TV viewing according to Nielsen's *The Gauge*. Tubi's library features over 350,000 titles from 600+ partners, funded via revenue-sharing and non-exclusive licenses. Tubi premiered 50 original titles and over 20,000 creator-led episodes in FY26.
Active joint ventures, investments, and off-balance sheet assets feature distinct accounting treatments:
* Big Ten Network (BTN): 61% controlling equity interest; fully consolidated inside Cable Network Programming.
* United Football League (UFL): 32.2% equity interest (down from 42% initial stake following the January 2024 USFL/XFL merger); accounted for under the Equity Method inside Other Non-Current Assets. Recognized equity losses of -$20 million in FY26 (improving from -$29 million in FY25 and -$44 million in FY24).
* Flutter Entertainment plc: 2.5% equity interest (4.3 million ordinary shares) valued at fair value (Level 1) within Other Non-Current Assets. Share price volatility generated a -$761 million non-operating mark-to-market loss in FY26 GAAP Net Income.
* FanDuel Call Option: 10-year option (expiring December 2030) to acquire an 18.6% equity stake in FanDuel. Contractual exercise price stood at $4.7 billion as of June 30, 2026 (incorporating a 5% annual escalator on the January 2023 base of $3.7 billion). Unfunded and off-balance sheet.
* Venu Sports JV: Joint venture with ESPN and Warner Bros. Discovery discontinued on January 10, 2025, following a $220 million settlement with FuboTV ($80 million FOX share recorded in FY25 corporate expenses). All capitalized costs written off.
* Credible Minority Stake: Minority put option settled in full during FY26 for $208 million in cash. Remaining Level 3 redeemable noncontrolling interests decreased to $86 million (down from $288 million in FY25).
As of June 30, 2026, FOX's senior unsecured debt carried a principal value of $6,650 million (carrying value of $6,606 million, reflecting $44 million in unamortized discounts). The debt structure features zero short-term maturities:
* $2,000 million 4.709% Senior Notes due FY2029
* $600 million 3.500% Senior Notes due FY2030
* $1,250 million 6.500% Senior Notes due FY2033
* $1,250 million 5.476% Senior Notes due FY2039
* $1,550 million 5.576% Senior Notes due FY2049
* Weighted Average Coupon: 5.28%.
Net debt excluding lease liabilities stood at $2,401 million ($6,606 million debt minus $4,205 million cash), generating a net leverage ratio of 0.62x Adjusted EBITDA (up from 0.35x in FY25). Including lease liabilities, net leverage reached 0.86x (versus 0.58x in FY25). Interest coverage ratios remain high: Adjusted EBITDA / Net Interest Expense stood at 14.26x ($3,906 million / $274 million), while EBITDA / Gross Interest ($401 million) stood at 9.74x. EBIT ($3,345 million) / Gross Interest coverage registered at 8.34x. Credit ratings are maintained at Baa2 (Moody's) and BBB (S&P) with Stable outlooks.
HDIN Institutional Verdict: Governance Defenses, Legal Exposures, and Balance Sheet Re-leveraging
Fox Corporation’s dual-class capital structure concentrates operational and strategic control in the Murdoch family. Following the termination of the Murdoch Family Trust stockholders agreement on September 8, 2025, Class B voting shares were transferred to LGC Holdco, LLC (owned by LGC Family Trusts). LGC Holdco holds <1% of Class A stock but 38.8% of Class B voting stock. Voting decisions are directed by the Managing Director of Cruden 2, LLC (LGC Holdco's manager), an office appointed solely by Lachlan K. Murdoch (Executive Chair and CEO).
Under the 2025 Stockholders Agreement, the Murdoch voting block is capped at 44% of total outstanding Class B shares. If share buybacks shrink the outstanding float and push LGC Holdco’s voting weight above 44%, the entity must forfeit votes to enforce the 44% ceiling. FOX retains a contractual Right of First Refusal over third-party transfers of Class B shares. Class A (FOXA) shares gain voting rights only under specific conditions: corporate dissolution, asset sales, unpaid dividends, or mergers resulting in existing shareholders retaining <60% voting power.
Under Article VII of the Corporate Certificate of Incorporation, overlapping directors with News Corp (such as Lachlan Murdoch, Chair of News Corp) are granted explicit corporate opportunity waivers, shielding them from loyalty duty claims if commercial opportunities are directed to News Corp.
Legal and regulatory audits highlight ongoing operational and financial contingencies:
* Smartmatic Defamation Lawsuit: Smartmatic seeks $2.7 billion in damages over 2020 election broadcasts. Summary judgment arguments were heard on December 2, 2025; trial is anticipated in late 2026. Management has accrued $0, classifying losses as neither probable nor reasonably estimable.
* In re Fox Corporation Derivative Litigation: Ongoing shareholder derivative action in Delaware Chancery Court alleging breach of fiduciary duty. The court denied defendants' motion to dismiss in December 2024 and opened limited discovery on director independence in April 2025.
* Tubi VPPA Settlement: Class action regarding Video Privacy Protection Act allegations was granted final court approval in January 2025 (appeals dismissed June 2025). A parallel arbitration covering 23,000 individuals was settled in May 2025, with no material financial impact.
* U.K. Newspaper Matters Indemnity: Accrued liability stands at $20 million (down from $30 million in FY25), with FY26 revaluation generating a $2 million credit inside corporate expenses.
* Unrecognized Tax Benefits (UTBs): Tax reserves rose to $53 million in FY26 (up from $50 million in FY25 and $26 million in FY24), with $22 million poised to impact the effective tax rate if resolved favorably. Accrued interest and penalties total $19 million.
* 21CF Pre-Spin Tax Liabilities: Joint and several exposure for $5.8 billion in pre-spin transaction tax liabilities remains 100% indemnified by Disney and 21CF.
* Regulatory Developments: FCC scheduled an August 6, 2026 vote to eliminate the 39% national audience reach cap. Under a July 2026 order, the FCC will auction 160 MHz of C-Band satellite spectrum in 2027, requiring signal migration in top 75 PEA markets by December 2030.
The pending acquisition of Roku, Inc. (announced June 14, 2026) marks a significant shift in capital strategy. FOX agreed to pay $96.00 in cash plus 0.9693 shares of FOXA per share of Roku stock. To fund the cash consideration, FOX secured a $12.0 billion Bridge Facility ($11.0 billion available as of June 30, 2026) and a $1.0 billion Term Loan Facility (priced at SOFR + 1.250%).
This transaction will fundamentally alter FOX’s balance sheet. Drawing on the bridge loan will double or triple total debt, elevating net leverage well above its historic 0.62x baseline and introducing SOFR-linked variable interest rate exposure. Refinancing short-term bridge debt into permanent senior unsecured notes will lock in post-2026 interest rates, shifting cash flow priorities from share buybacks toward debt reduction and CTV platform integration.
Presentation Download & Video Access
- Presentation Download: Click the PDF download link under 'Related Topics' to access the full institutional presentation of this report.
- Video Link: Click this link to watch the HDIN analyst briefing on YouTube.
About HDIN Research
HDIN Research is a premier global market intelligence and strategic advisory firm specializing in institutional-grade financial analysis, supply chain audits, and macroeconomic forecasting. Our dedicated sector analysts deliver actionable, data-driven insights tailored for private equity, hedge funds, and corporate strategy teams. Visit us at http://www.hdinresearch.com.
2026 AI Transparency Footer
"This intelligence report was authored by HDIN Research analysts following a rigorous audit of official corporate filings. AI was utilized for massive-scale data synthesis and structural drafting, ensuring 100% inclusion of reported data points. All strategic insights, financial modeling, and final verdicts were verified by our editorial board to ensure professional accuracy and compliance with 2026 Google Search E-E-A-T standards."