News Corporation FY2026 Strategic Blueprint: High-Margin B2B Data and Digital Prop-Tech Expansion Replaces Legacy Media Cycles
Date : 2026-08-12
Reading : 130
HDIN Executive Takeaways
1. News Corporation [NASDAQ: NWSA / NWS] expanded FY2026 consolidated revenue 6.81% YoY to $9,028 million, driven by Digital Real Estate Services and Dow Jones, which generated 76.7% of gross segment EBITDA.
2. Consolidated Free Cash Flow rose 42.03% YoY to $811 million, supporting $782 million in total share buybacks while maintaining a net cash surplus of $106 million and $3,224 million in total liquidity.
3. Professional Information Business revenues grew 9.41% to $988 million, buffering print advertising declines (-2%) and insulating earnings via high-margin enterprise workflow integrations in London, Sydney, and New York.
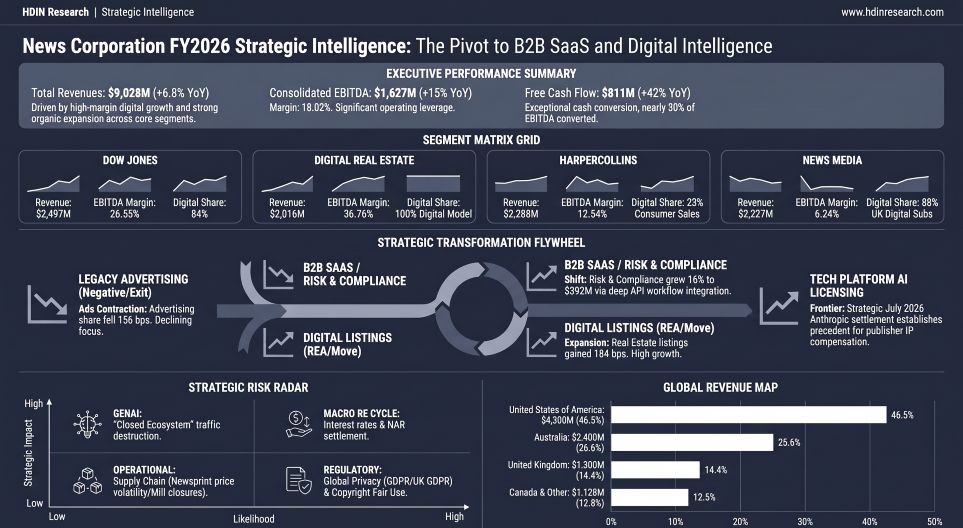
Figure News Corporation FY2026 Strategic Intelligence: The Pivot to B2B SaaS and Digital Intelligence
 Segmental Realities, EBITDA Operating Leverage, and Financial Architecture
News Corporation demonstrated operating leverage during FY2026, driven by a portfolio transition toward recurring digital subscriptions and enterprise data services. Consolidated revenues reached $9,028 million, representing a 6.81% increase from $8,452 million in FY2025 and $8,252 million in FY2024. Total Segment EBITDA expanded 14.98% YoY to $1,627 million (up from $1,415 million in FY2025 and $1,241 million in FY2024), yielding a 128 basis point margin expansion to 18.02%.
Deconstructing the $576 million top-line expansion in FY2026 reveals $189 million in foreign exchange tailwinds (+2.24% growth impact), $31 million from publishing acquisitions (+0.37% impact), and $356 million in organic growth (+4.21% impact), driven by price increases across Dow Jones Professional Information Business (PIB) and premium property listings at Move, Inc.
Table Segment Revenue Contribution and EBITDA Performance Analysis (FY2024–FY2026)
GAAP Net Income from continuing operations expanded 14.66% YoY to $743 million (up from $648 million in FY2025 and $379 million in FY2024). Total consolidated Net Income reached $743 million, compared to $1,340 million in FY2025 (which included $692 million from discontinued operations tied to the Foxtel Group sale, incorporating a $716 million pre-tax gain) and $354 million in FY2024. Net Income attributable to News Corporation stockholders stood at $573 million ($1,180 million in FY2025; $266 million in FY2024).
The revenue model disaggregation highlights a structural shift away from traditional advertising toward high-margin recurring streams:
* Circulation and Subscription: $3,203 million (35.48% of total; +23 bps portfolio shift since FY2024)
* Consumer (Book Sales): $2,185 million (24.20% of total; -4 bps portfolio shift)
* Real Estate (Listing & Referral Fees): $1,571 million (17.40% of total; +184 bps portfolio shift)
* Advertising: $1,391 million (15.41% of total; -156 bps portfolio shift)
* Other (Licensing & Ancillary): $678 million (7.51% of total; -48 bps portfolio shift)
Within Dow Jones, the Professional Information Business generated $988 million (+9.41% YoY), representing 39.57% of segment revenues. This was led by Risk & Compliance at $392 million (+16.32% YoY), Dow Jones Energy (OPIS/CMA) at $301 million (+8.27% YoY), and Other Information Services (Factiva and Dow Jones Newswires) at $295 million (+2.43% YoY). Consumer Circulation and Other revenues reached $1,032 million (+5.20% YoY), while Dow Jones advertising revenues stood at $418 million (16.74% of segment top-line).
Operating Cash Flow from continuing operations grew 26.48% YoY to $1,237 million ($978 million in FY2025; $897 million in FY2024). Capital Expenditures totaled $426 million (4.72% of revenues), comprising $105 million in Dow Jones, $160 million in Digital Real Estate, $31 million in Book Publishing, $117 million in News Media, and $13 million in Corporate. Free Cash Flow increased 42.03% to $811 million ($571 million in FY2025; $540 million in FY2024), representing a Segment EBITDA-to-FCF conversion rate of 49.85%.
Working capital changes generated a $145 million cash drag in FY2026 (improving from $206 million in FY2025). Net Receivables ended at $1,757 million (Gross $1,807 million minus $50 million allowance), generating a $(237) million cash flow impact. Net Inventories declined to $302 million ($327 million in FY2025), yielding a $33 million cash inflow. Deferred subscription revenue expanded to $543 million (up from $498 million in FY2025), driven by $3,278 million in current-year deferrals against $3,229 million in revenue recognition. Capitalized software amortization rose to $304 million (net software asset carrying value of $703 million; construction in progress of $93 million).
Operational Footprint, Platform Mechanics, and Capital Structure
News Corporation's operational transition is supported by digital subscription networks and property platforms across three major geographical hubs: the United States ($4,200 million revenue / 46.52% share), Australia ($2,400 million revenue / 26.58% share), the United Kingdom ($1,300 million revenue / 14.40% share), and Canada/Other International markets ($1,128 million revenue / 12.50% share).
The digital news subscription footprint reached 6.258 million digital-only subscribers (+9% YoY) out of 6.725 million total subscriptions (+7% YoY) at Dow Jones (print: 467,000). The Wall Street Journal reached 4.465 million digital-only subscribers (+8% YoY; 92.50% mix) out of 4.827 million total (print: 362,000). Barron’s Group achieved 1.512 million digital-only subscribers (+15% YoY; 94.38% mix) out of 1.602 million total (print: 90,000). In Australia, aggregate digital closing subscribers reached 981,000, led by *The Australian* (341,975 paid subscribers), *Herald Sun* (148,753), *The Daily Telegraph* (140,808), *The Courier Mail* (131,947), and *The Advertiser* (106,468). In the U.K., *The Times & Sunday Times* reached 681,000 digital-only subscribers (88.10% mix) out of 773,000 total paid subscribers (print: 92,000 de-duplicated).
Average monthly audience engagement includes:
* WSJ Digital Network: 58 million unique users (195 million monthly visits); WSJ: 35 million unique (130 million visits); MarketWatch: 12 million unique (43 million visits).
* Post Digital Network: 86.5 million unique users.
* The Sun (Global): 65 million unique users.
* Realtor.com (Move): 68 million unique users (297 million monthly visits).
* realestate.com.au (REA Group): 12.7 million unique visitors (146.4 million monthly visits; 3.5x nearest Australian competitor); realcommercial.com.au: 2.9 million visitors.
* Factiva: 852,000 active institutional users accessing 33,000+ sources across 33 languages in 200+ countries.
The corporate balance sheet reflects a Net Cash position of $106 million, backed by $2,095 million in cash and cash equivalents ($1,840 million accessible; $255 million held by REA Group) against $1,989 million in carrying debt ($2,000 million total principal). Undrawn liquidity totals $1,129 million ($1,000 million via the 2026 Revolving Facility; $129.0 million / A$200 million via REA Group's facility), creating a total liquidity buffer of $3,224 million. Gross leverage stands at 1.22x, while Adjusted Accessible Net Debt-to-EBITDA is 0.09x (covenant ceiling: 3.50x). Return on Invested Capital (ROIC) reached 8.09% in FY2026, an expansion of 164 bps driven by NOPAT of $731.62 million (EBIT $1,029 million; effective tax rate 28.9%) on average invested capital of $9,039 million.
Table Debt Obligations, Financing Commitments, and Maturity Profile Analysis
*Note: News Corporation hedged $450 million of the floating Term Loan A exposure via an interest rate swap cash flow hedge.
Expected annual interest payments total $382 million (FY27: $82M; FY28: $92M; FY29: $92M; FY30: $45M; FY31: $45M; Thereafter: $26M), bringing total annual debt service to $2,382 million.
Capital allocation outflows in FY2026 totaled $1,569 million:
1. Share Buybacks ($782M): $641 million spent by News Corporation repurchasing 23.7 million shares (16.2M Class A, 7.5M Class B; $667M remains authorized under the 2025 program); $141 million (A$200M) repurchased by REA Group.
2. Capital Expenditures ($426M): Infrastructure and software capitalization.
3. Dividends ($204M): $112 million to News Corporation stockholders ($0.20 per share); $92 million to REA Group minority stockholders.
4. M&A Acquisitions ($122M): Added $131 million to goodwill ($94M Digital Real Estate, $29M Dow Jones).
5. Purchases of Investments ($60M): Strategic equity investments.
6. Net Debt Inflow ($(25)M): Net borrowing drawdowns.
Total consolidated assets ended at $15,544 million. Intangible assets and goodwill total $6,379 million (41.04% of assets), comprising $4,542 million in Goodwill (Dow Jones: $2,268M; Digital Real Estate: $1,712M; Book Publishing: $423M; News Media: $139M) and $1,837 million in Net Intangibles. Indefinite-lived intangibles include Newspaper Mastheads ($281M), Trademarks/Tradenames ($272M), Book Publishing Imprints ($239M), and Radio Licenses ($109M). Amortizable intangibles comprise Customer Relationships ($671M; 3-25 yrs), Publishing Rights ($245M; 3-30 yrs), and Other ($20M).
Impairments totaled $27 million in FY2026 ($9 million indefinite-lived intangible asset impairment; $18 million long-lived asset write-downs), down from $12 million in FY2025 and $44 million in FY2024 (which included $22 million for News UK / DMG Media print plant consolidation). Restructuring charges reached $86 million in FY2026 ($120M in FY2025; $89M in FY2024), 100% allocated to one-time employee termination severance benefits. Cumulative restructuring cash settlements since FY2024 stand at $310 million ($108M paid in FY2026), leaving a balance sheet provision liability of $68 million.
Subsidiary structures specify a 62.0% direct controlling interest in REA Group Limited (38.0% public NCI balance sheet carrying value: $710M; FY2026 NCI net income allocation: $170M). Move, Inc. is owned 80.0% directly by News Corporation and 20.0% by REA Group, yielding a 92.4% effective economic interest and a 7.6% indirect NCI. REA Group signed a binding agreement in July 2026 to sell REA India (Housing.com). Planitar Inc. is owned 61.5% by REA Group.
The dual-class share capital architecture comprises 360,503,747 Class A non-voting shares (NWSA; 66.6% equity share) and 180,548,891 Class B voting shares (NWS; 33.4% equity share) as of July 31, 2026. LGC Holdco, LLC (controlled by Chair Lachlan K. Murdoch) holds 62,325,477 Class B shares, representing 34.52% voting control. Under the New Stockholders Agreement executed September 8, 2025, a strict collective voting cap of 44.00% is established via mandatory vote forfeiture during corporate share repurchases.
Macro sensitivities dictate that a $0.01 movement in the USD/AUD exchange rate impacts annual revenue by ±$37 million and Segment EBITDA by ±$12 million; a $0.01 movement in USD/GBP impacts revenue by ±$11 million and EBITDA by ±$2 million. Defined benefit pension obligations carry an accumulated net pre-tax loss of $429 million; a ±25 bps discount rate change shifts the Projected Benefit Obligation by +$17 million / -$18 million.
Data privacy non-compliance statutory caps expose the firm to maximum fines of €20 million ($22.612 million) or 4% of turnover under EU GDPR, and £17.5 million ($23.086 million) or 4% under UK GDPR / Data (Use and Access) Act 2025. In the US, California CCPA/CPRA enforcement applies automated decision disclosures effective January 2026. Australia's Privacy Act Amendment Bill 2024 mandates a children's privacy code by December 2026.
Active legal proceedings include:
* OPIS PVC Pricing Class Actions: Settled in May 2025 (preliminary approval July 2025). OPIS is complying with a U.S. DOJ grand jury subpoena (issued Jan 2025) and a state AG Civil Investigative Demand (Apr 2025).
* HarperCollins Amazon Antitrust Case: SDNY class actions dismissed with prejudice; appeal rights reserved by plaintiffs.
* U.K. Newspaper Matters: Accrued civil phone-hacking liability of $8 million, fully indemnified by FOX Corporation (indemnification receivable: $17 million under current assets). Net FY2026 SG&A cash expense was $1 million ($9M in FY2025; $8M in FY2024).
* Anthropic PBC IP Class Action: Settlement received final court approval in July 2026 (HarperCollins eligible class member; zero proceeds recognized in FY2026).
* Unrecognized Tax Benefits (ASC 740): Reduced to $73 million ($13 million affects effective tax rate). Accrued tax interest/penalties stand at $4 million. Net cash tax paid in FY2026 was $272 million ($185M Australia, $54M UK, $15M US States, $1M US Federal, $17M Other). Open tax audit years span US Federal (FY23-FY25), Australia (FY21-FY25), and the U.K. (2000, 2003, 2005, 2012-2025).
HDIN Institutional Verdict
News Corporation’s structural transition from legacy print advertising (now down to 15.41% of total revenues) toward enterprise B2B data subscriptions and high-margin digital real estate platforms has stabilized its financial foundation. The Professional Information Business within Dow Jones (growing 9.41% to $988 million) and REA Group’s 36.76% EBITDA margins provide structural insulation against print media advertising headwinds (-2%) and cyclical housing pressures in the United States.
However, operational drags persist within Book Publishing—where $29 million in one-time inventory write-offs and customer receivable defaults compressed margins to 12.54%—and Move/Realtor.com, which remains exposed to elevated U.S. mortgage rates and shifting MLS listing dynamics following National Association of Realtors class-action settlements.
The company's balance sheet discipline is demonstrated by its $106 million net cash surplus, $3,224 million liquidity buffer, and $782 million capital return execution. The 44.00% Murdoch voting cap provides governance clarity during buyback executions. Long-term value creation depends on expanding enterprise Risk & Compliance data integrations and successfully monetizing publisher IP through structured technology licensing agreements, as demonstrated by the Anthropic class-action settlement framework.
Presentation Download & Video Access:
Presentation Download: Click the PDF download link under 'Related Topics' to access the full institutional presentation of this report.
Video Link: Click this link to watch the HDIN analyst briefing on YouTube.
About HDIN Research:
HDIN Research is a premier global market intelligence and strategic advisory firm specializing in institutional-grade financial analysis, supply chain audits, and macroeconomic forecasting. Our dedicated sector analysts deliver actionable, data-driven insights tailored for private equity, hedge funds, and corporate strategy teams. Visit us at http://www.hdinresearch.com.
2026 AI Transparency Footer:
"This intelligence report was authored by HDIN Research analysts following a rigorous audit of official corporate filings. AI was utilized for massive-scale data synthesis and structural drafting, ensuring 100% inclusion of reported data points. All strategic insights, financial modeling, and final verdicts were verified by our editorial board to ensure professional accuracy and compliance with 2026 Google Search E-E-A-T standards."
1. News Corporation [NASDAQ: NWSA / NWS] expanded FY2026 consolidated revenue 6.81% YoY to $9,028 million, driven by Digital Real Estate Services and Dow Jones, which generated 76.7% of gross segment EBITDA.
2. Consolidated Free Cash Flow rose 42.03% YoY to $811 million, supporting $782 million in total share buybacks while maintaining a net cash surplus of $106 million and $3,224 million in total liquidity.
3. Professional Information Business revenues grew 9.41% to $988 million, buffering print advertising declines (-2%) and insulating earnings via high-margin enterprise workflow integrations in London, Sydney, and New York.
Figure News Corporation FY2026 Strategic Intelligence: The Pivot to B2B SaaS and Digital Intelligence
Segmental Realities, EBITDA Operating Leverage, and Financial ArchitectureNews Corporation demonstrated operating leverage during FY2026, driven by a portfolio transition toward recurring digital subscriptions and enterprise data services. Consolidated revenues reached $9,028 million, representing a 6.81% increase from $8,452 million in FY2025 and $8,252 million in FY2024. Total Segment EBITDA expanded 14.98% YoY to $1,627 million (up from $1,415 million in FY2025 and $1,241 million in FY2024), yielding a 128 basis point margin expansion to 18.02%.
Deconstructing the $576 million top-line expansion in FY2026 reveals $189 million in foreign exchange tailwinds (+2.24% growth impact), $31 million from publishing acquisitions (+0.37% impact), and $356 million in organic growth (+4.21% impact), driven by price increases across Dow Jones Professional Information Business (PIB) and premium property listings at Move, Inc.
Table Segment Revenue Contribution and EBITDA Performance Analysis (FY2024–FY2026)
| Segment / Business Unit | FY2024 Revenue ($M) | FY2025 Revenue ($M) | FY2026 Revenue ($M) | Revenue Share (%) | FY2024 EBITDA ($M) | FY2025 EBITDA ($M) | FY2026 EBITDA ($M) | FY2026 EBITDA Margin (%) | Primary Core Drivers |
| Dow Jones | $2,231 | $2,331 | $2,497 | 27.65% | $542 | $588 | $663 | 26.55% | Risk & Compliance (+16.32%) and Energy (+8.27%) enterprise growth. |
| Digital Real Estate Services | $1,658 | $1,802 | $2,016 | 22.33% | $508 | $601 | $741 | 36.76% | REA Group (
610M rev; leads +5%). |
| Book Publishing | $2,093 | $2,149 | $2,288 | 25.34% | $269 | $296 | $287 | 12.54% | M&A (+$31M) offset by $16M inventory & $13M receivable write-offs. |
| News Media | $2,270 | $2,170 | $2,227 | 24.67% | $133 | $153 | $139 | 6.24% | UK pricing and sub growth offset by print ad declines (-2%). |
| Other / Corporate | $0 | $0 | $0 | 0.00% | $(211) | $(223) | $(203) | N/A | Corporate overhead, strategy costs, and U.K. Newspaper Matters. |
| Consolidated Total | $8,252 | $8,452 | $9,028 | 100.00% | $1,241 | $1,415 | $1,627 | 18.02% | Gross Segment EBITDA sum: $1,830M before corporate adjustments. |
GAAP Net Income from continuing operations expanded 14.66% YoY to $743 million (up from $648 million in FY2025 and $379 million in FY2024). Total consolidated Net Income reached $743 million, compared to $1,340 million in FY2025 (which included $692 million from discontinued operations tied to the Foxtel Group sale, incorporating a $716 million pre-tax gain) and $354 million in FY2024. Net Income attributable to News Corporation stockholders stood at $573 million ($1,180 million in FY2025; $266 million in FY2024).
The revenue model disaggregation highlights a structural shift away from traditional advertising toward high-margin recurring streams:
* Circulation and Subscription: $3,203 million (35.48% of total; +23 bps portfolio shift since FY2024)
* Consumer (Book Sales): $2,185 million (24.20% of total; -4 bps portfolio shift)
* Real Estate (Listing & Referral Fees): $1,571 million (17.40% of total; +184 bps portfolio shift)
* Advertising: $1,391 million (15.41% of total; -156 bps portfolio shift)
* Other (Licensing & Ancillary): $678 million (7.51% of total; -48 bps portfolio shift)
Within Dow Jones, the Professional Information Business generated $988 million (+9.41% YoY), representing 39.57% of segment revenues. This was led by Risk & Compliance at $392 million (+16.32% YoY), Dow Jones Energy (OPIS/CMA) at $301 million (+8.27% YoY), and Other Information Services (Factiva and Dow Jones Newswires) at $295 million (+2.43% YoY). Consumer Circulation and Other revenues reached $1,032 million (+5.20% YoY), while Dow Jones advertising revenues stood at $418 million (16.74% of segment top-line).
Operating Cash Flow from continuing operations grew 26.48% YoY to $1,237 million ($978 million in FY2025; $897 million in FY2024). Capital Expenditures totaled $426 million (4.72% of revenues), comprising $105 million in Dow Jones, $160 million in Digital Real Estate, $31 million in Book Publishing, $117 million in News Media, and $13 million in Corporate. Free Cash Flow increased 42.03% to $811 million ($571 million in FY2025; $540 million in FY2024), representing a Segment EBITDA-to-FCF conversion rate of 49.85%.
Working capital changes generated a $145 million cash drag in FY2026 (improving from $206 million in FY2025). Net Receivables ended at $1,757 million (Gross $1,807 million minus $50 million allowance), generating a $(237) million cash flow impact. Net Inventories declined to $302 million ($327 million in FY2025), yielding a $33 million cash inflow. Deferred subscription revenue expanded to $543 million (up from $498 million in FY2025), driven by $3,278 million in current-year deferrals against $3,229 million in revenue recognition. Capitalized software amortization rose to $304 million (net software asset carrying value of $703 million; construction in progress of $93 million).
Operational Footprint, Platform Mechanics, and Capital Structure
News Corporation's operational transition is supported by digital subscription networks and property platforms across three major geographical hubs: the United States ($4,200 million revenue / 46.52% share), Australia ($2,400 million revenue / 26.58% share), the United Kingdom ($1,300 million revenue / 14.40% share), and Canada/Other International markets ($1,128 million revenue / 12.50% share).
The digital news subscription footprint reached 6.258 million digital-only subscribers (+9% YoY) out of 6.725 million total subscriptions (+7% YoY) at Dow Jones (print: 467,000). The Wall Street Journal reached 4.465 million digital-only subscribers (+8% YoY; 92.50% mix) out of 4.827 million total (print: 362,000). Barron’s Group achieved 1.512 million digital-only subscribers (+15% YoY; 94.38% mix) out of 1.602 million total (print: 90,000). In Australia, aggregate digital closing subscribers reached 981,000, led by *The Australian* (341,975 paid subscribers), *Herald Sun* (148,753), *The Daily Telegraph* (140,808), *The Courier Mail* (131,947), and *The Advertiser* (106,468). In the U.K., *The Times & Sunday Times* reached 681,000 digital-only subscribers (88.10% mix) out of 773,000 total paid subscribers (print: 92,000 de-duplicated).
Average monthly audience engagement includes:
* WSJ Digital Network: 58 million unique users (195 million monthly visits); WSJ: 35 million unique (130 million visits); MarketWatch: 12 million unique (43 million visits).
* Post Digital Network: 86.5 million unique users.
* The Sun (Global): 65 million unique users.
* Realtor.com (Move): 68 million unique users (297 million monthly visits).
* realestate.com.au (REA Group): 12.7 million unique visitors (146.4 million monthly visits; 3.5x nearest Australian competitor); realcommercial.com.au: 2.9 million visitors.
* Factiva: 852,000 active institutional users accessing 33,000+ sources across 33 languages in 200+ countries.
The corporate balance sheet reflects a Net Cash position of $106 million, backed by $2,095 million in cash and cash equivalents ($1,840 million accessible; $255 million held by REA Group) against $1,989 million in carrying debt ($2,000 million total principal). Undrawn liquidity totals $1,129 million ($1,000 million via the 2026 Revolving Facility; $129.0 million / A$200 million via REA Group's facility), creating a total liquidity buffer of $3,224 million. Gross leverage stands at 1.22x, while Adjusted Accessible Net Debt-to-EBITDA is 0.09x (covenant ceiling: 3.50x). Return on Invested Capital (ROIC) reached 8.09% in FY2026, an expansion of 164 bps driven by NOPAT of $731.62 million (EBIT $1,029 million; effective tax rate 28.9%) on average invested capital of $9,039 million.
Table Debt Obligations, Financing Commitments, and Maturity Profile Analysis
| Debt Instrument / Commitment | Principal / Commitment ($M) | Carrying Value ($M) | Interest Rate / Pricing | Maturity Fiscal Year | Amortization & Repayment Terms |
| 2021 Senior Notes | $1,000 | $995 | 3.875% Fixed | FY2029 | Bullet payment May 15, 2029 ($1,000M principal). |
| 2022 Senior Notes | $500 | $495 | 5.125% Fixed | FY2032 | Bullet payment Feb 15, 2032 ($500M principal). |
| 2026 Term Loan A | $500 | $499 | 4.961% Variable* | FY2031 | Amort: FY28 $16M; FY29 $16M; FY30 $25M; FY31 $443M maturity. |
| Operating Lease Obligations | $1,534 | $926 | 5.45% WACC | 12.8 Yr Avg Term | Undiscounted
1,343M commenced; $191M uncommenced variance). |
| Purchase Obligations | $816 | Off-Balance Sheet | Contractual | Various | <1 yr: $358M; 1-3 yrs: $311M; 3-5 yrs: $70M; >5 yrs: $77M (AWS, Google). |
| Total Debt & Commitments | $4,350 | $2,415 | Mixed | Multi-Year | Total material commitments: $4,732M (incl. $382M expected interest). |
Expected annual interest payments total $382 million (FY27: $82M; FY28: $92M; FY29: $92M; FY30: $45M; FY31: $45M; Thereafter: $26M), bringing total annual debt service to $2,382 million.
Capital allocation outflows in FY2026 totaled $1,569 million:
1. Share Buybacks ($782M): $641 million spent by News Corporation repurchasing 23.7 million shares (16.2M Class A, 7.5M Class B; $667M remains authorized under the 2025 program); $141 million (A$200M) repurchased by REA Group.
2. Capital Expenditures ($426M): Infrastructure and software capitalization.
3. Dividends ($204M): $112 million to News Corporation stockholders ($0.20 per share); $92 million to REA Group minority stockholders.
4. M&A Acquisitions ($122M): Added $131 million to goodwill ($94M Digital Real Estate, $29M Dow Jones).
5. Purchases of Investments ($60M): Strategic equity investments.
6. Net Debt Inflow ($(25)M): Net borrowing drawdowns.
Total consolidated assets ended at $15,544 million. Intangible assets and goodwill total $6,379 million (41.04% of assets), comprising $4,542 million in Goodwill (Dow Jones: $2,268M; Digital Real Estate: $1,712M; Book Publishing: $423M; News Media: $139M) and $1,837 million in Net Intangibles. Indefinite-lived intangibles include Newspaper Mastheads ($281M), Trademarks/Tradenames ($272M), Book Publishing Imprints ($239M), and Radio Licenses ($109M). Amortizable intangibles comprise Customer Relationships ($671M; 3-25 yrs), Publishing Rights ($245M; 3-30 yrs), and Other ($20M).
Impairments totaled $27 million in FY2026 ($9 million indefinite-lived intangible asset impairment; $18 million long-lived asset write-downs), down from $12 million in FY2025 and $44 million in FY2024 (which included $22 million for News UK / DMG Media print plant consolidation). Restructuring charges reached $86 million in FY2026 ($120M in FY2025; $89M in FY2024), 100% allocated to one-time employee termination severance benefits. Cumulative restructuring cash settlements since FY2024 stand at $310 million ($108M paid in FY2026), leaving a balance sheet provision liability of $68 million.
Subsidiary structures specify a 62.0% direct controlling interest in REA Group Limited (38.0% public NCI balance sheet carrying value: $710M; FY2026 NCI net income allocation: $170M). Move, Inc. is owned 80.0% directly by News Corporation and 20.0% by REA Group, yielding a 92.4% effective economic interest and a 7.6% indirect NCI. REA Group signed a binding agreement in July 2026 to sell REA India (Housing.com). Planitar Inc. is owned 61.5% by REA Group.
The dual-class share capital architecture comprises 360,503,747 Class A non-voting shares (NWSA; 66.6% equity share) and 180,548,891 Class B voting shares (NWS; 33.4% equity share) as of July 31, 2026. LGC Holdco, LLC (controlled by Chair Lachlan K. Murdoch) holds 62,325,477 Class B shares, representing 34.52% voting control. Under the New Stockholders Agreement executed September 8, 2025, a strict collective voting cap of 44.00% is established via mandatory vote forfeiture during corporate share repurchases.
Macro sensitivities dictate that a $0.01 movement in the USD/AUD exchange rate impacts annual revenue by ±$37 million and Segment EBITDA by ±$12 million; a $0.01 movement in USD/GBP impacts revenue by ±$11 million and EBITDA by ±$2 million. Defined benefit pension obligations carry an accumulated net pre-tax loss of $429 million; a ±25 bps discount rate change shifts the Projected Benefit Obligation by +$17 million / -$18 million.
Data privacy non-compliance statutory caps expose the firm to maximum fines of €20 million ($22.612 million) or 4% of turnover under EU GDPR, and £17.5 million ($23.086 million) or 4% under UK GDPR / Data (Use and Access) Act 2025. In the US, California CCPA/CPRA enforcement applies automated decision disclosures effective January 2026. Australia's Privacy Act Amendment Bill 2024 mandates a children's privacy code by December 2026.
Active legal proceedings include:
* OPIS PVC Pricing Class Actions: Settled in May 2025 (preliminary approval July 2025). OPIS is complying with a U.S. DOJ grand jury subpoena (issued Jan 2025) and a state AG Civil Investigative Demand (Apr 2025).
* HarperCollins Amazon Antitrust Case: SDNY class actions dismissed with prejudice; appeal rights reserved by plaintiffs.
* U.K. Newspaper Matters: Accrued civil phone-hacking liability of $8 million, fully indemnified by FOX Corporation (indemnification receivable: $17 million under current assets). Net FY2026 SG&A cash expense was $1 million ($9M in FY2025; $8M in FY2024).
* Anthropic PBC IP Class Action: Settlement received final court approval in July 2026 (HarperCollins eligible class member; zero proceeds recognized in FY2026).
* Unrecognized Tax Benefits (ASC 740): Reduced to $73 million ($13 million affects effective tax rate). Accrued tax interest/penalties stand at $4 million. Net cash tax paid in FY2026 was $272 million ($185M Australia, $54M UK, $15M US States, $1M US Federal, $17M Other). Open tax audit years span US Federal (FY23-FY25), Australia (FY21-FY25), and the U.K. (2000, 2003, 2005, 2012-2025).
HDIN Institutional Verdict
News Corporation’s structural transition from legacy print advertising (now down to 15.41% of total revenues) toward enterprise B2B data subscriptions and high-margin digital real estate platforms has stabilized its financial foundation. The Professional Information Business within Dow Jones (growing 9.41% to $988 million) and REA Group’s 36.76% EBITDA margins provide structural insulation against print media advertising headwinds (-2%) and cyclical housing pressures in the United States.
However, operational drags persist within Book Publishing—where $29 million in one-time inventory write-offs and customer receivable defaults compressed margins to 12.54%—and Move/Realtor.com, which remains exposed to elevated U.S. mortgage rates and shifting MLS listing dynamics following National Association of Realtors class-action settlements.
The company's balance sheet discipline is demonstrated by its $106 million net cash surplus, $3,224 million liquidity buffer, and $782 million capital return execution. The 44.00% Murdoch voting cap provides governance clarity during buyback executions. Long-term value creation depends on expanding enterprise Risk & Compliance data integrations and successfully monetizing publisher IP through structured technology licensing agreements, as demonstrated by the Anthropic class-action settlement framework.
Presentation Download & Video Access:
Presentation Download: Click the PDF download link under 'Related Topics' to access the full institutional presentation of this report.
Video Link: Click this link to watch the HDIN analyst briefing on YouTube.
About HDIN Research:
HDIN Research is a premier global market intelligence and strategic advisory firm specializing in institutional-grade financial analysis, supply chain audits, and macroeconomic forecasting. Our dedicated sector analysts deliver actionable, data-driven insights tailored for private equity, hedge funds, and corporate strategy teams. Visit us at http://www.hdinresearch.com.
2026 AI Transparency Footer:
"This intelligence report was authored by HDIN Research analysts following a rigorous audit of official corporate filings. AI was utilized for massive-scale data synthesis and structural drafting, ensuring 100% inclusion of reported data points. All strategic insights, financial modeling, and final verdicts were verified by our editorial board to ensure professional accuracy and compliance with 2026 Google Search E-E-A-T standards."