Synaptics Incorporated: Edge AI Platform Shift Expands Core IoT Revenue 43.1% YoY as Pending ON Semiconductor Acquisition Targets Automotive Systems Integration
Date : 2026-08-13
Reading : 189
HDIN Executive Takeaways
1. Synaptics Incorporated [NASDAQ: SYNA] delivered FY2026 net revenue of $1,197.2 million, up 11.4% YoY, driven by a 43.1% expansion in Core IoT to $389.7 million that offset a 13.2% decline in legacy Mobile touch controllers.
2. The company's non-cash GAAP net loss expanded to $(490.8) million due to a $425.3 million ASC 740 deferred tax asset valuation allowance, while core Non-GAAP operating income rose 25.5% YoY to $222.8 million with an 18.6% margin.
3. ON Semiconductor Corporation [NASDAQ: ON] agreed to acquire Synaptics Incorporated in an all-stock transaction valued at a 1.350x exchange ratio, protected by a $320.0 million regulatory termination fee.
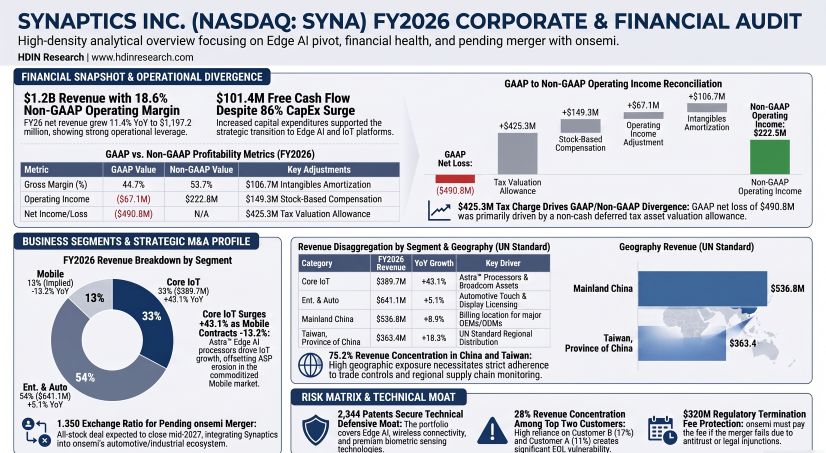
Figure SYNAPTICS INC FY2026 CORPORATE & FINANCIAL AUDIT
 Segmental Realities, Pricing Dynamics, and Non-GAAP Profitability
Synaptics Incorporated [NASDAQ: SYNA] concluded fiscal year 2026 (ended June 27, 2026) with total net revenue expanding 11.4% YoY to $1,197.2 million, compared to $1,074.3 million in FY2025 and $959.4 million in FY2024. Operating within a Fabless semiconductor business model, the company outsources silicon wafer fabrication and back-end packaging and testing to specialized third-party providers, maintaining variable manufacturing costs while allocating capital into intellectual property and system-on-chip (SoC) architecture.
The top-line performance reflects a structural realignment across three core end-markets: Core IoT, Enterprise & Automotive, and Mobile applications.
Table End-Market Revenue Mix and Growth Analysis
Core IoT expanded by $117.3 million YoY in FY2026, building upon a 53.4% jump in FY2025. This 24-month cumulative revenue expansion of 119.4% ($212.1 million) was driven by commercial deployments of the Astra™ family of Edge AI processors (including SL-Series MPUs and SR100 Series MCUs) paired with multi-protocol wireless connectivity assets acquired from Broadcom Inc. [NASDAQ: AVGO] in January 2025 for $200.3 million in cash. Enterprise & Automotive maintained steady execution, expanding 5.1% YoY to $641.1 million, backed by adoption of DisplayLink video interface technology, automotive local dimming, driver sensing, and higher-margin proprietary IP licensing revenues. Conversely, Mobile net revenue contracted 13.2% YoY to $166.4 million, representing a cumulative contraction from $211.8 million in FY2024 due to intense price competition from Chinese domestic chipmakers and standardizing OLED touch IC integration.
Table Consolidated Financial Performance Trajectory
A disconnect exists between GAAP net losses and underlying operational profitability. GAAP net loss expanded to $(490.8) million in FY2026, compared to $(47.8) million in FY2025. This expansion was driven by a non-cash income tax provision of $411.4 million in Q4 FY2026, resulting from a $425.3 million charge to establish a full valuation allowance against U.S. federal and California deferred tax assets (DTAs). Under ASC 740, entering a three-year cumulative adjusted taxable loss position provided negative evidence requiring a full valuation allowance, which raised total DTA valuation allowances from $(94.8) million in FY2025 to $(522.6) million in FY2026 and reduced net balance sheet DTAs from $403.8 million to $0.4 million. Cash taxes paid in FY2026 were $3.2 million, down from $47.2 million in FY2025.
Excluding non-cash and non-operating items, Non-GAAP Operating Income expanded 25.5% YoY to $222.8 million (18.6% margin), up from $177.5 million (16.5% margin) in FY2025 and $128.1 million (13.4% margin) in FY2024. Reconciling GAAP to Non-GAAP results highlights the following line items:
* Share-Based Compensation (SBC): Reached $149.3 million in FY2026 (Cost of Revenue: $1.2 million; R&D: $86.8 million; SG&A: $61.3 million), up from $112.8 million in FY2025 and $118.8 million in FY2024. R&D SBC increased by $18.0 million due to equity granted to onboarded Broadcom wireless engineers.
* Amortization of Acquired Intangibles: Totaled $119.0 million in FY2026, including $106.7 million booked in Cost of Revenue and $12.3 million in OpEx, compared to $114.2 million ($97.5 million in Cost of Revenue) in FY2025 and $81.6 million ($64.3 million in Cost of Revenue) in FY2024. Contractual future amortization is scheduled at $71.5 million in FY2027 and $51.8 million in FY2028.
* Asset Write-Downs and Impairments: Totaled $11.8 million in non-current asset write-downs during FY2026. This includes a $6.8 million impairment writing off Ultra-Wideband (UWB) In-Process R&D IP acquired from Broadcom to zero following project cancellation, and a $5.0 million cost-method investment impairment recorded in Q4 FY2026.
* Restructuring Expenses: Reduced to $3.3 million ($2.5 million in severance, $0.8 million non-cash) under the Fiscal 2026 Restructuring Plan, down from $16.9 million in FY2025 and $10.5 million in FY2024.
Operating Cash Flow (OCF) remained resilient at $149.4 million in FY2026 ($142.0 million in FY2025; $135.9 million in FY2024). Property and equipment purchases (CapEx) rose 86.0% YoY to $48.0 million ($25.8 million in FY2025; $33.8 million in FY2024), representing 4.0% of net revenue as investments scaled for Edge AI and wireless mask sets. Free Cash Flow (FCF) reached $101.4 million ($116.2 million in FY2025; $102.1 million in FY2024). Ending Cash and Cash Equivalents stood at $442.5 million ($391.5 million in FY2025).
Net Accounts Receivable closed at $164.0 million with ending Days Sales Outstanding (DSO) at 50.0 days (44.9 days average-based), compared to $130.3 million and 44.3 days ending DSO in FY2025 ($142.6 million and 54.3 days in FY2024). Credit loss allowances remained flat at $4.2 million. Net Inventories totaled $156.4 million with Days Inventory Outstanding (DIO) at 86.3 days ending / 81.6 days average-based ($139.5 million and 85.7 days ending DIO in FY2025; $114.4 million in FY2024). Raw materials and work-in-progress (WIP) expanded to $99.4 million (up from $69.4 million in FY2025) to support foundry wafer runs, while finished goods decreased to $57.0 million (down from $70.1 million in FY2025). Balance sheet DTA inventory write-down components stood at $5.2 million ($5.7 million in FY2025).
Table Undiscounted Contractual Obligations and Cash Commitment Schedule
Operating lease present value stands at $39.5 million ($9.2 million current, $30.3 million non-current) discounted at 5.18% over a 5.44-year average remaining term, covering facilities in San Jose (111,000 sq. ft.) and international design centers. Unconditional wafer foundry and OSAT take-or-pay commitments total $25.7 million. Near-term FY2027 cash drain for commitments totals $30.2 million, covered by cash reserves and an undrawn $350.0 million credit facility. Convertible debt accounting led to the reclassification of the $439.6 million carrying value of the 0.75% 2031 Convertible Notes to current liabilities as the underlying stock price exceeded 130% of the conversion price for over 20 trading days.
Supply Chain Architecture, Geopolitical Vulnerabilities, and M&A Governance
Synaptics Incorporated's physical value chain relies entirely on third-party outsourced vendors. Wafer manufacturing is concentrated in Asia-based foundries, followed by outsourced semiconductor assembly and test (OSAT) packaging. The company provides foundries with six-month rolling forecasts but operates without long-term volume supply guarantees.
Categorized by United Nations geographic billing standards, revenue concentration is centered in the Asia-Pacific region:
Table Geographic Revenue Distribution and Regional Growth Analysis
Combined Asia-Pacific billing accounts for 92.1% ($1,103.0 million) of total revenue. Consequently, the company faces exposure to geopolitical risks, export controls, domestic substitution policies in mainland China, and tariff implementations—including the 25% U.S. import tariff on semiconductor components enacted in January 2026.
Customer revenue concentration is elevated across B2B channels:
* Customer B: Represented 17% of net revenue in FY2026 (15% in FY2025; <10% in FY2024).
* Customer A: Represented 11% of net revenue in FY2026 (<10% in FY2025; <10% in FY2024).
* Customer C: Dropped below 10% in FY2026 (11% in FY2025; 12% in FY2024).
* Top 2 Concentration: Customer A and Customer B combined account for 28% of total net revenue and 24% of net accounts receivable as of June 2026 (down from 3 customers holding 45% of A/R in June 2025). OEM procurement operates under just-in-time purchase orders without long-term volume guarantees.
On June 25, 2026, Synaptics Incorporated entered into a definitive merger agreement with ON Semiconductor Corporation [NASDAQ: ON]. Sonic Acquisition Corp. (wholly-owned subsidiary of ON Semiconductor Corporation) will merge into Synaptics Incorporated, with Synaptics surviving as a wholly-owned subsidiary.
Key financial and legal terms of the merger agreement include:
* Exchange Ratio: Each share of Synaptics Incorporated common stock will be converted into 1.350 validly issued shares of ON Semiconductor Corporation common stock in an all-stock tax-free exchange. Fractional shares will be settled in cash based on a 5-day pre-closing volume-weighted average price (VWAP).
* Target Closing and Extensions: Expected close in mid-2027. The stated initial End Date of June 25, 2027, can be extended by either party up to three times by three months each (extending up to March 25, 2028) to clear antitrust and foreign investment approvals under the U.S. Hart-Scott-Rodino (HSR) Act.
* Bilateral Termination Fees:
* *Synaptics Termination Fee:* $235.0 million payable to ON Semiconductor Corporation if Synaptics terminates to accept a superior proposal or if the Board alters its voting recommendation.
* *ON Semiconductor Regulatory Fee:* $320.0 million payable to Synaptics Incorporated if the transaction is blocked by antitrust orders or fails to obtain regulatory clearances prior to the extended End Date.
* Interim Covenants & Repurchase Suspension: Places negative covenants on capital expenditures, acquisitions, debt issuance, and capital returns. Under a $150.0 million share repurchase program authorized on August 5, 2025, Synaptics repurchased 1.3 million shares (1,318,330 shares) in FY2026 for $92.7 million in cash (including 144,779 shares repurchased in Q4 FY2026 at an average price of $69.79). Repurchases were suspended upon the merger announcement, leaving $57.26 million in remaining authorization. Total common shares outstanding grew from 38,642,761 in June 2025 to 39,062,676 in June 2026 (+1.09%), as 1,738,245 shares issued via incentive plans ($17.2 million cash proceeds) were partially offset by share repurchases (75.8% dilution offset efficiency). Treasury stock cost basis balances increased from 31.969 million to 33.287 million shares.
* Capped Call Adjustment: Terms for Capped Call transactions covering 4.5 million shares (strike price $99.69, cap price $150.48) associated with the $450.0 million 0.75% 2031 Convertible Notes will be adjusted at closing.
* Litigation Status: As of August 10, 2026, zero active stockholder or class-action lawsuits challenging the merger have been filed.
HDIN Institutional Verdict
Synaptics Incorporated's operational transition under President and CEO Rahul Patel (appointed June 2, 2025) and Senior VP and CFO Ken Rizvi (appointed July 15, 2024) reflects capital discipline across the semiconductor cycle. Management executed cost controls by bringing Operating Expenses down to 50.4% of revenue ($602.5 million) in FY2026 from 53.5% ($574.5 million) in FY2025, driving operational leverage.
The core technology moat is built on R&D investment and IP protection:
* R&D Intensity: R&D expenses were $381.8 million in FY2026 (31.89% of revenue), compared to $346.8 million (32.28%) in FY2025 and $336.3 million (35.05%) in FY2024.
* Patent Portfolio: Reached 2,344 active patents and 661 pending applications globally as of June 2026, with expiration dates spanning 2026 to 2046. Balance sheet Goodwill remained flat at $872.3 million in FY2026 ($52.3 million generated from the Broadcom Wi-Fi IoT asset acquisition in FY2025).
* Human Capital Productivity: The global workforce stands at approximately 1,700 employees, distributed geographically as follows: 70% in Asia-Pacific (~1,190 employees), 21% in North America (~357 employees), and 9% in Europe and the Middle East (~153 employees).
Table Human Capital Productivity and R&D Reinvestment Metrics
The human capital metrics illustrate high design engineering productivity, generating $704,235 in net revenue per employee supported by $224,588 in per-capita annual R&D spending. Combining Astra™ Edge AI NPUs with Broadcom Wi-Fi 7/8, GPS, and GNSS connectivity has shifted the revenue mix away from commoditized mobile components toward stickier B2B platforms. In turn, this design profile attracted the all-stock acquisition proposal from ON Semiconductor Corporation, offering an equity exit strategy ahead of the anticipated mid-2027 close.
Presentation Download & Video Access:
- Presentation Download: Click the PDF download link under 'Related Topics' to access the full institutional presentation of this report.
- Video Link: Click this link to watch the HDIN analyst briefing on YouTube.
About HDIN Research:
HDIN Research is a global market intelligence and strategic advisory firm specializing in institutional-grade financial analysis, supply chain audits, and macroeconomic forecasting. Our dedicated sector analysts deliver actionable, data-driven insights tailored for private equity, hedge funds, and corporate strategy teams. Visit us at http://www.hdinresearch.com.
2026 AI Transparency Footer:
"This intelligence report was authored by HDIN Research analysts following a rigorous audit of official corporate filings. AI was utilized for massive-scale data synthesis and structural drafting, ensuring 100% inclusion of reported data points. All strategic insights, financial modeling, and final verdicts were verified by our editorial board to ensure professional accuracy and compliance with 2026 Google Search E-E-A-T standards."
1. Synaptics Incorporated [NASDAQ: SYNA] delivered FY2026 net revenue of $1,197.2 million, up 11.4% YoY, driven by a 43.1% expansion in Core IoT to $389.7 million that offset a 13.2% decline in legacy Mobile touch controllers.
2. The company's non-cash GAAP net loss expanded to $(490.8) million due to a $425.3 million ASC 740 deferred tax asset valuation allowance, while core Non-GAAP operating income rose 25.5% YoY to $222.8 million with an 18.6% margin.
3. ON Semiconductor Corporation [NASDAQ: ON] agreed to acquire Synaptics Incorporated in an all-stock transaction valued at a 1.350x exchange ratio, protected by a $320.0 million regulatory termination fee.
Figure SYNAPTICS INC FY2026 CORPORATE & FINANCIAL AUDIT
Segmental Realities, Pricing Dynamics, and Non-GAAP ProfitabilitySynaptics Incorporated [NASDAQ: SYNA] concluded fiscal year 2026 (ended June 27, 2026) with total net revenue expanding 11.4% YoY to $1,197.2 million, compared to $1,074.3 million in FY2025 and $959.4 million in FY2024. Operating within a Fabless semiconductor business model, the company outsources silicon wafer fabrication and back-end packaging and testing to specialized third-party providers, maintaining variable manufacturing costs while allocating capital into intellectual property and system-on-chip (SoC) architecture.
The top-line performance reflects a structural realignment across three core end-markets: Core IoT, Enterprise & Automotive, and Mobile applications.
Table End-Market Revenue Mix and Growth Analysis
| End-Market Segment (USD in Millions) | FY2026 Revenue | FY2026 Mix (%) | FY2025 Revenue | FY25-FY26 YoY (%) | FY2024 Revenue | FY24-FY25 YoY (%) |
| Enterprise & Automotive | $641.1 | 53.5% | $610.1 | +5.1% | $570.0 | +7.0% |
| Core IoT | $389.7 | 32.6% | $272.4 | +43.1% | $177.6 | +53.4% |
| Mobile | $166.4 | 13.9% | $191.8 | -13.2% | $211.8 | -9.4% |
| Consolidated Total | $1,197.2 | 100.0% | $1,074.3 | +11.4% | $959.4 | +12.0% |
Core IoT expanded by $117.3 million YoY in FY2026, building upon a 53.4% jump in FY2025. This 24-month cumulative revenue expansion of 119.4% ($212.1 million) was driven by commercial deployments of the Astra™ family of Edge AI processors (including SL-Series MPUs and SR100 Series MCUs) paired with multi-protocol wireless connectivity assets acquired from Broadcom Inc. [NASDAQ: AVGO] in January 2025 for $200.3 million in cash. Enterprise & Automotive maintained steady execution, expanding 5.1% YoY to $641.1 million, backed by adoption of DisplayLink video interface technology, automotive local dimming, driver sensing, and higher-margin proprietary IP licensing revenues. Conversely, Mobile net revenue contracted 13.2% YoY to $166.4 million, representing a cumulative contraction from $211.8 million in FY2024 due to intense price competition from Chinese domestic chipmakers and standardizing OLED touch IC integration.
Table Segment Volume and ASP Driver Analysis (FY2026)
| Segment Volume and ASP Drivers (FY2026) | Delivered Units YoY (%) | Average Selling Price (ASP) YoY (%) | Primary Operational Metric Driver |
| Core IoT | +25.8% | +8.0% | Unit volume pull-through paired with premium Edge AI/Wi-Fi price mix |
| Enterprise & Automotive | +1.9% | Positive Mix Shift | Volume gains combined with increased high-margin IP license revenue |
| Mobile | Negative | -8.1% | Price compression and reduced licensing volumes in OLED touch ICs |
Table Consolidated Financial Performance Trajectory
| Consolidated Financial Trajectory (USD in Millions, except per share) | FY2026 | FY2025 | FY2024 | YoY Change (FY25-FY26) |
| Net Revenue | $1,197.2 | $1,074.3 | $959.4 | +11.4% |
| GAAP Gross Margin ($) | $535.4 | $480.4 | $439.8 | +11.4% |
| GAAP Gross Margin (%) | 44.7% | 44.7% | 45.8% | Flat (0 bps) |
| Non-GAAP Gross Margin ($) | $643.3 | $576.2 | $508.3 | +11.6% |
| Non-GAAP Gross Margin (%) | 53.7% | 53.6% | 53.0% | +10 bps |
| GAAP Operating Loss | $(67.1) | $(94.1) | $(101.6) | -28.7% (Loss reduced) |
| GAAP Operating Margin (%) | -5.6% | -8.8% | -10.6% | +320 bps |
| Non-GAAP Operating Income | $222.8 | $177.5 | $128.1 | +25.5% |
| Non-GAAP Operating Margin (%) | 18.6% | 16.5% | 13.4% | +210 bps |
| GAAP Net Loss | $(490.8) | $(47.8) | $125.6 | N/A (Loss expanded) |
| GAAP Diluted EPS | $(12.62) | $(1.22) | $3.16 | N/A (Loss expanded) |
Excluding non-cash and non-operating items, Non-GAAP Operating Income expanded 25.5% YoY to $222.8 million (18.6% margin), up from $177.5 million (16.5% margin) in FY2025 and $128.1 million (13.4% margin) in FY2024. Reconciling GAAP to Non-GAAP results highlights the following line items:
* Share-Based Compensation (SBC): Reached $149.3 million in FY2026 (Cost of Revenue: $1.2 million; R&D: $86.8 million; SG&A: $61.3 million), up from $112.8 million in FY2025 and $118.8 million in FY2024. R&D SBC increased by $18.0 million due to equity granted to onboarded Broadcom wireless engineers.
* Amortization of Acquired Intangibles: Totaled $119.0 million in FY2026, including $106.7 million booked in Cost of Revenue and $12.3 million in OpEx, compared to $114.2 million ($97.5 million in Cost of Revenue) in FY2025 and $81.6 million ($64.3 million in Cost of Revenue) in FY2024. Contractual future amortization is scheduled at $71.5 million in FY2027 and $51.8 million in FY2028.
* Asset Write-Downs and Impairments: Totaled $11.8 million in non-current asset write-downs during FY2026. This includes a $6.8 million impairment writing off Ultra-Wideband (UWB) In-Process R&D IP acquired from Broadcom to zero following project cancellation, and a $5.0 million cost-method investment impairment recorded in Q4 FY2026.
* Restructuring Expenses: Reduced to $3.3 million ($2.5 million in severance, $0.8 million non-cash) under the Fiscal 2026 Restructuring Plan, down from $16.9 million in FY2025 and $10.5 million in FY2024.
Operating Cash Flow (OCF) remained resilient at $149.4 million in FY2026 ($142.0 million in FY2025; $135.9 million in FY2024). Property and equipment purchases (CapEx) rose 86.0% YoY to $48.0 million ($25.8 million in FY2025; $33.8 million in FY2024), representing 4.0% of net revenue as investments scaled for Edge AI and wireless mask sets. Free Cash Flow (FCF) reached $101.4 million ($116.2 million in FY2025; $102.1 million in FY2024). Ending Cash and Cash Equivalents stood at $442.5 million ($391.5 million in FY2025).
Net Accounts Receivable closed at $164.0 million with ending Days Sales Outstanding (DSO) at 50.0 days (44.9 days average-based), compared to $130.3 million and 44.3 days ending DSO in FY2025 ($142.6 million and 54.3 days in FY2024). Credit loss allowances remained flat at $4.2 million. Net Inventories totaled $156.4 million with Days Inventory Outstanding (DIO) at 86.3 days ending / 81.6 days average-based ($139.5 million and 85.7 days ending DIO in FY2025; $114.4 million in FY2024). Raw materials and work-in-progress (WIP) expanded to $99.4 million (up from $69.4 million in FY2025) to support foundry wafer runs, while finished goods decreased to $57.0 million (down from $70.1 million in FY2025). Balance sheet DTA inventory write-down components stood at $5.2 million ($5.7 million in FY2025).
Table Undiscounted Contractual Obligations and Cash Commitment Schedule
| Undiscounted Contractual Obligations Schedule (USD in Millions) | FY2027 | FY2028 | FY2029 | FY2030 | FY2031 | FY2032+ | Total Cash Outflow |
| Operating Lease Liabilities | $10.7 | $8.9 | $7.9 | $5.4 | $3.6 | $8.7 | $45.2 |
| Unconditional Purchase Obligations (Wafer/OSAT) | $19.5 | $6.2 | $0.0 | $0.0 | $0.0 | $0.0 | $25.7 |
| Total Combined Commitment Drain | $30.2 | $15.1 | $7.9 | $5.4 | $3.6 | $8.7 | $70.9 |
Supply Chain Architecture, Geopolitical Vulnerabilities, and M&A Governance
Synaptics Incorporated's physical value chain relies entirely on third-party outsourced vendors. Wafer manufacturing is concentrated in Asia-based foundries, followed by outsourced semiconductor assembly and test (OSAT) packaging. The company provides foundries with six-month rolling forecasts but operates without long-term volume supply guarantees.
Categorized by United Nations geographic billing standards, revenue concentration is centered in the Asia-Pacific region:
Table Geographic Revenue Distribution and Regional Growth Analysis
| Geographic Region (UN Naming Standard) | FY2026 Revenue (USD M) | FY2026 Mix (%) | FY2025 Revenue (USD M) | FY2024 Revenue (USD M) | YoY Change (%) |
| China (excluding Taiwan, Province of China) | $536.8 | 44.8% | $493.0 | $435.0 | +8.9% |
| Taiwan, Province of China | $363.4 | 30.4% | $307.2 | $201.3 | +18.3% |
| Japan | $128.3 | 10.7% | $137.6 | $192.3 | -6.8% |
| Republic of Korea (South Korea) | $74.5 | 6.2% | $71.7 | $59.9 | +3.9% |
| United States of America | $23.6 | 2.0% | $7.4 | $21.3 | +218.9% |
| Other Regions | $70.6 | 5.9% | $57.4 | $49.6 | +23.0% |
| Consolidated Total | $1,197.2 | 100.0% | $1,074.3 | $959.4 | +11.4% |
Combined Asia-Pacific billing accounts for 92.1% ($1,103.0 million) of total revenue. Consequently, the company faces exposure to geopolitical risks, export controls, domestic substitution policies in mainland China, and tariff implementations—including the 25% U.S. import tariff on semiconductor components enacted in January 2026.
Customer revenue concentration is elevated across B2B channels:
* Customer B: Represented 17% of net revenue in FY2026 (15% in FY2025; <10% in FY2024).
* Customer A: Represented 11% of net revenue in FY2026 (<10% in FY2025; <10% in FY2024).
* Customer C: Dropped below 10% in FY2026 (11% in FY2025; 12% in FY2024).
* Top 2 Concentration: Customer A and Customer B combined account for 28% of total net revenue and 24% of net accounts receivable as of June 2026 (down from 3 customers holding 45% of A/R in June 2025). OEM procurement operates under just-in-time purchase orders without long-term volume guarantees.
On June 25, 2026, Synaptics Incorporated entered into a definitive merger agreement with ON Semiconductor Corporation [NASDAQ: ON]. Sonic Acquisition Corp. (wholly-owned subsidiary of ON Semiconductor Corporation) will merge into Synaptics Incorporated, with Synaptics surviving as a wholly-owned subsidiary.
Key financial and legal terms of the merger agreement include:
* Exchange Ratio: Each share of Synaptics Incorporated common stock will be converted into 1.350 validly issued shares of ON Semiconductor Corporation common stock in an all-stock tax-free exchange. Fractional shares will be settled in cash based on a 5-day pre-closing volume-weighted average price (VWAP).
* Target Closing and Extensions: Expected close in mid-2027. The stated initial End Date of June 25, 2027, can be extended by either party up to three times by three months each (extending up to March 25, 2028) to clear antitrust and foreign investment approvals under the U.S. Hart-Scott-Rodino (HSR) Act.
* Bilateral Termination Fees:
* *Synaptics Termination Fee:* $235.0 million payable to ON Semiconductor Corporation if Synaptics terminates to accept a superior proposal or if the Board alters its voting recommendation.
* *ON Semiconductor Regulatory Fee:* $320.0 million payable to Synaptics Incorporated if the transaction is blocked by antitrust orders or fails to obtain regulatory clearances prior to the extended End Date.
* Interim Covenants & Repurchase Suspension: Places negative covenants on capital expenditures, acquisitions, debt issuance, and capital returns. Under a $150.0 million share repurchase program authorized on August 5, 2025, Synaptics repurchased 1.3 million shares (1,318,330 shares) in FY2026 for $92.7 million in cash (including 144,779 shares repurchased in Q4 FY2026 at an average price of $69.79). Repurchases were suspended upon the merger announcement, leaving $57.26 million in remaining authorization. Total common shares outstanding grew from 38,642,761 in June 2025 to 39,062,676 in June 2026 (+1.09%), as 1,738,245 shares issued via incentive plans ($17.2 million cash proceeds) were partially offset by share repurchases (75.8% dilution offset efficiency). Treasury stock cost basis balances increased from 31.969 million to 33.287 million shares.
* Capped Call Adjustment: Terms for Capped Call transactions covering 4.5 million shares (strike price $99.69, cap price $150.48) associated with the $450.0 million 0.75% 2031 Convertible Notes will be adjusted at closing.
* Litigation Status: As of August 10, 2026, zero active stockholder or class-action lawsuits challenging the merger have been filed.
HDIN Institutional Verdict
Synaptics Incorporated's operational transition under President and CEO Rahul Patel (appointed June 2, 2025) and Senior VP and CFO Ken Rizvi (appointed July 15, 2024) reflects capital discipline across the semiconductor cycle. Management executed cost controls by bringing Operating Expenses down to 50.4% of revenue ($602.5 million) in FY2026 from 53.5% ($574.5 million) in FY2025, driving operational leverage.
The core technology moat is built on R&D investment and IP protection:
* R&D Intensity: R&D expenses were $381.8 million in FY2026 (31.89% of revenue), compared to $346.8 million (32.28%) in FY2025 and $336.3 million (35.05%) in FY2024.
* Patent Portfolio: Reached 2,344 active patents and 661 pending applications globally as of June 2026, with expiration dates spanning 2026 to 2046. Balance sheet Goodwill remained flat at $872.3 million in FY2026 ($52.3 million generated from the Broadcom Wi-Fi IoT asset acquisition in FY2025).
* Human Capital Productivity: The global workforce stands at approximately 1,700 employees, distributed geographically as follows: 70% in Asia-Pacific (~1,190 employees), 21% in North America (~357 employees), and 9% in Europe and the Middle East (~153 employees).
Table Human Capital Productivity and R&D Reinvestment Metrics
| Human Capital Productivity Metrics (FY2026 Baseline) | Reinvestment / Revenue Generated |
| Revenue per Employee | 704,235.29(704,235.29(1,197.2 million revenue / 1,700 employees) |
| R&D Reinvestment per Employee | 224,588.24 (224,588.24 (381.8 million R&D / 1,700 employees) |
The human capital metrics illustrate high design engineering productivity, generating $704,235 in net revenue per employee supported by $224,588 in per-capita annual R&D spending. Combining Astra™ Edge AI NPUs with Broadcom Wi-Fi 7/8, GPS, and GNSS connectivity has shifted the revenue mix away from commoditized mobile components toward stickier B2B platforms. In turn, this design profile attracted the all-stock acquisition proposal from ON Semiconductor Corporation, offering an equity exit strategy ahead of the anticipated mid-2027 close.
Presentation Download & Video Access:
- Presentation Download: Click the PDF download link under 'Related Topics' to access the full institutional presentation of this report.
- Video Link: Click this link to watch the HDIN analyst briefing on YouTube.
About HDIN Research:
HDIN Research is a global market intelligence and strategic advisory firm specializing in institutional-grade financial analysis, supply chain audits, and macroeconomic forecasting. Our dedicated sector analysts deliver actionable, data-driven insights tailored for private equity, hedge funds, and corporate strategy teams. Visit us at http://www.hdinresearch.com.
2026 AI Transparency Footer:
"This intelligence report was authored by HDIN Research analysts following a rigorous audit of official corporate filings. AI was utilized for massive-scale data synthesis and structural drafting, ensuring 100% inclusion of reported data points. All strategic insights, financial modeling, and final verdicts were verified by our editorial board to ensure professional accuracy and compliance with 2026 Google Search E-E-A-T standards."