RelyEZ Energy Storage Technology Co., Ltd.: Global ESS Market Expansion and Software-Hardware Integration Strategy Near Wuzhen Facility Signal Margin Recovery Amid International Regulatory Constraints
Date : 2026-08-13
Reading : 154
HDIN Executive Takeaways
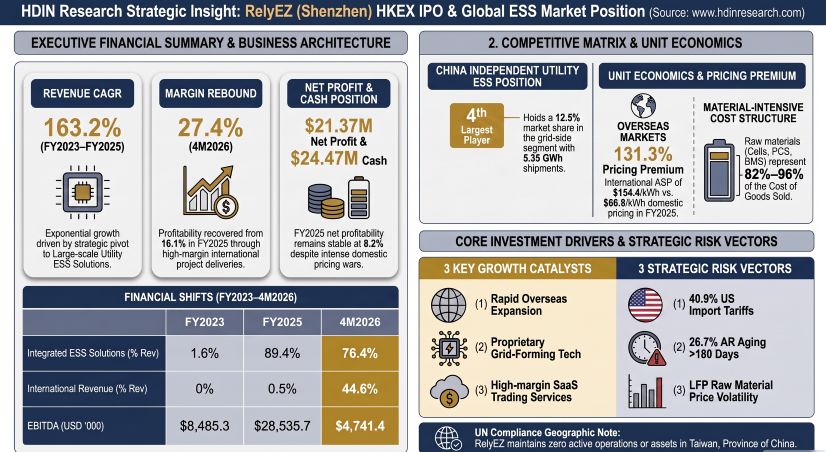
1. RelyEZ Energy Storage Technology Co., Ltd. achieved a 163.2% revenue CAGR from FY2023 to FY2025, reaching $259.84 million (RMB 1,867.61 million) as Large-scale ESS solutions scaled to 89.4% of total sales, despite domestic pricing wars driving gross margins down from 21.6% to 16.1%.
2. Consolidated gross margin recovered to 27.4% in 4M2026, propelled by European deliveries (44.6% of top-line revenue) at average selling prices of $154.43/kWh, successfully offsetting domestic margin erosion and a 40.9% US import tariff burden.
3. Liquidity pressure intensified in 4M2026 as total borrowings surged 306.8% to $78.72 million (RMB 565.78 million) to fund inventory stockpiling and capacity consolidation into a planned 10 GWh automated manufacturing plant in Wuzhen, Zhejiang.
Figure RelyEZ (Shenzhen) HKEX IPO & Global ESS Market Position
 Segmental Realities, Margin Dynamics, and DuPont Financial Performance
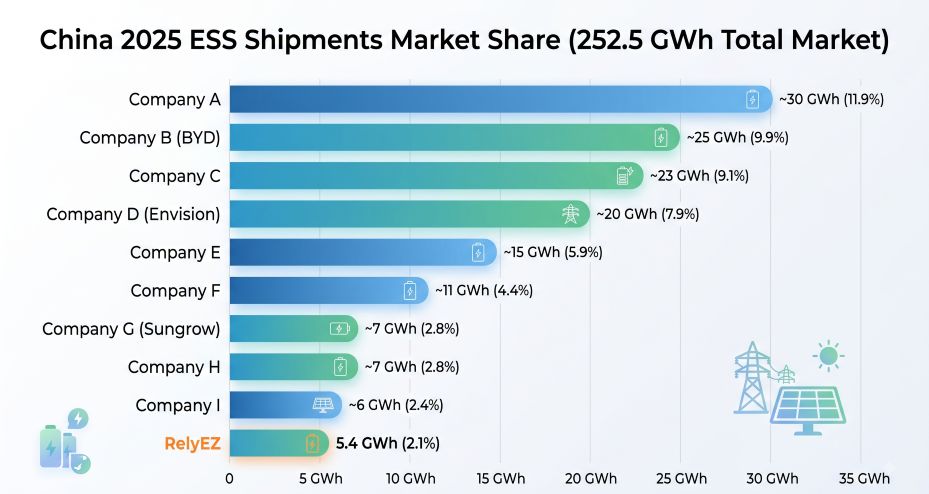
RelyEZ Energy Storage Technology Co., Ltd. [HKEX Pending] has completed a structural pivot from a component distributor into a turnkey system integrator within the electrochemical energy storage system (ESS) sector. According to Frost & Sullivan, the company ranked 10th in China's overall ESS market in FY2025 with 5.4 GWh in shipments (2.1% market share) out of a total domestic market of 252.5 GWh. In the Independent Grid-Side ESS segment, RelyEZ captured a 4th-place ranking in China with 3.4 GWh of newly installed capacity, representing a 12.5% market share of the 27.0 GWh total installed capacity.
Figure China 2025 ESS Shipments Market Share (252.5 GWh Total Market)
The financial performance reflects a rapid top-line expansion offset by severe domestic margin compression caused by upstream lithium-ion cell price pass-throughs. Upstream LFP cell prices declined from 0.85 RMB/Wh ($118.26/kWh) in 2022 to 0.36 RMB/Wh ($50.09/kWh) in 2024, hitting a low of 0.33 RMB/Wh ($45.91/kWh) in FY2025 before rebounding to 0.45 RMB/Wh ($62.61/kWh) in May 2026. Consequently, RelyEZ’s Large-scale ESS Average Selling Price (ASP) compressed 57.1% from 1.12 RMB/Wh ($155.83/kWh) in FY2023 to 0.48 RMB/Wh ($66.78/kWh) in FY2025.
Table Consolidated Financial Performance & Cash Flow Analysis
*Note: All currency conversions executed at 1 USD = 7.1875 CNY.
Segment revenue mix evolved through a intentional exit from commercial and industrial (C&I) hardware sales in China to prevent hyper-competitive margin erosion, shifting focus toward utility-scale deployments and high-margin recurring services.
Table Segment Revenue Evolution Analysis
Average Selling Prices across segments show structural volatility:
* Large-scale ESS: FY2023: $155.83/kWh (1.12 RMB/Wh); FY2024: $107.13/kWh (0.77 RMB/Wh); FY2025: $66.78/kWh (0.48 RMB/Wh); 4M2026: $109.91/kWh (0.79 RMB/Wh).
* C&I ESS: FY2023: $178.09/kWh (1.28 RMB/Wh); FY2024: $112.70/kWh (0.81 RMB/Wh); FY2025: N/A; 4M2026: N/A.
* Standalone ESS Products: FY2023: $91.83/kWh (0.66 RMB/Wh); FY2024: $58.43/kWh (0.42 RMB/Wh); FY2025: $59.83/kWh (0.43 RMB/Wh); 4M2026: $94.61/kWh (0.68 RMB/Wh).
The DuPont analysis highlights Return on Equity (ROE) compression from 85.6% in FY2023 to 47.8% in FY2025, driven primarily by financial deleveraging following pre-IPO equity injections rather than operational decay.
Working capital operational metrics reflect cash flow timing mismatches:
* Accounts Receivable (AR) Days: 65 days (FY2023), 117 days (FY2024), 143 days (FY2025), 326 days (4M2026).
* Inventory Turnover Days: 179 days (FY2023), 110 days (FY2024), 84 days (FY2025), 291 days (4M2026).
* Trade Payables (AP) Days: 205 days (FY2023), 230 days (FY2024), 240 days (FY2025), 627 days (4M2026).
* Net Cash Conversion Cycle (CCC): 39 days (FY2023), -3 days (FY2024), -13 days (FY2025), -10 days (4M2026).
Operating cash flow turned negative at -$62.58 million (RMB -449.80 million) in 4M2026 due to advance procurement of battery cells totaling $31.73 million (RMB 228.05 million) and delayed milestone payments on overseas projects, including the Oroszlány project in Hungary where $16.99 million (RMB 122.11 million) was recognized as revenue but remained uncollected pending automatic frequency restoration reserve (aFRR) grid certification.
Infrastructure Footprint, Supply Chain Integration, and Asset Allocation
RelyEZ manufactures and integrates hardware systems across multiple regional hubs, though operational bottlenecks are prompting a consolidation shift toward Zhejiang Province.
Table Operational Capacity & Production Performance Analysis
Due to severe supply chain friction in Yunnan, capacity expansions in Dali and Yaoan were frozen. Construction on regional facilities in Chaoyang, Liaoning (25,342 sq.m.) and Jinchang, Gansu (26,429 sq.m.) was also suspended, leaving $8.31 million (RMB 59.71 million) in uncommissioned Construction in Progress (CIP). Manufacturing operations are consolidating into a planned 10 GWh automated facility in Wuzhen, Zhejiang, scheduled for construction between September 2026 and May 2028. In the interim, RelyEZ leased a 46,719 sq.m. transitional facility in Jiaxing, Zhejiang, which initiated trial operations in June 2026.
COGS nature breakdown demonstrates high material pass-through dependency:
* Raw Materials: 84.7% (FY2023), 93.6% (FY2024), 95.6% (FY2025), 82.8% (4M2026).
* Direct Labor: 3.9% (FY2023), 1.5% (FY2024), 0.9% (FY2025), 2.7% (4M2026).
* Production Costs: 6.4% (FY2023), 3.7% (FY2024), 1.9% (FY2025), 8.0% (4M2026).
* Logistics/Freight/Warranty: 5.0% (FY2023), 1.2% (FY2024), 1.6% (FY2025), 6.5% (4M2026).
Supplier and customer concentration levels are high:
* Top 5 Supplier Concentration: 61.8% (FY2023), 70.9% (FY2024), 67.3% (FY2025), 77.0% (4M2026).
* Single Largest Supplier Exposure: 42.8% (FY2023), 56.6% (FY2024), 27.0% (FY2025 - Supplier A, Xiamen), 43.3% (4M2026).
* Top 5 Customer Concentration: 53.7% (FY2023), 81.6% (FY2024), 80.2% (FY2025), 94.3% (4M2026).
* Single Largest Customer Exposure: 11.8% (FY2023), 40.7% (FY2024 - Shanghai Ronghe Yuanchu), 44.5% (FY2025 - Customer H, Inner Mongolia project), 43.6% (4M2026 - Customer H, Hungary project).
Core component vendors include Supplier A (Xiamen) and Supplier B (Ningde) for LFP cells; Supplier I (Taizhou) for PCS equipment ($10.98 million / RMB 78.9 million in FY2025); Supplier K (Hangzhou High-Tech BMS / stock code 836506) for BMS components ($1.24 million / RMB 8.9 million in 4M2026); and Supplier L (Cangzhou, Hebei) for metal enclosure structures ($1.11 million / RMB 8.0 million in 4M2026).
Capital efficiency metrics model strong active returns:
* NOPAT: FY2023: $6.17 million (RMB 44.33 million); FY2024: $14.00 million (RMB 100.60 million); FY2025: $22.50 million (RMB 161.71 million).
* Invested Capital: FY2023: $13.45 million (RMB 96.66 million); FY2024: $34.67 million (RMB 249.19 million); FY2025: $63.55 million (RMB 456.74 million).
* ROIC (Ending Basis): 45.87% (FY2023), 40.37% (FY2024), 35.41% (FY2025).
* ROIC (Average Basis): 58.18% (FY2024), 45.81% (FY2025).
* Fixed Asset Turnover (Total PP&E): 8.37x (FY2023), 13.66x (FY2024), 17.12x (FY2025).
* Fixed Asset Turnover (Net Active Assets): 12.09x (FY2023), 21.08x (FY2024), 37.81x (FY2025).
Global Market Expansion, Regulatory Frameworks, and Trade Barriers
Geographic diversification accelerated rapidly in late FY2025 to capture international pricing premiums.
Table Geographic Revenue Distribution Analysis
*Compliance Statement: RelyEZ maintains zero active project assets, contracted pipeline, or corporate operations in Taiwan, Province of China.
Secured Hardware Pipeline & Backlog (2026–2027 Delivery)
North America (USA - Texas) |========================= 158.4 MWh (8 Projects)
East Asia (Japan) |=============== 104.0 MWh (13 Projects)
Latin America (Chile) |============ 80.0 MWh (1 Project)
Africa (Burkina Faso) |===== 30.0 MWh (1 Project)
Europe (Poland) |== 16.0 MWh (1 Project)
Africa (Kenya Microgrid) |= 3.75 MWh (1 Project)
Trade barriers in the United States present material cost hurdles. Products imported under HTSUS 8507.60 face a cumulative import tariff of 40.9%, comprising the standard HTSUS base duty, Section 301 tariffs on Chinese LFP cells (25%), and a 10% temporary import duty under Section 122 of the Trade Act of 1974 enacted on February 24, 2026 (replacing invalidated IEEPA tariffs). RelyEZ's contracts do not contain automatic tariff pass-through clauses, exposing its 158.4 MWh Texas pipeline to margin compression unless component sourcing is localized.
In Europe, RelyEZ faces phased compliance under EU Battery Regulation (EU 2023/1542):
* February 2026: Mandatory carbon footprint declarations for industrial batteries >2 kWh.
* February 2027: Digital Battery Passports via QR codes detailing raw material provenance.
* August 2028: Minimum recycled content documentation thresholds.
To bypass Net Zero Industry Act (NZIA - EU 2024/1735) local content restrictions and third-country inverter funding limits, RelyEZ deployed a hybrid integration strategy for the Oroszlány 110 MWh project in Hungary. The installation integrated Chinese-manufactured GridUltra battery containers with German-manufactured Power Conversion Systems (PCS) and local European transformers, backed by a 10-year Munich Re performance insurance policy.
Foreign exchange risks remain unhedged. RelyEZ maintains USD-denominated intercompany receivables of $10.64 million (RMB 76.46 million) and EUR-denominated receivables of $11.61 million (RMB 83.45 million). Sensitivity modeling demonstrates that a 5% appreciation or depreciation of the USD against the RMB impacts net profit by ±$479k (RMB ±3.45 million), while a 5% shift in the EUR impacts net profit by ±$499k (RMB ±3.59 million).
Governance Architecture, Valuation Trajectory, and Capital Structure
RelyEZ maintains a centralized, founder-led governance framework. Co-founders Mr. Wang Yu (37, Chairman) and Ms. Zhang Jiajing (42, CEO) hold voting control through a 36-month post-listing concert party agreement executed on May 10, 2023.
Pre-IPO Shareholding Structure (35.2 Million Shares Pre-Split)
Zhixin Boyan (Wang/Zhang 50/50 Hold Co) |=========================== 36.05%
Pinxiang Qianlin (Partnership) |============== 18.72%
Yuantong Equity Investment |========== 13.38%
Chengyi Zhixin (ESOP Platform) |======== 11.36%
Shenzhen Zuimu (Wang Yu Hold Co) |==== 6.74%
Pre-IPO Private Investors |========== 13.75%
The controlling shareholder group (Zhixin Boyan, Pinxiang Qianlin, Chengyi Zhixin, and Shenzhen Zuimu) holds a collective 72.88% voting stake. Share capital will undergo a 1-to-10 split to 352 million shares immediately prior to listing.
Pre-IPO equity financing rounds reflect rapid valuation expansion:
* Series A (April 2023): RMB 41.0 million ($5.70 million) injected by Guangdong Yuecai (RMB 40.0 million) and Zhuhai Yixingbanyue (RMB 1.0 million) at a post-split cost of RMB 2.53 ($0.35) per share, establishing an initial valuation of RMB 800 million ($111.3 million).
* LP Injections (September 2025): RMB 10.0 million ($1.39 million) injected into Pinxiang Qianlin at RMB 3.75 ($0.52) per share, implying a valuation of RMB 1.32 billion ($183.7 million).
* Strategic Transfers (December 2025): Guangdong Yuecai partially exited, selling stakes to Jiang Guoying (1.33% for RMB 20.0 million), Chen Xiongbing (0.13% for RMB 2.0 million), and Dongguan Bopu (0.80% for RMB 12.0 million) at a RMB 1.50 billion ($208.7 million) valuation.
* Pre-IPO Capital Expansion (December 2025 / Early 2026): Shenzhen Nanhai Growth, Tongxiang Wuzhen Zhenghai, and Shenzhen Zhuoyuan Lantou injected a combined RMB 200 million ($27.83 million).
* Secondary Equity Transfer (June 2026): Zhuoyuan Lantou transferred its 0.91% stake to Wang Haibo for RMB 20.0 million ($2.78 million) at an adjusted post-split cost of RMB 6.25 ($0.87) per share, bringing RelyEZ's final pre-IPO valuation to RMB 2.20 billion ($306.1 million).
Short-term debt obligations create a distinct funding mismatch:
* Total Borrowings: RMB 565.78 million ($78.72 million) as of April 30, 2026, of which RMB 533.48 million ($74.22 million) matures within one year.
* Liquid Assets: Cash and cash equivalents stood at RMB 175.89 million ($24.47 million). Restricted cash deposits pledged as collateral for bank loans and bills payable totaled RMB 690.73 million ($96.10 million).
* Personal Guarantees: Personal guarantees by Mr. Wang Yu and Ms. Zhang Jiajing covering RMB 332.20 million ($46.22 million) in bank credit lines will be fully released and replaced by corporate credit facilities upon listing.
Executive compensation totaled $118.96k (RMB 855k) in FY2023, $223.30k (RMB 1.61 million) in FY2024, $500.31k (RMB 3.60 million) in FY2025, and is projected at $473.04k (RMB 3.40 million) for FY2026. A Pre-IPO Share Option Scheme adopted on January 8, 2026, reserves 5.0% of pre-split share capital (fair value estimated at $4.17 million / RMB 29.94 million via Black-Scholes modeling) across 71 grantees, subject to a qualified listing vesting trigger and 3-year tranche schedules.
Technical Moat, Intellectual Property Audit, and Risk Assessment
RelyEZ’s technological moat relies on a proprietary "Cloud-Edge-Device" software suite integrated with immersion liquid-cooling thermal management hardware. The company holds 56 registered patents in China (15 Invention Patents, 36 Utility Model Patents, 5 Design Patents) and 30 software copyrights.
Core algorithmic performance metrics include:
* Day-Ahead Electricity Price Forecasting (EnergyMarket+): 85.0% accuracy vs. 80.0% industry average.
* Grid Dispatch Load Forecasting: 98.5% accuracy.
* Cash-on-Cash Arbitrage Yield Boost: +3.0% per kWh via dynamic trading algorithms developed with researchers from the Chinese University of Hong Kong (Shenzhen) and the Hong Kong University of Science and Technology.
* Immersion Liquid-Cooling Hardware: Battery cells are completely submerged in dielectric fluid, maintaining cell-to-cell temperature variance under 2°C, extending system design lifespan to 20 years, improving round-trip efficiency (RTE) by 2.0%, and operating between -30°C and 50°C.
R&D expenditure intensity shows temporary dilution before a recent rebound:
* FY2023: $2.64 million (RMB 18.98 million) / 4.4% of revenue.
* FY2024: $4.74 million (RMB 34.10 million) / 3.0% of revenue.
* FY2025: $5.29 million (RMB 38.03 million) / 2.0% of revenue.
* 4M2026: $1.88 million (RMB 13.51 million) / 4.8% of revenue.
R&D Spending as % of Revenue Peer Benchmarking (FY2025)
Sungrow Class Peer |======================================= 5.1%
BYD / Eve Class Peer |================================= 4.5%
Envision Class Peer |========================== 3.8%
RelyEZ |============== 2.0%
RelyEZ expenses 100% of internal R&D outlays under IAS 38, carrying zero capitalized development costs on its balance sheet. Intangible assets consist solely of purchased software valued at $143k (RMB 1.03 million) in 4M2026.
Legal, forensic, and credit risks remain active:
* Pending Litigation (The Hainan Fire Lawsuit): In July 2026, an EPC subcontractor sued RelyEZ and subsidiary Jiangsu RelyEZ in the Ledong Li Autonomous County People's Court of Hainan Province, claiming RMB 7.71 million ($1.07 million) plus interest over an October 2022 fire at a 100 MW / 50 MWh project. RelyEZ has recorded zero provisions, attributing the failure to a third-party Uninterruptible Power Supply (UPS) container.
* Credit Impairment (ECL Provisions): Trade receivables allowances for expected credit losses increased to RMB 20.50 million ($2.85 million) in 4M2026. Receivables aged over 180 days reached RMB 182.85 million ($25.44 million), representing 26.7% of total receivables. Subsequent collections as of June 30, 2026, totaled only RMB 38.30 million ($5.33 million), or 5.6% of the balance.
* Inventory Valuation Deflation: Inventory expanded to RMB 606.52 million ($84.38 million) with turnover days stretching to 291 days. Write-down provisions stood at RMB 2.00 million in 4M2026. A cancelled project in Songming, Yunnan left RMB 172.1 million ($23.94 million) of assembled BESS equipment in inventory awaiting re-allocation.
* Warranty Reserve: Warranty liabilities totaled $693.8k (RMB 4.99 million) in 4M2026. Provisions were maintained at 0.13% to 0.55% of revenue, comfortably exceeding actual historical claims of 0.04% to 0.19%.
* Government Support Dependency: Low earnings reliance on subsidies, with government grants representing 0.85% of PBT ($207k / RMB 1.49 million) in FY2025. Non-operating interest income reached $724k (RMB 5.20 million) in 4M2026, supported by 12.0% p.a. loans to US joint venture partner Emergen Energy LLC and 4.0% p.a. loans to associate Yunnan Lingwei.
HDIN Institutional Verdict
RelyEZ Energy Storage Technology Co., Ltd. presents an operational dichotomy for institutional investors. On one side, the company has demonstrated technical execution in software-hardware co-design, establishing an independent grid-side market position in China and securing early-mover pricing premiums in European markets that restored gross margins to 27.4%. Its zero-capitalization R&D accounting policy underscores high earnings quality.
Conversely, the business model exhibits high capital intensity and liquidity exposure. RelyEZ's working capital is strained by short-term bank borrowings of $74.22 million, inventory turnover of 291 days, slow receivables collection from domestic power developers, and high customer concentration (top 5 clients driving 94.3% of 4M2026 sales). Furthermore, expanding in the United States requires navigating a 40.9% Section 301 tariff hurdle without automatic contractual pass-through protections.
Long-term margin stability relies on executing the capacity consolidation into the 10 GWh Wuzhen automated plant by 2028, scaling recurring 88.8%-gross-margin power trading and O&M services, and localizing European and North American supply chains to comply with NZIA and US trade regulations.
Presentation Download & Video Access:
Presentation Download: Click the PDF download link under 'Related Topics' to access the full institutional presentation of this report.
Video Link: Click this link to watch the HDIN analyst briefing on YouTube.
About HDIN Research:
HDIN Research is a global market intelligence and strategic advisory firm specializing in institutional-grade financial analysis, supply chain audits, and macroeconomic forecasting. Our dedicated sector analysts deliver actionable, data-driven insights tailored for private equity, hedge funds, and corporate strategy teams. Visit us at http://www.hdinresearch.com.
2026 AI Transparency Footer:
"This intelligence report was authored by HDIN Research analysts following a rigorous audit of official corporate filings. AI was utilized for massive-scale data synthesis and structural drafting, ensuring 100% inclusion of reported data points. All strategic insights, financial modeling, and final verdicts were verified by our editorial board to ensure professional accuracy and compliance with 2026 Google Search E-E-A-T standards."
1. RelyEZ Energy Storage Technology Co., Ltd. achieved a 163.2% revenue CAGR from FY2023 to FY2025, reaching $259.84 million (RMB 1,867.61 million) as Large-scale ESS solutions scaled to 89.4% of total sales, despite domestic pricing wars driving gross margins down from 21.6% to 16.1%.
2. Consolidated gross margin recovered to 27.4% in 4M2026, propelled by European deliveries (44.6% of top-line revenue) at average selling prices of $154.43/kWh, successfully offsetting domestic margin erosion and a 40.9% US import tariff burden.
3. Liquidity pressure intensified in 4M2026 as total borrowings surged 306.8% to $78.72 million (RMB 565.78 million) to fund inventory stockpiling and capacity consolidation into a planned 10 GWh automated manufacturing plant in Wuzhen, Zhejiang.
Figure RelyEZ (Shenzhen) HKEX IPO & Global ESS Market Position
Segmental Realities, Margin Dynamics, and DuPont Financial PerformanceRelyEZ Energy Storage Technology Co., Ltd. [HKEX Pending] has completed a structural pivot from a component distributor into a turnkey system integrator within the electrochemical energy storage system (ESS) sector. According to Frost & Sullivan, the company ranked 10th in China's overall ESS market in FY2025 with 5.4 GWh in shipments (2.1% market share) out of a total domestic market of 252.5 GWh. In the Independent Grid-Side ESS segment, RelyEZ captured a 4th-place ranking in China with 3.4 GWh of newly installed capacity, representing a 12.5% market share of the 27.0 GWh total installed capacity.
Figure China 2025 ESS Shipments Market Share (252.5 GWh Total Market)
The financial performance reflects a rapid top-line expansion offset by severe domestic margin compression caused by upstream lithium-ion cell price pass-throughs. Upstream LFP cell prices declined from 0.85 RMB/Wh ($118.26/kWh) in 2022 to 0.36 RMB/Wh ($50.09/kWh) in 2024, hitting a low of 0.33 RMB/Wh ($45.91/kWh) in FY2025 before rebounding to 0.45 RMB/Wh ($62.61/kWh) in May 2026. Consequently, RelyEZ’s Large-scale ESS Average Selling Price (ASP) compressed 57.1% from 1.12 RMB/Wh ($155.83/kWh) in FY2023 to 0.48 RMB/Wh ($66.78/kWh) in FY2025.
Table Consolidated Financial Performance & Cash Flow Analysis
| Financial Performance Metric | FY2023 (RMB '000) | FY2023 (USD '000) | FY2024 (RMB '000) | FY2024 (USD '000) | FY2025 (RMB '000) | FY2025 (USD '000) | 4M2025 (RMB '000) | 4M2025 (USD '000) | 4M2026 (RMB '000) | 4M2026 (USD '000) |
| Revenue | 434,612 | 60,467.8 | 1,144,123 | 159,182.3 | 1,867,611 | 259,841.5 | 8,469 | 1,178.3 | 279,907 | 38,943.6 |
| Cost of Sales | (340,786) | (47,413.7) | (940,217) | (130,812.8) | (1,567,002) | (218,017.7) | (9,389) | (1,306.3) | (203,322) | (28,288.3) |
| Gross Profit (Loss) | 93,826 | 13,054.1 | 203,906 | 28,369.5 | 300,609 | 41,823.9 | (920) | (128.0) | 76,585 | 10,655.3 |
| Gross Margin (%) | 21.6% | 21.6% | 17.8% | 17.8% | 16.1% | 16.1% | -10.9% | -10.9% | 27.4% | 27.4% |
| Profit Before Tax (PBT) | 44,129 | 6,139.7 | 114,776 | 15,975.8 | 174,937 | 24,339.1 | (37,377) | (5,200.3) | 23,705 | 3,298.1 |
| Net Profit (Loss) | 40,741 | 5,668.3 | 96,265 | 13,393.4 | 153,561 | 21,365.0 | (28,859) | (4,015.2) | 23,071 | 3,209.9 |
| Net Margin (%) | 9.4% | 9.4% | 8.4% | 8.4% | 8.2% | 8.2% | -340.8% | -340.8% | 8.2% | 8.2% |
| Finance Costs | 3,904 | 543.2 | 5,133 | 714.2 | 9,245 | 1,286.3 | 1,117 | 155.4 | 3,422 | 476.1 |
| EBIT | 48,033 | 6,682.9 | 119,909 | 16,683.0 | 184,182 | 25,625.3 | (36,260) | (5,044.9) | 27,127 | 3,774.2 |
| Depreciation & Amort. | 12,955 | 1,802.4 | 18,154 | 2,525.8 | 20,908 | 2,909.0 | 6,823 | 949.3 | 6,952 | 967.2 |
| EBITDA | 60,988 | 8,485.3 | 138,063 | 19,208.8 | 205,090 | 28,535.7 | (29,437) | (4,095.6) | 34,079 | 4,741.4 |
| Operating Cash Flow | 61,832 | 8,602.7 | (40,882) | (5,687.9) | 803,269 | 111,759.2 | 45,504 | 6,331.0 | (449,802) | (62,581.1) |
| Total CapEx | (33,684) | (4,686.5) | (35,873) | (4,991.0) | (22,104) | (3,075.3) | (9,912) | (1,379.1) | (63,135) | (8,784.0) |
| Free Cash Flow (FCF) | 28,148 | 3,916.2 | (76,755) | (10,679.0) | 781,165 | 108,683.8 | 35,592 | 4,951.9 | (512,937) | (71,365.1) |
Segment revenue mix evolved through a intentional exit from commercial and industrial (C&I) hardware sales in China to prevent hyper-competitive margin erosion, shifting focus toward utility-scale deployments and high-margin recurring services.
Table Segment Revenue Evolution Analysis
| Revenue Segment | FY2023 Revenue | FY2023 Mix (%) | FY2024 Revenue | FY2024 Mix (%) | FY2025 Revenue | FY2025 Mix (%) | 4M2026 Revenue | 4M2026 Mix (%) |
|---|---|---|---|---|---|---|---|---|
| Large-Scale Projects | $1.00M | 1.6% | $66.39M | 41.7% | $232.25M | 89.4% | $29.76M | 76.4% |
| Commercial & Industrial (C&I) | $7.14M | 11.9% | $0.76M | 0.5% | $0.00M | 0.0% | $0.00M | 0.0% |
| Standalone Systems | $52.33M | 86.5% | $92.03M | 57.8% | $24.03M | 9.2% | $5.05M | 13.0% |
| Services | $0.00M | 0.0% | $0.00M | 0.0% | $3.57M | 1.4% | $4.13M | 10.6% |
| Total Segment Revenue | $60.47M | 100.0% | $159.18M | 100.0% | $259.85M | 100.0% | $38.94M | 100.0% |
Average Selling Prices across segments show structural volatility:
* Large-scale ESS: FY2023: $155.83/kWh (1.12 RMB/Wh); FY2024: $107.13/kWh (0.77 RMB/Wh); FY2025: $66.78/kWh (0.48 RMB/Wh); 4M2026: $109.91/kWh (0.79 RMB/Wh).
* C&I ESS: FY2023: $178.09/kWh (1.28 RMB/Wh); FY2024: $112.70/kWh (0.81 RMB/Wh); FY2025: N/A; 4M2026: N/A.
* Standalone ESS Products: FY2023: $91.83/kWh (0.66 RMB/Wh); FY2024: $58.43/kWh (0.42 RMB/Wh); FY2025: $59.83/kWh (0.43 RMB/Wh); 4M2026: $94.61/kWh (0.68 RMB/Wh).
The DuPont analysis highlights Return on Equity (ROE) compression from 85.6% in FY2023 to 47.8% in FY2025, driven primarily by financial deleveraging following pre-IPO equity injections rather than operational decay.
Working capital operational metrics reflect cash flow timing mismatches:
* Accounts Receivable (AR) Days: 65 days (FY2023), 117 days (FY2024), 143 days (FY2025), 326 days (4M2026).
* Inventory Turnover Days: 179 days (FY2023), 110 days (FY2024), 84 days (FY2025), 291 days (4M2026).
* Trade Payables (AP) Days: 205 days (FY2023), 230 days (FY2024), 240 days (FY2025), 627 days (4M2026).
* Net Cash Conversion Cycle (CCC): 39 days (FY2023), -3 days (FY2024), -13 days (FY2025), -10 days (4M2026).
Operating cash flow turned negative at -$62.58 million (RMB -449.80 million) in 4M2026 due to advance procurement of battery cells totaling $31.73 million (RMB 228.05 million) and delayed milestone payments on overseas projects, including the Oroszlány project in Hungary where $16.99 million (RMB 122.11 million) was recognized as revenue but remained uncollected pending automatic frequency restoration reserve (aFRR) grid certification.
Infrastructure Footprint, Supply Chain Integration, and Asset Allocation
RelyEZ manufactures and integrates hardware systems across multiple regional hubs, though operational bottlenecks are prompting a consolidation shift toward Zhejiang Province.
Table Operational Capacity & Production Performance Analysis
| Operational & Facility Metric | FY2023 | FY2024 | FY2025 | 4M2026 |
| Designed Annual Capacity (GWh) | 4.09 | 6.20 | 6.77 | 2.44 |
| — Zhenjiang Factory (Jiangsu) | 3.80 | 5.08 | 5.08 | 1.69 |
| — Dali Factory (Yunnan) | 0.28 | 1.13 | 1.13 | 0.38 |
| — Yaoan Factory (Yunnan) | — | — | 0.56 | 0.38 |
| Actual Production Output (GWh) | 2.16 | 3.47 | 5.01 | 0.96 |
| — Zhenjiang Factory | 2.16 | 3.34 | 4.85 | 0.96 |
| — Dali Factory | — | 0.13 | 0.07 | — |
| — Yaoan Factory | — | — | 0.10 | — |
| Capacity Utilization Rate (%) | 52.91% | 55.89% | 74.09% | 39.13% |
| — Zhenjiang Factory | 56.83% | 65.75% | 95.53% | 56.52% |
| — Dali Factory | 0.00% | 11.53% | 6.22% | 0.00% |
| — Yaoan Factory | — | — | 16.90% | 0.00% |
| Total Product Sales Volume (MWh) | 2,812.2 | 3,683.2 | 5,354.7 | 880.7 |
| — Large-scale ESS Solutions | 6.4 | 620.0 | 3,371.0 | 271.4 |
| — Commercial & Industrial ESS | 40.0 | 16.0 | — | — |
| — Standalone ESS Products | 2,765.8 | 3,047.2 | 1,983.7 | 609.3 |
Due to severe supply chain friction in Yunnan, capacity expansions in Dali and Yaoan were frozen. Construction on regional facilities in Chaoyang, Liaoning (25,342 sq.m.) and Jinchang, Gansu (26,429 sq.m.) was also suspended, leaving $8.31 million (RMB 59.71 million) in uncommissioned Construction in Progress (CIP). Manufacturing operations are consolidating into a planned 10 GWh automated facility in Wuzhen, Zhejiang, scheduled for construction between September 2026 and May 2028. In the interim, RelyEZ leased a 46,719 sq.m. transitional facility in Jiaxing, Zhejiang, which initiated trial operations in June 2026.
COGS nature breakdown demonstrates high material pass-through dependency:
* Raw Materials: 84.7% (FY2023), 93.6% (FY2024), 95.6% (FY2025), 82.8% (4M2026).
* Direct Labor: 3.9% (FY2023), 1.5% (FY2024), 0.9% (FY2025), 2.7% (4M2026).
* Production Costs: 6.4% (FY2023), 3.7% (FY2024), 1.9% (FY2025), 8.0% (4M2026).
* Logistics/Freight/Warranty: 5.0% (FY2023), 1.2% (FY2024), 1.6% (FY2025), 6.5% (4M2026).
Supplier and customer concentration levels are high:
* Top 5 Supplier Concentration: 61.8% (FY2023), 70.9% (FY2024), 67.3% (FY2025), 77.0% (4M2026).
* Single Largest Supplier Exposure: 42.8% (FY2023), 56.6% (FY2024), 27.0% (FY2025 - Supplier A, Xiamen), 43.3% (4M2026).
* Top 5 Customer Concentration: 53.7% (FY2023), 81.6% (FY2024), 80.2% (FY2025), 94.3% (4M2026).
* Single Largest Customer Exposure: 11.8% (FY2023), 40.7% (FY2024 - Shanghai Ronghe Yuanchu), 44.5% (FY2025 - Customer H, Inner Mongolia project), 43.6% (4M2026 - Customer H, Hungary project).
Core component vendors include Supplier A (Xiamen) and Supplier B (Ningde) for LFP cells; Supplier I (Taizhou) for PCS equipment ($10.98 million / RMB 78.9 million in FY2025); Supplier K (Hangzhou High-Tech BMS / stock code 836506) for BMS components ($1.24 million / RMB 8.9 million in 4M2026); and Supplier L (Cangzhou, Hebei) for metal enclosure structures ($1.11 million / RMB 8.0 million in 4M2026).
Capital efficiency metrics model strong active returns:
* NOPAT: FY2023: $6.17 million (RMB 44.33 million); FY2024: $14.00 million (RMB 100.60 million); FY2025: $22.50 million (RMB 161.71 million).
* Invested Capital: FY2023: $13.45 million (RMB 96.66 million); FY2024: $34.67 million (RMB 249.19 million); FY2025: $63.55 million (RMB 456.74 million).
* ROIC (Ending Basis): 45.87% (FY2023), 40.37% (FY2024), 35.41% (FY2025).
* ROIC (Average Basis): 58.18% (FY2024), 45.81% (FY2025).
* Fixed Asset Turnover (Total PP&E): 8.37x (FY2023), 13.66x (FY2024), 17.12x (FY2025).
* Fixed Asset Turnover (Net Active Assets): 12.09x (FY2023), 21.08x (FY2024), 37.81x (FY2025).
Global Market Expansion, Regulatory Frameworks, and Trade Barriers
Geographic diversification accelerated rapidly in late FY2025 to capture international pricing premiums.
Table Geographic Revenue Distribution Analysis
| Geographic Market | FY2023 (RMB '000) | FY23 % | FY2024 (RMB '000) | FY24 % | FY2025 (RMB '000) | FY25 % | 4M2026 (RMB '000) | 4M26 % |
| Mainland China | 434,612 | 100.0% | 1,144,123 | 100.0% | 1,858,832 | 99.5% | 154,964 | 55.4% |
| Europe | — | 0.0% | — | 0.0% | 207 | 0.0% | 124,943 | 44.6% |
| — Hungary | — | 0.0% | — | 0.0% | — | 0.0% | 122,106 | 43.6% |
| — Poland / Spain | — | 0.0% | — | 0.0% | 207 | 0.0% | 2,837 | 1.0% |
| Americas (USA) | — | 0.0% | — | 0.0% | 8,572 | 0.5% | — | 0.0% |
| Total | 434,612 | 100.0% | 1,144,123 | 100.0% | 1,867,611 | 100.0% | 279,907 | 100.0% |
*Compliance Statement: RelyEZ maintains zero active project assets, contracted pipeline, or corporate operations in Taiwan, Province of China.
Secured Hardware Pipeline & Backlog (2026–2027 Delivery)
North America (USA - Texas) |========================= 158.4 MWh (8 Projects)
East Asia (Japan) |=============== 104.0 MWh (13 Projects)
Latin America (Chile) |============ 80.0 MWh (1 Project)
Africa (Burkina Faso) |===== 30.0 MWh (1 Project)
Europe (Poland) |== 16.0 MWh (1 Project)
Africa (Kenya Microgrid) |= 3.75 MWh (1 Project)
Trade barriers in the United States present material cost hurdles. Products imported under HTSUS 8507.60 face a cumulative import tariff of 40.9%, comprising the standard HTSUS base duty, Section 301 tariffs on Chinese LFP cells (25%), and a 10% temporary import duty under Section 122 of the Trade Act of 1974 enacted on February 24, 2026 (replacing invalidated IEEPA tariffs). RelyEZ's contracts do not contain automatic tariff pass-through clauses, exposing its 158.4 MWh Texas pipeline to margin compression unless component sourcing is localized.
In Europe, RelyEZ faces phased compliance under EU Battery Regulation (EU 2023/1542):
* February 2026: Mandatory carbon footprint declarations for industrial batteries >2 kWh.
* February 2027: Digital Battery Passports via QR codes detailing raw material provenance.
* August 2028: Minimum recycled content documentation thresholds.
To bypass Net Zero Industry Act (NZIA - EU 2024/1735) local content restrictions and third-country inverter funding limits, RelyEZ deployed a hybrid integration strategy for the Oroszlány 110 MWh project in Hungary. The installation integrated Chinese-manufactured GridUltra battery containers with German-manufactured Power Conversion Systems (PCS) and local European transformers, backed by a 10-year Munich Re performance insurance policy.
Foreign exchange risks remain unhedged. RelyEZ maintains USD-denominated intercompany receivables of $10.64 million (RMB 76.46 million) and EUR-denominated receivables of $11.61 million (RMB 83.45 million). Sensitivity modeling demonstrates that a 5% appreciation or depreciation of the USD against the RMB impacts net profit by ±$479k (RMB ±3.45 million), while a 5% shift in the EUR impacts net profit by ±$499k (RMB ±3.59 million).
Governance Architecture, Valuation Trajectory, and Capital Structure
RelyEZ maintains a centralized, founder-led governance framework. Co-founders Mr. Wang Yu (37, Chairman) and Ms. Zhang Jiajing (42, CEO) hold voting control through a 36-month post-listing concert party agreement executed on May 10, 2023.
Pre-IPO Shareholding Structure (35.2 Million Shares Pre-Split)
Zhixin Boyan (Wang/Zhang 50/50 Hold Co) |=========================== 36.05%
Pinxiang Qianlin (Partnership) |============== 18.72%
Yuantong Equity Investment |========== 13.38%
Chengyi Zhixin (ESOP Platform) |======== 11.36%
Shenzhen Zuimu (Wang Yu Hold Co) |==== 6.74%
Pre-IPO Private Investors |========== 13.75%
The controlling shareholder group (Zhixin Boyan, Pinxiang Qianlin, Chengyi Zhixin, and Shenzhen Zuimu) holds a collective 72.88% voting stake. Share capital will undergo a 1-to-10 split to 352 million shares immediately prior to listing.
Pre-IPO equity financing rounds reflect rapid valuation expansion:
* Series A (April 2023): RMB 41.0 million ($5.70 million) injected by Guangdong Yuecai (RMB 40.0 million) and Zhuhai Yixingbanyue (RMB 1.0 million) at a post-split cost of RMB 2.53 ($0.35) per share, establishing an initial valuation of RMB 800 million ($111.3 million).
* LP Injections (September 2025): RMB 10.0 million ($1.39 million) injected into Pinxiang Qianlin at RMB 3.75 ($0.52) per share, implying a valuation of RMB 1.32 billion ($183.7 million).
* Strategic Transfers (December 2025): Guangdong Yuecai partially exited, selling stakes to Jiang Guoying (1.33% for RMB 20.0 million), Chen Xiongbing (0.13% for RMB 2.0 million), and Dongguan Bopu (0.80% for RMB 12.0 million) at a RMB 1.50 billion ($208.7 million) valuation.
* Pre-IPO Capital Expansion (December 2025 / Early 2026): Shenzhen Nanhai Growth, Tongxiang Wuzhen Zhenghai, and Shenzhen Zhuoyuan Lantou injected a combined RMB 200 million ($27.83 million).
* Secondary Equity Transfer (June 2026): Zhuoyuan Lantou transferred its 0.91% stake to Wang Haibo for RMB 20.0 million ($2.78 million) at an adjusted post-split cost of RMB 6.25 ($0.87) per share, bringing RelyEZ's final pre-IPO valuation to RMB 2.20 billion ($306.1 million).
Short-term debt obligations create a distinct funding mismatch:
* Total Borrowings: RMB 565.78 million ($78.72 million) as of April 30, 2026, of which RMB 533.48 million ($74.22 million) matures within one year.
* Liquid Assets: Cash and cash equivalents stood at RMB 175.89 million ($24.47 million). Restricted cash deposits pledged as collateral for bank loans and bills payable totaled RMB 690.73 million ($96.10 million).
* Personal Guarantees: Personal guarantees by Mr. Wang Yu and Ms. Zhang Jiajing covering RMB 332.20 million ($46.22 million) in bank credit lines will be fully released and replaced by corporate credit facilities upon listing.
Executive compensation totaled $118.96k (RMB 855k) in FY2023, $223.30k (RMB 1.61 million) in FY2024, $500.31k (RMB 3.60 million) in FY2025, and is projected at $473.04k (RMB 3.40 million) for FY2026. A Pre-IPO Share Option Scheme adopted on January 8, 2026, reserves 5.0% of pre-split share capital (fair value estimated at $4.17 million / RMB 29.94 million via Black-Scholes modeling) across 71 grantees, subject to a qualified listing vesting trigger and 3-year tranche schedules.
Technical Moat, Intellectual Property Audit, and Risk Assessment
RelyEZ’s technological moat relies on a proprietary "Cloud-Edge-Device" software suite integrated with immersion liquid-cooling thermal management hardware. The company holds 56 registered patents in China (15 Invention Patents, 36 Utility Model Patents, 5 Design Patents) and 30 software copyrights.
Core algorithmic performance metrics include:
* Day-Ahead Electricity Price Forecasting (EnergyMarket+): 85.0% accuracy vs. 80.0% industry average.
* Grid Dispatch Load Forecasting: 98.5% accuracy.
* Cash-on-Cash Arbitrage Yield Boost: +3.0% per kWh via dynamic trading algorithms developed with researchers from the Chinese University of Hong Kong (Shenzhen) and the Hong Kong University of Science and Technology.
* Immersion Liquid-Cooling Hardware: Battery cells are completely submerged in dielectric fluid, maintaining cell-to-cell temperature variance under 2°C, extending system design lifespan to 20 years, improving round-trip efficiency (RTE) by 2.0%, and operating between -30°C and 50°C.
R&D expenditure intensity shows temporary dilution before a recent rebound:
* FY2023: $2.64 million (RMB 18.98 million) / 4.4% of revenue.
* FY2024: $4.74 million (RMB 34.10 million) / 3.0% of revenue.
* FY2025: $5.29 million (RMB 38.03 million) / 2.0% of revenue.
* 4M2026: $1.88 million (RMB 13.51 million) / 4.8% of revenue.
R&D Spending as % of Revenue Peer Benchmarking (FY2025)
Sungrow Class Peer |======================================= 5.1%
BYD / Eve Class Peer |================================= 4.5%
Envision Class Peer |========================== 3.8%
RelyEZ |============== 2.0%
RelyEZ expenses 100% of internal R&D outlays under IAS 38, carrying zero capitalized development costs on its balance sheet. Intangible assets consist solely of purchased software valued at $143k (RMB 1.03 million) in 4M2026.
Legal, forensic, and credit risks remain active:
* Pending Litigation (The Hainan Fire Lawsuit): In July 2026, an EPC subcontractor sued RelyEZ and subsidiary Jiangsu RelyEZ in the Ledong Li Autonomous County People's Court of Hainan Province, claiming RMB 7.71 million ($1.07 million) plus interest over an October 2022 fire at a 100 MW / 50 MWh project. RelyEZ has recorded zero provisions, attributing the failure to a third-party Uninterruptible Power Supply (UPS) container.
* Credit Impairment (ECL Provisions): Trade receivables allowances for expected credit losses increased to RMB 20.50 million ($2.85 million) in 4M2026. Receivables aged over 180 days reached RMB 182.85 million ($25.44 million), representing 26.7% of total receivables. Subsequent collections as of June 30, 2026, totaled only RMB 38.30 million ($5.33 million), or 5.6% of the balance.
* Inventory Valuation Deflation: Inventory expanded to RMB 606.52 million ($84.38 million) with turnover days stretching to 291 days. Write-down provisions stood at RMB 2.00 million in 4M2026. A cancelled project in Songming, Yunnan left RMB 172.1 million ($23.94 million) of assembled BESS equipment in inventory awaiting re-allocation.
* Warranty Reserve: Warranty liabilities totaled $693.8k (RMB 4.99 million) in 4M2026. Provisions were maintained at 0.13% to 0.55% of revenue, comfortably exceeding actual historical claims of 0.04% to 0.19%.
* Government Support Dependency: Low earnings reliance on subsidies, with government grants representing 0.85% of PBT ($207k / RMB 1.49 million) in FY2025. Non-operating interest income reached $724k (RMB 5.20 million) in 4M2026, supported by 12.0% p.a. loans to US joint venture partner Emergen Energy LLC and 4.0% p.a. loans to associate Yunnan Lingwei.
HDIN Institutional Verdict
RelyEZ Energy Storage Technology Co., Ltd. presents an operational dichotomy for institutional investors. On one side, the company has demonstrated technical execution in software-hardware co-design, establishing an independent grid-side market position in China and securing early-mover pricing premiums in European markets that restored gross margins to 27.4%. Its zero-capitalization R&D accounting policy underscores high earnings quality.
Conversely, the business model exhibits high capital intensity and liquidity exposure. RelyEZ's working capital is strained by short-term bank borrowings of $74.22 million, inventory turnover of 291 days, slow receivables collection from domestic power developers, and high customer concentration (top 5 clients driving 94.3% of 4M2026 sales). Furthermore, expanding in the United States requires navigating a 40.9% Section 301 tariff hurdle without automatic contractual pass-through protections.
Long-term margin stability relies on executing the capacity consolidation into the 10 GWh Wuzhen automated plant by 2028, scaling recurring 88.8%-gross-margin power trading and O&M services, and localizing European and North American supply chains to comply with NZIA and US trade regulations.
Presentation Download & Video Access:
Presentation Download: Click the PDF download link under 'Related Topics' to access the full institutional presentation of this report.
Video Link: Click this link to watch the HDIN analyst briefing on YouTube.
About HDIN Research:
HDIN Research is a global market intelligence and strategic advisory firm specializing in institutional-grade financial analysis, supply chain audits, and macroeconomic forecasting. Our dedicated sector analysts deliver actionable, data-driven insights tailored for private equity, hedge funds, and corporate strategy teams. Visit us at http://www.hdinresearch.com.
2026 AI Transparency Footer:
"This intelligence report was authored by HDIN Research analysts following a rigorous audit of official corporate filings. AI was utilized for massive-scale data synthesis and structural drafting, ensuring 100% inclusion of reported data points. All strategic insights, financial modeling, and final verdicts were verified by our editorial board to ensure professional accuracy and compliance with 2026 Google Search E-E-A-T standards."