Deepak Fertilisers And Petrochemicals Corporation Limited: Industrial Solutions Pivot Near Gopalpur and Dahej Facilities as $534.50 Million Capex Ramp-Up Signals Deleveraging Phase
Date : 2026-08-13
Reading : 107
HDIN Executive Takeaways
1. Deepak Fertilisers And Petrochemicals Corporation Limited [NSE: DEEPAKFERT] posted FY 2025-26 consolidated revenues of $1,320.30 million (INR 11,506.03 crore), up 11.99% YoY, while operating EBITDA contracted 12.52% to $193.24 million (INR 1,684.00 crore) due to global Iso Propyl Alcohol margin erosion and planned maintenance turnarounds.
2. Peak capital investment nears completion as the $306.95 million Gopalpur Technical Ammonium Nitrate facility reaches 95% completion and the $227.55 million Dahej Nitric Acid expansion reaches 86% completion, driving consolidated Capital Work-in-Progress to $349.57 million ahead of H2 FY 2026-27 commissioning.
3. Balance sheet leverage rose to 2.96x Net Debt/EBITDA ($572.60 million net debt); however, full debt reclassification of $91.80 million in compulsory convertible debentures issued by Deepak Mining Solutions Limited would push effective leverage to 3.33x.
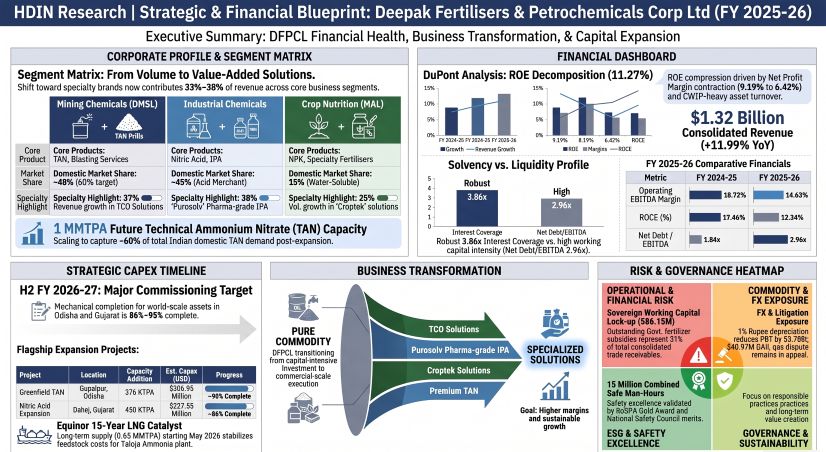
Figure Strategic & Financial Blueprint: Deepak Fertilisers & Petrochemicals Corp Ltd (FY 2025-26)
 Financial Performance and Segmental Revenue Dynamics
Deepak Fertilisers And Petrochemicals Corporation Limited transitioned into the operational phase of its capital deployment cycle during FY 2025-26. Consolidated operational revenue expanded 11.99% YoY to $1,320.30 million (INR 11,506.03 crore) from $1,178.98 million (INR 10,274.42 crore) in FY 2024-25 (converted at 1 USD = 87.1468 INR). Profitability metrics contracted across core operations, with operating EBITDA declining 12.52% YoY to $193.24 million (INR 1,684.00 crore) and Profit After Tax (PAT) falling 21.80% YoY to $84.77 million (INR 738.76 crore).
Table Consolidated Financial Performance & Balance Sheet Analysis
Under a three-step DuPont analysis, Return on Net Worth (RONW) contracted from 16.04% in FY 2024-25 to 11.27% in FY 2025-26. This performance was driven by a 277 bps reduction in Net Profit Margin (from 9.19% to 6.42%) and an asset turnover reduction from 0.7815x to 0.6979x. The drop in asset efficiency reflects $349.57 million (INR 3,04,636 lakhs) held in non-revenue-generating Capital Work-in-Progress (CWIP). Financial leverage expanded as the equity multiplier rose from 2.11x to 2.41x (debt-to-equity increased from 0.63x to 0.80x; reported net debt-to-equity shifted from 0.57x to 0.67x). Consolidated Return on Capital Employed (ROCE) fell from 17.46% to 12.34%, as consolidated EBIT fell 14.93% to $156.41 million (INR 1,36,305 lakhs) on a $1,267.80 million (INR 11,04,841 lakhs) capital base (+20.39%). The interest coverage ratio stood at 3.86x (compared to 3.88x in FY 2024-25).
Segment operational performance under Ind AS 108 evolved as follows:
* Chemicals Segment: Revenue increased 3.40% YoY to $608.65 million (INR 5,304.23 crore) from $588.66 million (INR 5,129.99 crore). Segment EBIT declined 18.82% YoY to $131.57 million (INR 1,146.61 crore) from $162.07 million (INR 1,412.37 crore), compressing operating margins from 27.53% to 21.62%.
* Fertilisers Segment: Revenue expanded 20.41% YoY to $707.49 million (INR 6,165.55 crore) from $587.56 million (INR 5,120.38 crore). Segment EBIT declined 1.25% YoY to $48.18 million (INR 419.89 crore) from $48.79 million (INR 425.22 crore), contracting margins from 8.30% to 6.81% due to raw material input costs and subsidy realignment delays.
Table Entity-Level Financial & Operational Performance Analysis
In Mining Chemicals, housed under wholly-owned subsidiary Deepak Mining Solutions Limited (DMSL), Technical Ammonium Nitrate (TAN) sales volumes reached a record 577,056 MT (+11% YoY from 518,619 MT). DMSL commands ~40% of the Indian TAN market. TAN represented 26.60% of consolidated group revenue (vs. 27.48% in FY 2024-25). Revenues from the Total Cost of Ownership (TCO) direct B2C services model grew 37% YoY. DMSL acquired Australia's Platinum Blasting Services Pty Ltd (PBS) outright by purchasing the remaining 15% stake for $7.21 million (AUD 10.699 million / INR 62.80 crore) and acquired Chardham Chemicals Private Limited (CCPL) on May 6, 2026, for $13.94 million (INR 121.45 crore), backed by a $2.70 million (INR 2,355 lakhs) capital advance paid in FY 2025-26.
In the Crop Nutrition Business under Mahadhan AgriTech Limited (MAL), NPK fertilizer volumes decreased 20.65% YoY to 494,348 MT (from 623,019 MT), while Nitro Phosphate (ANP) volumes reached 240,696 MT (down from 265,314 MT). Value-added specialty solutions generated 33% of segment revenue. Croptek formulations grew 25% YoY to 248 KT (from 198 KT), reaching 1 million farmers across 600,000 hectares. Water-Soluble Fertilisers (WSF) volumes grew 26% YoY, securing a 15% domestic market share. Cumulative sales for the Smartek brand surpassed 2.7 MMT.
In Industrial Chemicals, parent-managed merchant Nitric Acid sales volume rose 10% YoY. Concentrated Nitric Acid (CNA) volume reached 160,223 MT (vs. 155,170 MT); Dilute Nitric Acid (WNA) merchant volume reached 108,527 MT (vs. 97,600 MT), with total captive and merchant WNA production hitting 849 KT; Strong Nitric Acid (SNA) volume reached 33,587 MT (vs. 33,040 MT). Merchant Nitric Acid contributed 8.40% to consolidated revenue, where DFPCL holds a 45% domestic market share. Standalone Iso Propyl Alcohol (IPA) sales volume reached 62,847 MT (vs. 60,950 MT), with pharmacopeia-grade "Purosolv" accounting for 38% of IPA volume (+4% YoY). Combined IPA and Propane revenue contribution dropped to 5.80% (from 7.43% in FY 2024-25).
Table Receivables Aging & Expected Credit Loss (ECL) Analysis
Operating Cash Flow (CFO) contracted 89.03% YoY to $23.66 million (INR 206.23 crore), dropping the CFO/PAT earnings quality ratio from 1.99x to 0.28x. Net Working Capital expanded 137.43% YoY to $184.14 million (INR 1,604.71 crore). Gross trade receivables rose 44.89% YoY to $276.37 million (INR 2,40,851 lakhs), carrying a $7.49 million (INR 6,531 lakhs) expected credit loss allowance. Standalone parent trade receivables stood at $17.49 million (INR 15,241 lakhs) with a $2.51 million allowance (14.36% provision rate). Government of India (GoI) fertilizer subsidy receivables expanded 21.36% YoY to $86.15 million (INR 75,080 lakhs), representing 31.17% of total consolidated trade receivables. Subsidy revenue recognized during the year totaled $228.23 million (INR 1,98,893 lakhs), comprising $169.87 million from manufactured fertilizers and $58.36 million from traded fertilizers. Inventories rose 62.59% YoY to $199.41 million (INR 17,378 lakhs). Free Cash Flow fell to -$156.54 million (INR -1,364.19 crore) from +$85.38 million in FY 2024-25.
Infrastructure Layout and Regional Moats
Deepak Fertilisers And Petrochemicals Corporation Limited operates across five primary domestic manufacturing complexes, backed by deep feedstock backward integration:
Table Manufacturing & Operational Footprint Analysis
The Taloja asset houses the step-down subsidiary Performance Chemiserve Limited (PCL), which operates the 1,500 TPD greenfield Ammonia plant. In FY 2025-26, PCL produced 452,000 MT (452 KT) of Ammonia, supplying ~93% of total Group Ammonia feedstock requirements. PCL reported standalone revenues of $266.75 million (INR 2,324.60 crore) and a standalone net loss of $29.52 million (INR 257.29 crore) due to early-stage capital charges and gas costs. Feedstock security was reinforced by executing a 15-year LNG supply agreement with Equinor ASA (for up to 0.65 MMTPA, commencing May 2026, novated to Deepak Globalchem Pte Ltd in Singapore) and a 5-year regasification contract with Petronet LNG Limited. Merchant Ammonia market share reached ~33% in Western India via PCL. Additional Taloja infrastructure includes a 72,000 MTPA Liquid CO2 unit, a 200 TPD CO2 Liquefaction plant, an 8.86 MW captive solar installation, a grid demand expansion from 14,000 kVA to 21,000 kVA (adding 19 MW solar-wind hybrid power), and a new 20 TPD powdered WSF plant. The idle 300 TPD Methanol plant at Taloja K1 was permanently decommissioned.
Table Strategic Expansion Projects & Capacity Growth Analysis
The $306.95 million (INR 2,675 crore) greenfield Gopalpur TAN project reached 95% completion ($207.54 million recognized in CWIP), positioning the Group to control ~1 MMTPA of domestic TAN capacity (~60% Indian market share) post-commissioning in H2 FY 2026-27. The $227.55 million (INR 1,983 crore) Dahej Nitric Acid expansion reached 86% completion ($119.27 million recognized in CWIP), expanding group Nitric Acid capacity to 1,120 KTPA. Standalone foreign currency export earnings grew 19.15% YoY to $5.67 million (INR 49.40 crore), serving 23 countries.
HDIN Institutional Verdict and Accounting Risk Audit
A forensic audit of DFPCL's balance sheet exposes key risk factors across capital allocation, debt scheduling, tax exposure, and subsidiary governance:
Table Subsidiary Structure & Consolidated Financial Contribution Analysis
Capital Work-in-Progress (CWIP) Audit: Consolidated CWIP expanded 117.03% YoY to $349.57 million (INR 3,04,636 lakhs). Active project balances account for $326.81 million (Gopalpur $207.54 million; Dahej $119.27 million), containing $36.52 million (INR 31,826 lakhs) in capitalized interest (capitalization rates: 8.60% to 9.50%) and $11.32 million (INR 9,864 lakhs) in capitalized internal salaries. Contractual capital commitments dropped 60.21% YoY to $64.00 million (INR 55,778 lakhs).
Off-Balance-Sheet Leverage Risk: Subsidiary DMSL issued $91.80 million (INR 800 crore) in Compulsorily Convertible Debentures (CCDs). Management recognized $20.81 million (INR 18,131 lakhs) as a financial liability while classifying $71.08 million (INR 61,941 lakhs) as Equity (Non-Controlling Interests). If full-debt treatment were applied to reflect the constructive option agreement, Net Debt would rise to $643.68 million, expanding Net Debt/EBITDA from 2.96x to 3.33x.
Table Contractual Debt Maturity Profile Analysis
Debt Amortization & Treasury Exposure: Total borrowings reached $629.49 million (INR 5,48,582 lakhs). The <1 year maturity bucket of $162.12 million includes $116.39 million in short-term working capital demand loans and $40.50 million in scheduled long-term loan repayments. Cash reserves total $61.53 million ($45.61 million cash; $15.92 million bank balances). The FX derivative book stands at $383.82 million (USD forwards $313.16 million; USD options $64.27 million; EUR forwards $6.38 million), marked to market via P&L. Commodity derivatives carry a $5.82 million asset value, with $2.47 million (INR 2,149 lakhs) reclassified from OCI into the cost of materials consumed. Unhedged FX exposure stands at $6.68 million; a 1% USD appreciation against the INR reduces consolidated PBT by $3.78 million (INR 3,29.60 lakhs).
Table Contingent Liabilities & Litigation Exposure Analysis
Tax & Legal Contingencies: Effective Tax Rate (ETR) stood at 26.88% (PBT $115.93 million; tax expense $31.16 million) against the statutory 25.17% rate. Reconciliations include statutory tax $29.18 million, subsidiary rate differentials +$3.09 million (+2.66%), CSR disallowances +$0.22 million (+0.19%), IT interest +$0.16 million (+0.13%), prior-period tax adjustments -$2.19 million (-1.89%), Section 80M dividend deductions -$3.44 million (-2.97%), and CCD processing fee deductions -$0.53 million (-0.46%). Net Deferred Tax Assets stood at $36.66 million (containing a $107.20 million business loss tax shield offset by $76.32 million in depreciation liabilities). State industrial incentive income contributed $12.45 million (INR 10,851 lakhs).
Gross contingent liabilities declined 58.37% YoY to $89.39 million (INR 77,903 lakhs) following the resolution of $124.64 million in income tax disputes. Material unprovisioned claims include the $40.97 million (INR 35,700 lakhs) GAIL gas diversion dispute (pending before the Supreme Court of India via SLP), a $11.02 million (INR 9,604 lakhs) MAL search-and-seizure tax penalty under appeal, and an entry tax natural gas demand where $4.35 million (3%) is provisioned and $2.17 million is contingent. An MCA Section 129 compounding order was settled on December 26, 2025, for $40,735 (INR 35.50 lakhs).
Table Related Party Transactions (RPT) & Intercompany Exposure Analysis
Governance & ESG Execution: Board structure comprises 10 members (7 Independent [70%]; 2 Women [20%]). Executive compensation adjusted alongside corporate earnings: CMD Mr. S. C. Mehta's total remuneration fell 18.89% YoY to $3.59 million (INR 3,130.86 lakhs; commission payable $2.30 million); JMD Mr. Yeshil S. Mehta's remuneration fell 3.87% YoY to $6.52 million (INR 5,686.00 lakhs; commission payable $6.32 million); Non-Executive Director commission dropped 13.13% YoY to $200,400 (INR 174.60 lakhs). Board changes include Yeshil S. Mehta appointed Additional Director (July 1, 2026), Dr. Purvi Mehta Bhatt appointed Independent Director (January 1, 2026), and S. C. Mehta appointed CMD of DMSL (June 1, 2026). Stakeholder Relationship Committee resolved 87 of 87 shareholder complaints. POSH complaints totaled 0. Safety milestones include the RoSPA Gold Award at Gopalpur (>10 million safe man-hours) and Dahej (>5 million safe man-hours). CSR outlay via Ishanya Foundation reached $375,500 (INR 327.27 lakhs spent; $480,500 transferred to unspent account), impacting 63,076 beneficiaries.
Incremental Capital Efficiency Model: Combined new capital deployment of $534.50 million (Gopalpur $306.95 million; Dahej $227.55 million) is projected to generate between $281.49 million (direct merchant output) and $386.79 million (full vertical integration value) at 100% capacity utilization. At $608.61/MT TAN and $350.98/MT Nitric Acid baselines, incremental asset turnover is modeled between 0.527x and 0.724x. This supports management's guidance of asset turnover recovery toward historical baseline levels (0.7815x) and operational cash-driven deleveraging starting in FY 2026-27.
Presentation Download & Video Access:
- Presentation Download: Click the PDF download link under 'Related Topics' to access the full institutional presentation of this report.
- Video Link: Click this link to watch the HDIN analyst briefing on YouTube.
About HDIN Research:
HDIN Research is a premier global market intelligence and strategic advisory firm specializing in institutional-grade financial analysis, supply chain audits, and macroeconomic forecasting. Our dedicated sector analysts deliver actionable, data-driven insights tailored for private equity, hedge funds, and corporate strategy teams. Visit us at http://www.hdinresearch.com.
2026 AI Transparency Footer:
"This intelligence report was authored by HDIN Research analysts following a rigorous audit of official corporate filings. AI was utilized for massive-scale data synthesis and structural drafting, ensuring 100% inclusion of reported data points. All strategic insights, financial modeling, and final verdicts were verified by our editorial board to ensure professional accuracy and compliance with 2026 Google Search E-E-A-T standards."
1. Deepak Fertilisers And Petrochemicals Corporation Limited [NSE: DEEPAKFERT] posted FY 2025-26 consolidated revenues of $1,320.30 million (INR 11,506.03 crore), up 11.99% YoY, while operating EBITDA contracted 12.52% to $193.24 million (INR 1,684.00 crore) due to global Iso Propyl Alcohol margin erosion and planned maintenance turnarounds.
2. Peak capital investment nears completion as the $306.95 million Gopalpur Technical Ammonium Nitrate facility reaches 95% completion and the $227.55 million Dahej Nitric Acid expansion reaches 86% completion, driving consolidated Capital Work-in-Progress to $349.57 million ahead of H2 FY 2026-27 commissioning.
3. Balance sheet leverage rose to 2.96x Net Debt/EBITDA ($572.60 million net debt); however, full debt reclassification of $91.80 million in compulsory convertible debentures issued by Deepak Mining Solutions Limited would push effective leverage to 3.33x.
Figure Strategic & Financial Blueprint: Deepak Fertilisers & Petrochemicals Corp Ltd (FY 2025-26)
Financial Performance and Segmental Revenue DynamicsDeepak Fertilisers And Petrochemicals Corporation Limited transitioned into the operational phase of its capital deployment cycle during FY 2025-26. Consolidated operational revenue expanded 11.99% YoY to $1,320.30 million (INR 11,506.03 crore) from $1,178.98 million (INR 10,274.42 crore) in FY 2024-25 (converted at 1 USD = 87.1468 INR). Profitability metrics contracted across core operations, with operating EBITDA declining 12.52% YoY to $193.24 million (INR 1,684.00 crore) and Profit After Tax (PAT) falling 21.80% YoY to $84.77 million (INR 738.76 crore).
Table Consolidated Financial Performance & Balance Sheet Analysis
| Key Consolidated Metric | FY2024-25 (INR Cr) | FY2025-26 (INR Cr) | FY2024-25 (USD M) | FY2025-26 (USD M) | YoY Change (%) |
|---|---|---|---|---|---|
| Revenue from Operations | 10,274.42 | 11,506.03 | $1,178.98 | $1,320.30 | +11.99% |
| Operating EBITDA | 1,925.00 | 1,684.00 | $220.89 | $193.24 | -12.52% |
| EBITDA Margin (%) | 18.73% | 14.63% | 18.73% | 14.63% | -410 bps |
| Profit Before Tax (PBT) | 1,189.29 | 1,010.32 | $136.47 | $115.93 | -15.05% |
| Profit After Tax (PAT) | 944.67 | 738.76 | $108.40 | $84.77 | -21.80% |
| Cash Flow from Operations (CFO) | 1,879.66 | 206.23 | $215.69 | $23.66 | -89.03% |
| Capital Expenditures (CapEx) | 1,135.63 | 1,570.42 | $130.31 | $180.20 | +38.28% |
| Net Working Capital (NWC) | 675.87 | 1,604.71 | $77.56 | $184.14 | +137.43% |
| Reported Net Debt | 3,538.54 | 4,990.01 | $406.04 | $572.60 | +41.02% |
| Total Assets | 13,147.62 | 16,487.76 | $1,508.68 | $1,891.95 | +25.41% |
Under a three-step DuPont analysis, Return on Net Worth (RONW) contracted from 16.04% in FY 2024-25 to 11.27% in FY 2025-26. This performance was driven by a 277 bps reduction in Net Profit Margin (from 9.19% to 6.42%) and an asset turnover reduction from 0.7815x to 0.6979x. The drop in asset efficiency reflects $349.57 million (INR 3,04,636 lakhs) held in non-revenue-generating Capital Work-in-Progress (CWIP). Financial leverage expanded as the equity multiplier rose from 2.11x to 2.41x (debt-to-equity increased from 0.63x to 0.80x; reported net debt-to-equity shifted from 0.57x to 0.67x). Consolidated Return on Capital Employed (ROCE) fell from 17.46% to 12.34%, as consolidated EBIT fell 14.93% to $156.41 million (INR 1,36,305 lakhs) on a $1,267.80 million (INR 11,04,841 lakhs) capital base (+20.39%). The interest coverage ratio stood at 3.86x (compared to 3.88x in FY 2024-25).
Segment operational performance under Ind AS 108 evolved as follows:
* Chemicals Segment: Revenue increased 3.40% YoY to $608.65 million (INR 5,304.23 crore) from $588.66 million (INR 5,129.99 crore). Segment EBIT declined 18.82% YoY to $131.57 million (INR 1,146.61 crore) from $162.07 million (INR 1,412.37 crore), compressing operating margins from 27.53% to 21.62%.
* Fertilisers Segment: Revenue expanded 20.41% YoY to $707.49 million (INR 6,165.55 crore) from $587.56 million (INR 5,120.38 crore). Segment EBIT declined 1.25% YoY to $48.18 million (INR 419.89 crore) from $48.79 million (INR 425.22 crore), contracting margins from 8.30% to 6.81% due to raw material input costs and subsidy realignment delays.
Table Entity-Level Financial & Operational Performance Analysis
| Entity / Business Line | Turnover (USD M) | Turnover (INR Cr) | PAT / EBIT (USD M) | PAT / EBIT (INR Cr) | Volume / Operational Metric |
|---|---|---|---|---|---|
| Deepak Mining Solutions Ltd. (DMSL) | $303.40 | 2,644.05 | $69.86 (PAT) | 608.83 (PAT) | 577,056 MT TAN |
| Mahadhan AgriTech Limited (MAL) | $753.35 | 6,565.18 | $20.85 (PAT) | 181.66 (PAT) | 494,348 MT NPK |
| Performance Chemiserve Limited (PCL) | $266.75 | 2,324.60 | $(29.52) (LAT) | (257.29) (LAT) | 452,000 MT NH₃ |
| Parent Standalone (DFPCL) | $487.65 | 4,249.70 | $30.89 (PAT) | 269.25 (PAT) | 316 KT Acid Sales |
In Mining Chemicals, housed under wholly-owned subsidiary Deepak Mining Solutions Limited (DMSL), Technical Ammonium Nitrate (TAN) sales volumes reached a record 577,056 MT (+11% YoY from 518,619 MT). DMSL commands ~40% of the Indian TAN market. TAN represented 26.60% of consolidated group revenue (vs. 27.48% in FY 2024-25). Revenues from the Total Cost of Ownership (TCO) direct B2C services model grew 37% YoY. DMSL acquired Australia's Platinum Blasting Services Pty Ltd (PBS) outright by purchasing the remaining 15% stake for $7.21 million (AUD 10.699 million / INR 62.80 crore) and acquired Chardham Chemicals Private Limited (CCPL) on May 6, 2026, for $13.94 million (INR 121.45 crore), backed by a $2.70 million (INR 2,355 lakhs) capital advance paid in FY 2025-26.
In the Crop Nutrition Business under Mahadhan AgriTech Limited (MAL), NPK fertilizer volumes decreased 20.65% YoY to 494,348 MT (from 623,019 MT), while Nitro Phosphate (ANP) volumes reached 240,696 MT (down from 265,314 MT). Value-added specialty solutions generated 33% of segment revenue. Croptek formulations grew 25% YoY to 248 KT (from 198 KT), reaching 1 million farmers across 600,000 hectares. Water-Soluble Fertilisers (WSF) volumes grew 26% YoY, securing a 15% domestic market share. Cumulative sales for the Smartek brand surpassed 2.7 MMT.
In Industrial Chemicals, parent-managed merchant Nitric Acid sales volume rose 10% YoY. Concentrated Nitric Acid (CNA) volume reached 160,223 MT (vs. 155,170 MT); Dilute Nitric Acid (WNA) merchant volume reached 108,527 MT (vs. 97,600 MT), with total captive and merchant WNA production hitting 849 KT; Strong Nitric Acid (SNA) volume reached 33,587 MT (vs. 33,040 MT). Merchant Nitric Acid contributed 8.40% to consolidated revenue, where DFPCL holds a 45% domestic market share. Standalone Iso Propyl Alcohol (IPA) sales volume reached 62,847 MT (vs. 60,950 MT), with pharmacopeia-grade "Purosolv" accounting for 38% of IPA volume (+4% YoY). Combined IPA and Propane revenue contribution dropped to 5.80% (from 7.43% in FY 2024-25).
Table Receivables Aging & Expected Credit Loss (ECL) Analysis
| Receivables Aging Category | Gross Receivables (USD M) | Implied ECL Rate (%) | Expected Credit Loss Reserve (USD M) |
|---|---|---|---|
| Not Due | $183.73 | 0.17% | $0.31 |
| Past Due < 6 Months | $80.13 | 0.24% | $0.19 |
| Past Due 6 Months – 1 Year | $3.46 | 7.88% | $0.27 |
| Past Due 1 – 2 Years | $2.14 | 11.24% | $0.24 |
| Past Due 2 – 3 Years | $0.74 | 57.00% | $0.42 |
| Past Due > 3 Years | $6.18 | 98.00% | $6.07 |
| Total Gross Receivables Portfolio | $276.37 | 2.71% | $7.49 |
Operating Cash Flow (CFO) contracted 89.03% YoY to $23.66 million (INR 206.23 crore), dropping the CFO/PAT earnings quality ratio from 1.99x to 0.28x. Net Working Capital expanded 137.43% YoY to $184.14 million (INR 1,604.71 crore). Gross trade receivables rose 44.89% YoY to $276.37 million (INR 2,40,851 lakhs), carrying a $7.49 million (INR 6,531 lakhs) expected credit loss allowance. Standalone parent trade receivables stood at $17.49 million (INR 15,241 lakhs) with a $2.51 million allowance (14.36% provision rate). Government of India (GoI) fertilizer subsidy receivables expanded 21.36% YoY to $86.15 million (INR 75,080 lakhs), representing 31.17% of total consolidated trade receivables. Subsidy revenue recognized during the year totaled $228.23 million (INR 1,98,893 lakhs), comprising $169.87 million from manufactured fertilizers and $58.36 million from traded fertilizers. Inventories rose 62.59% YoY to $199.41 million (INR 17,378 lakhs). Free Cash Flow fell to -$156.54 million (INR -1,364.19 crore) from +$85.38 million in FY 2024-25.
Infrastructure Layout and Regional Moats
Deepak Fertilisers And Petrochemicals Corporation Limited operates across five primary domestic manufacturing complexes, backed by deep feedstock backward integration:
Table Manufacturing & Operational Footprint Analysis
| Facility Location | Land / Footprint | Primary Assets | Capital / Output Status |
|---|---|---|---|
| Taloja, MIDC (Maharashtra) | Plots K1, K7–8, E31 | 1,500 TPD Ammonia Plant | 452 KT NH₃; 93% Captive Supply |
| Dahej Industrial Area (Gujarat) | Coastal Corridor | Nitric Acid Hub | $227.55M CapEx; 86% Complete |
| Gopalpur Maritime Hub (Odisha) | Port Proximity | Greenfield TAN Facility | $306.95M CapEx; 95% Complete |
| Srikakulam Complex (Andhra Pradesh) | Southern Hub | Regional Crop & Mining Operations | Active Regional Distribution |
| Panipat Facility (Haryana) | Northern Belt | NPK & Crop Nutrition | Active Regional Manufacturing |
The Taloja asset houses the step-down subsidiary Performance Chemiserve Limited (PCL), which operates the 1,500 TPD greenfield Ammonia plant. In FY 2025-26, PCL produced 452,000 MT (452 KT) of Ammonia, supplying ~93% of total Group Ammonia feedstock requirements. PCL reported standalone revenues of $266.75 million (INR 2,324.60 crore) and a standalone net loss of $29.52 million (INR 257.29 crore) due to early-stage capital charges and gas costs. Feedstock security was reinforced by executing a 15-year LNG supply agreement with Equinor ASA (for up to 0.65 MMTPA, commencing May 2026, novated to Deepak Globalchem Pte Ltd in Singapore) and a 5-year regasification contract with Petronet LNG Limited. Merchant Ammonia market share reached ~33% in Western India via PCL. Additional Taloja infrastructure includes a 72,000 MTPA Liquid CO2 unit, a 200 TPD CO2 Liquefaction plant, an 8.86 MW captive solar installation, a grid demand expansion from 14,000 kVA to 21,000 kVA (adding 19 MW solar-wind hybrid power), and a new 20 TPD powdered WSF plant. The idle 300 TPD Methanol plant at Taloja K1 was permanently decommissioned.
Table Strategic Expansion Projects & Capacity Growth Analysis
| Strategic Expansion Project | Greenfield TAN Facility (Gopalpur) | Brownfield Nitric Acid Expansion (Dahej) |
|---|---|---|
| Operating Entity | Deepak Mining Solutions Ltd. (DMSL) | Parent Entity (DFPCL Standalone) |
| Incremental Rated Capacity | 376 KTPA TAN (900 WNA / 1,143 KTPA TAN equivalent) | 300 KTPA WNA + 150 KTPA CNA |
| Total Capital Allocation | $306.95M (INR 2,675 Cr) | $227.55M (INR 1,983 Cr) |
| Cumulative CWIP Recognized | $207.54M (INR 1,80,863 Lakhs) | $119.27M (INR 1,03,943 Lakhs) |
| Project Completion Status / Target Commissioning | 95% Complete / H2 FY2026-27 | 86% Complete / H2 FY2026-27 |
| On-Site Safety Performance | >10 Million Safe Man-Hours | >5 Million Safe Man-Hours |
| Targeted Market Position Post Ramp-Up | ~1 MMTPA Group TAN Capacity (~60% India Market Share) | 1,120 KTPA Total Acid Capacity (Top-Tier Asian Position) |
The $306.95 million (INR 2,675 crore) greenfield Gopalpur TAN project reached 95% completion ($207.54 million recognized in CWIP), positioning the Group to control ~1 MMTPA of domestic TAN capacity (~60% Indian market share) post-commissioning in H2 FY 2026-27. The $227.55 million (INR 1,983 crore) Dahej Nitric Acid expansion reached 86% completion ($119.27 million recognized in CWIP), expanding group Nitric Acid capacity to 1,120 KTPA. Standalone foreign currency export earnings grew 19.15% YoY to $5.67 million (INR 49.40 crore), serving 23 countries.
HDIN Institutional Verdict and Accounting Risk Audit
A forensic audit of DFPCL's balance sheet exposes key risk factors across capital allocation, debt scheduling, tax exposure, and subsidiary governance:
Table Subsidiary Structure & Consolidated Financial Contribution Analysis
| Subsidiary Entity | Group Ownership (%) | Net Assets (INR Lakhs) | Net Profit / (Loss) (INR Lakhs) |
|---|---|---|---|
| Parent Standalone (DFPCL) | Parent Entity | 366,106 | 26,925 |
| Deepak Mining Solutions Limited (DMSL) | 100.0% | 480,959 | 60,882 |
| Mahadhan AgriTech Limited (MAL) | 100.0% | 244,817 | 18,167 |
| Performance Chemiserve Limited (PCL) | 100.0% (Step-down Subsidiary) | 223,357 | (25,729) |
| Platinum Blasting Services (Consolidated) | 100.0% (Step-down Subsidiary) | 13,813 | 1,630 |
| Ishanya Brand Services Limited (IBSL) | 100.0% | 3 | 913 |
| SCM Fertichem Limited (SCMFL) | 100.0% | 1 | 3 |
| Consolidation Adjustments / Eliminations | N/A | (644,623) | (9,067) |
| Total Consolidated Balance Sheet | 100.0% | 746,398 | 73,876 |
Capital Work-in-Progress (CWIP) Audit: Consolidated CWIP expanded 117.03% YoY to $349.57 million (INR 3,04,636 lakhs). Active project balances account for $326.81 million (Gopalpur $207.54 million; Dahej $119.27 million), containing $36.52 million (INR 31,826 lakhs) in capitalized interest (capitalization rates: 8.60% to 9.50%) and $11.32 million (INR 9,864 lakhs) in capitalized internal salaries. Contractual capital commitments dropped 60.21% YoY to $64.00 million (INR 55,778 lakhs).
Off-Balance-Sheet Leverage Risk: Subsidiary DMSL issued $91.80 million (INR 800 crore) in Compulsorily Convertible Debentures (CCDs). Management recognized $20.81 million (INR 18,131 lakhs) as a financial liability while classifying $71.08 million (INR 61,941 lakhs) as Equity (Non-Controlling Interests). If full-debt treatment were applied to reflect the constructive option agreement, Net Debt would rise to $643.68 million, expanding Net Debt/EBITDA from 2.96x to 3.33x.
Table Contractual Debt Maturity Profile Analysis
| Contractual Debt Maturity Category | Carrying Amount (INR Lakhs) | Carrying Amount (USD M) | Share of Total Debt (%) |
|---|---|---|---|
| Short-Term (< 1 Year) | 141,280 | $162.12 | 25.75% |
| Medium-Term (1–5 Years) | 330,850 | $379.65 | 60.31% |
| Long-Term (> 5 Years) | 76,452 | $87.73 | 13.94% |
| Total Outstanding Borrowings | 548,582 | $629.49 | 100.00% |
Debt Amortization & Treasury Exposure: Total borrowings reached $629.49 million (INR 5,48,582 lakhs). The <1 year maturity bucket of $162.12 million includes $116.39 million in short-term working capital demand loans and $40.50 million in scheduled long-term loan repayments. Cash reserves total $61.53 million ($45.61 million cash; $15.92 million bank balances). The FX derivative book stands at $383.82 million (USD forwards $313.16 million; USD options $64.27 million; EUR forwards $6.38 million), marked to market via P&L. Commodity derivatives carry a $5.82 million asset value, with $2.47 million (INR 2,149 lakhs) reclassified from OCI into the cost of materials consumed. Unhedged FX exposure stands at $6.68 million; a 1% USD appreciation against the INR reduces consolidated PBT by $3.78 million (INR 3,29.60 lakhs).
Table Contingent Liabilities & Litigation Exposure Analysis
| Contingent Liability Category | FY2025 (INR Lakhs) | FY2026 (INR Lakhs) | FY2026 (USD M) |
|---|---|---|---|
| GST Act 2017 Disputes | 28,650 | 28,271 | $32.44 |
| Supplier Claims (Non-Debt Related) | 20,572 | 21,241 | $24.37 |
| Sales Tax & VAT Demands | 15,411 | 15,703 | $18.02 |
| Income Tax Demands | 114,457 | 5,833 | $6.69 |
| Local Body Tax (LBT) | 2,382 | 2,382 | $2.73 |
| Entry Tax Penalties | 1,891 | 1,891 | $2.17 |
| Excise / Service Tax Claims (Government) | 3,079 | 1,881 | $2.16 |
| Excise / Service Tax Claims (Company) | 669 | 668 | $0.77 |
| Customs Act 1962 Claims | — | 33 | $0.04 |
| Total Contingent Liability Exposure | 187,110 | 77,903 | $89.39 |
Tax & Legal Contingencies: Effective Tax Rate (ETR) stood at 26.88% (PBT $115.93 million; tax expense $31.16 million) against the statutory 25.17% rate. Reconciliations include statutory tax $29.18 million, subsidiary rate differentials +$3.09 million (+2.66%), CSR disallowances +$0.22 million (+0.19%), IT interest +$0.16 million (+0.13%), prior-period tax adjustments -$2.19 million (-1.89%), Section 80M dividend deductions -$3.44 million (-2.97%), and CCD processing fee deductions -$0.53 million (-0.46%). Net Deferred Tax Assets stood at $36.66 million (containing a $107.20 million business loss tax shield offset by $76.32 million in depreciation liabilities). State industrial incentive income contributed $12.45 million (INR 10,851 lakhs).
Gross contingent liabilities declined 58.37% YoY to $89.39 million (INR 77,903 lakhs) following the resolution of $124.64 million in income tax disputes. Material unprovisioned claims include the $40.97 million (INR 35,700 lakhs) GAIL gas diversion dispute (pending before the Supreme Court of India via SLP), a $11.02 million (INR 9,604 lakhs) MAL search-and-seizure tax penalty under appeal, and an entry tax natural gas demand where $4.35 million (3%) is provisioned and $2.17 million is contingent. An MCA Section 129 compounding order was settled on December 26, 2025, for $40,735 (INR 35.50 lakhs).
Table Related Party Transactions (RPT) & Intercompany Exposure Analysis
| Related Party Transaction Category | Transacting Entity | Cash / Transaction Value (USD M) | Cash / Transaction Value (INR) |
|---|---|---|---|
| DFPCL Rights Issue Investment | Mahadhan AgriTech Limited (MAL) | $45.90 | INR 400.00 Cr |
| Parent Loan Advances / Repayments | Mahadhan AgriTech Limited (MAL) | $120.31 / $102.53 | INR 104,850M / 89,350M |
| Parent Working Capital Loan Outstanding | Mahadhan AgriTech Limited (MAL) | $17.79 | INR 15,500 Lakhs |
| Parent Cost & Fee Flows | Mahadhan AgriTech Limited (MAL) | $7.83 (Services) / $14.04 (Payments) | INR 6,819M / 12,232M |
| Management Fees & Interest Income | Mahadhan AgriTech Limited (MAL) | $14.54 / $1.35 | INR 12,668M / 1,173M |
| Intercompany Corporate Guarantees | Mahadhan AgriTech Limited (MAL) | $16.33 ($5.93 Outstanding) | INR 14,227M ($5.93M Outstanding) |
| DMSL Loan Advances / Repayments | Deepak Mining Solutions Ltd. (DMSL) | $57.83 / $91.69 | INR 50,400M / 79,907M |
| DMSL OCD Liquidation | Deepak Mining Solutions Ltd. (DMSL) | $57.37 | INR 50,000 Lakhs |
| Cash Dividend Received by Parent | Deepak Mining Solutions Ltd. (DMSL) | $11.75 | INR 10,236 Lakhs |
| Parent Corporate Guarantee to DMSL | Deepak Mining Solutions Ltd. (DMSL) | $176.82 ($126.10 Outstanding) | INR 154,089M ($109,894M Outstanding) |
| Captive Ammonia Sourcing Costs | Performance Chemiserve Ltd. (PCL) | $30.17 | INR 26,294 Lakhs |
| Parent Technical Support Fees | Performance Chemiserve Ltd. (PCL) | $4.19 | INR 3,647 Lakhs |
| Sales & Purchases with Affiliate | Deepak Nitrite Limited | $5.07 (Sales) / $0.34 (Purchases) | INR 4,419M / 295M |
| Promoter Entity Loan Interest | SCM / SCM Growth | $1.32 / $2.57 | INR 1,152M / 2,242M |
Governance & ESG Execution: Board structure comprises 10 members (7 Independent [70%]; 2 Women [20%]). Executive compensation adjusted alongside corporate earnings: CMD Mr. S. C. Mehta's total remuneration fell 18.89% YoY to $3.59 million (INR 3,130.86 lakhs; commission payable $2.30 million); JMD Mr. Yeshil S. Mehta's remuneration fell 3.87% YoY to $6.52 million (INR 5,686.00 lakhs; commission payable $6.32 million); Non-Executive Director commission dropped 13.13% YoY to $200,400 (INR 174.60 lakhs). Board changes include Yeshil S. Mehta appointed Additional Director (July 1, 2026), Dr. Purvi Mehta Bhatt appointed Independent Director (January 1, 2026), and S. C. Mehta appointed CMD of DMSL (June 1, 2026). Stakeholder Relationship Committee resolved 87 of 87 shareholder complaints. POSH complaints totaled 0. Safety milestones include the RoSPA Gold Award at Gopalpur (>10 million safe man-hours) and Dahej (>5 million safe man-hours). CSR outlay via Ishanya Foundation reached $375,500 (INR 327.27 lakhs spent; $480,500 transferred to unspent account), impacting 63,076 beneficiaries.
Incremental Capital Efficiency Model: Combined new capital deployment of $534.50 million (Gopalpur $306.95 million; Dahej $227.55 million) is projected to generate between $281.49 million (direct merchant output) and $386.79 million (full vertical integration value) at 100% capacity utilization. At $608.61/MT TAN and $350.98/MT Nitric Acid baselines, incremental asset turnover is modeled between 0.527x and 0.724x. This supports management's guidance of asset turnover recovery toward historical baseline levels (0.7815x) and operational cash-driven deleveraging starting in FY 2026-27.
Presentation Download & Video Access:
- Presentation Download: Click the PDF download link under 'Related Topics' to access the full institutional presentation of this report.
- Video Link: Click this link to watch the HDIN analyst briefing on YouTube.
About HDIN Research:
HDIN Research is a premier global market intelligence and strategic advisory firm specializing in institutional-grade financial analysis, supply chain audits, and macroeconomic forecasting. Our dedicated sector analysts deliver actionable, data-driven insights tailored for private equity, hedge funds, and corporate strategy teams. Visit us at http://www.hdinresearch.com.
2026 AI Transparency Footer:
"This intelligence report was authored by HDIN Research analysts following a rigorous audit of official corporate filings. AI was utilized for massive-scale data synthesis and structural drafting, ensuring 100% inclusion of reported data points. All strategic insights, financial modeling, and final verdicts were verified by our editorial board to ensure professional accuracy and compliance with 2026 Google Search E-E-A-T standards."