Amcor plc: Post-Merger Consolidation Near $23.5 Billion Net Sales Target Signals Structural Return on Equity Expansion
Date : 2026-08-20
Reading : 219
HDIN Executive Takeaways
1. Net sales reached $23,506 million (+56.61% YoY) following the full-year integration of Berry Global Group, Inc., driving Return on Equity up 502 basis points to 9.38%.
2. Organic volume contracted 2.0% across packaging assets, but $650 million in target synergies and pricing controls expanded gross margins by 110 basis points to 20.0%.
3. Operating Cash Flow of $2,151 million fully covered $922 million in CapEx and $1,195 million in cash dividends, maintaining Net Debt at $12,897 million with 3.48x covenant leverage.
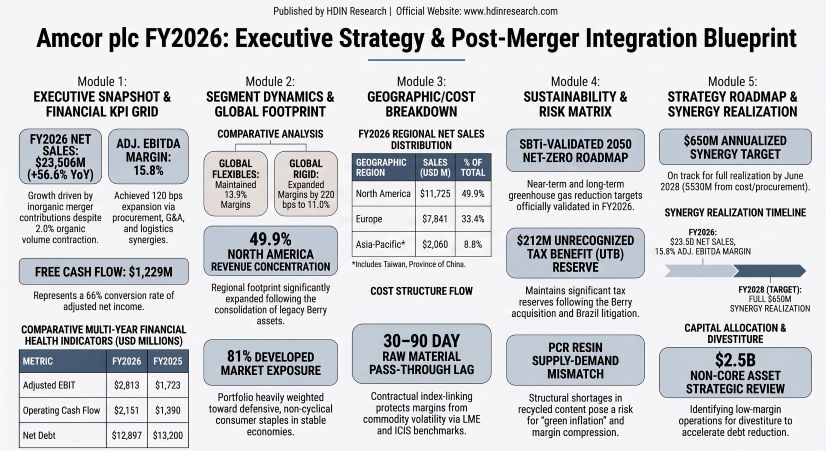
Figure Amcor plc FY2026: Executive Strategy & Post-Merger Integration Blueprint
 Segmental Realities and Financial Performance
Amcor plc [NYSE: AMCR] completed its financial integration of Berry Global Group, Inc. following the $10.4 billion all-stock transaction closed on April 30, 2025. Consolidated Net Sales for the fiscal year ended June 30, 2026, expanded 56.61% YoY to $23,506 million. The top-line expansion was driven by $7,864 million in net inorganic sales from Berry Global, $649 million in favorable foreign exchange translation, and $240 million from raw material inflation pass-through, offsetting an organic volume contraction of 2.0% ($260 million net sales reduction).
Table Consolidated Financial Performance and Cash Flow Analysis (FY2024–FY2026)
Effective January 1, 2026, Amcor plc consolidated its flexible and rigid packaging operations in Latin America under a unified management structure, recasting its reportable segments by transferring select flexible operations in Latin America into the Global Rigid division.
Table Segment Revenue and Adjusted EBIT Performance Analysis (FY2025–FY2026)
In Global Flexible Solutions, Berry Global added $2,240 million in inorganic sales, currency translation added $333 million, and raw material pass-through contributed $240 million, offsetting a 1.0% organic volume decline ($50 million reduction). In Global Rigid Solutions, Berry Global added $5,624 million in net sales and currency added $318 million, while organic volume fell 3.0% ($208 million reduction) combined with a 1.0% negative price/mix.
Table Geographic Revenue Distribution by Segment (FY2026)
Developed markets generated 81% of FY2026 revenue, while emerging markets accounted for 19%.
Table DuPont Analysis of Financial Performance and Return on Equity (FY2025–FY2026)
The cash conversion cycle normalized in FY2026 following accounting distortions in FY2025, where 100% of Berry Global's balance sheet was consolidated against 2 months of income statement metrics.
Table Working Capital Efficiency and Cash Conversion Cycle Analysis (FY2025–FY2026)
Non-GAAP adjustments to EBIT totaled $916 million in FY2026, comprising $558 million in acquired intangible amortization, $266 million in restructuring and Berry Plan integration expenses, $32 million in transaction costs, $22 million in portfolio review expenses, and $19 million in hyperinflation monetary losses in Argentina. Operating Cash Flow ($2,151 million) exceeded Reported Operating Income ($1,899 million) by $252 million due to $1,479 million in non-cash depreciation, amortization, and impairments ($873 million PP&E depreciation, $577 million intangible amortization), offsetting $252 million in net working capital cash outflows (Receivables -$323 million, Inventories -$329 million, Payables +$570 million, Other liabilities -$170 million).
Infrastructure Layout, Capital Allocation, and Regulatory Exposure
Amcor plc operates approximately 400 manufacturing and support facilities across 40 countries with 75,000 employees. Global Flexible operates ~190 facilities across 33 countries (75% owned, 25% leased), while Global Rigid operates ~210 facilities across 33 countries (60% owned, 40% leased).
In FY2026, Amcor closed two manufacturing facilities in Asia within the Flexible segment, incurring $15 million in inventory discrepancies linked to operational inefficiencies. On August 29, 2025, the company completed a $17 million acquisition of a Brazilian rigid packaging plant. Under its portfolio rationalization review targeting $2.5 billion of low-margin operations, Amcor divested four non-core rigid packaging businesses for $298 million in cash proceeds plus a $40 million deferred receivable, and exited its minority equity stake in ePac Holdings, LLC for $79 million.
Capital deployment reached $2,188 million in FY2026: $1,195 million in cash dividends, $922 million in PP&E CapEx ($451 million Flexible, $458 million Rigid, $13 million Corporate), $71 million to purchase 200,000 treasury shares on the open market at an average price of $37.65 per share to satisfy employee equity incentive vestings, and $17 million in M&A cash spent. Programmed share buybacks were $0. The Board declared a quarterly dividend of $0.65 per share on August 12, 2026, establishing an annualized run-rate of $2.60 per share (following the 1-for-5 Reverse Stock Split executed on January 14, 2026).
Table Contractual Debt Maturity Profile and Principal Repayment Schedule
Long-term debt maturities include $400 million of 1.65% notes due January 2027, €500 million of 1.13% notes due June 2027, $725 million of 4.80% notes due FY2028, $500 million of 5.50% notes due FY2028, $750 million of 4.25% notes due FY2029, $500 million of 5.45% notes due FY2029, $1.29 billion in commercial paper backstopped by a $3.75 billion syndicated credit facility maturing March 2030 (facility fee 0.11% per annum), $800 million of 2.69% notes due FY2031, and $800 million of 5.80% notes due FY2031. Undrawn committed credit headroom stood at $2.46 billion as of June 30, 2026.
Net Debt stood at $12,897 million ($14,012 million total reported debt less $1,115 million cash). Covenant net leverage was 3.48x (Net Debt / $3,705 million Adjusted EBITDA), safely below the maximum bank covenant threshold of 3.90x (4.25x M&A step-up). Interest expense was $676 million, yielding an Adjusted EBIT interest coverage ratio of 4.16x (2.81x on Reported EBIT). Short-term debt weighted-average interest was 3.98%. Swaps maintained $650 million in notional receive-fixed, pay-variable interest rate hedges.
Total Cost of Goods Sold reached $18,816 million (80.0% of Net Sales). Implied total raw material spend is $8,500 million (45.2% of COGS), where a 1.0% unrecovered increase in resin, aluminum, paper, and solvent prices reduces pre-tax income by $85 million. Commodity hedging derivative volumes stood at 23,746 tons of aluminum (-19.1% YoY), 7,334 tons of aluminum regional premium, and 560,000 lbs of PET resin (-90.4% YoY). Supply Chain Financing (SCF) obligations ended at $809 million ($901 million opening balance + $2,143 million confirmed invoices - $2,231 million paid invoices - $4 million FX impact).
Table Effective Tax Rate (ETR) Reconciliation Analysis (FY2026)
Unrecognized Tax Benefits (UTBs) totaled $212 million (100% favorably impacts ETR if recognized) with $45 million in accrued interest/penalties. Deferred tax liabilities recorded on undistributed foreign earnings totaled $110 million.
Intangible assets and goodwill total $18,663 million (50.3% of total assets), comprising $12,075 million in goodwill ($6,019 million Flexible, $6,056 million Rigid) and $6,588 million in finite-lived intangibles ($6,102 million net customer relationships [16-year useful life], $118 million software, $368 million trademarks). Annual impairment testing on April 1 confirmed zero goodwill write-downs.
Restructuring liabilities ended at $116 million ($105 million employee severance, $11 million exit costs). The Berry Plan targets $650 million in annualized pre-tax synergies by June 30, 2028 ($530 million cost, $60 million financial, $60 million growth) on a $280 million net pre-tax cash restructuring budget ($208 million cumulative recognized charges, $107 million cash paid) and $100 million in general integration expenses ($84 million paid).
Table Operational Risk Exposure and Financial Sensitivity Analysis
In May 2026, the Board approved a change in fiscal year-end from June 30 to December 31, effective for the transition period July 1, 2026 through December 31, 2026. Forward commitments for FY2027 include $216 million in CapEx, $1,200 million in non-cancellable purchase obligations ($260 million FY28, $190 million FY29, $80 million FY30, $10 million FY31), $582 million in acquired intangible amortization ($548 million FY28, $542 million FY29, $528 million FY30, $518 million FY31), and $65.1 million in defined benefit pension plan funding. R&D spend was $170 million (0.7% of sales) supported by ~1,500 R&D personnel and >5,000 active patents.
Amcor plc is governed by an 11-member Board of Directors (Graeme Liebelt, Non-Executive Chairman; Peter Konieczny, CEO; 9 independent non-executive directors). Incorporated under the laws of the Bailiwick of Jersey, corporate governance specifies the Royal Court of Jersey as the exclusive forum for derivative shareholder claims.
HDIN Institutional Verdict
Amcor plc's post-merger integration of Berry Global Group, Inc. presents a structural bifurcation between expanded financial scale and underlying volume contraction. Management's execution of the Berry Plan is visible in the 110 basis point expansion in gross margin (20.0%) and 220 basis point expansion in Global Rigid operating margin (11.0%), confirming that targeted procurement and G&A cost synergies are offsetting organic volume headwinds (-2.0%).
Earnings quality relies heavily on Non-GAAP adjustments—totaling $916 million on EBIT—primarily driven by $558 million in acquired intangible amortization and $266 million in restructuring costs. However, Operating Cash Flow of $2,151 million provides a 1.13x coverage ratio relative to Reported Operating Income ($1,899 million), demonstrating robust cash conversion.
Balance sheet leverage remains managed. Covenant leverage of 3.48x provides a 42 basis point cushion below the 3.90x bank covenant ceiling, while $377 million in divestiture proceeds ($298 million cash + $79 million ePac exit) were directed toward debt reduction. The main mid-term operational risks rest on raw material price lag recovery ($85 million sensitivity per 1% unrecovered inflation) and meeting PCR content mandates amid recycling supply constraints.
Presentation Download & Video Access
Presentation Download: Click the PDF download link under 'Related Topics' to access the full institutional presentation of this report.
Video Link: Click this link to watch the HDIN analyst briefing on YouTube.
About HDIN Research
HDIN Research is a premier global market intelligence and strategic advisory firm specializing in institutional-grade financial analysis, supply chain audits, and macroeconomic forecasting. Our dedicated sector analysts deliver actionable, data-driven insights tailored for private equity, hedge funds, and corporate strategy teams. Visit us at [http://www.hdinresearch.com](http://www.hdinresearch.com).
2026 AI Transparency Footer
This intelligence report was authored by HDIN Research analysts following a rigorous audit of official corporate filings. AI was utilized for massive-scale data synthesis and structural drafting, ensuring 100% inclusion of reported data points. All strategic insights, financial modeling, and final verdicts were verified by our editorial board to ensure professional accuracy and compliance with 2026 Google Search E-E-A-T standards.
1. Net sales reached $23,506 million (+56.61% YoY) following the full-year integration of Berry Global Group, Inc., driving Return on Equity up 502 basis points to 9.38%.
2. Organic volume contracted 2.0% across packaging assets, but $650 million in target synergies and pricing controls expanded gross margins by 110 basis points to 20.0%.
3. Operating Cash Flow of $2,151 million fully covered $922 million in CapEx and $1,195 million in cash dividends, maintaining Net Debt at $12,897 million with 3.48x covenant leverage.
Figure Amcor plc FY2026: Executive Strategy & Post-Merger Integration Blueprint
Segmental Realities and Financial PerformanceAmcor plc [NYSE: AMCR] completed its financial integration of Berry Global Group, Inc. following the $10.4 billion all-stock transaction closed on April 30, 2025. Consolidated Net Sales for the fiscal year ended June 30, 2026, expanded 56.61% YoY to $23,506 million. The top-line expansion was driven by $7,864 million in net inorganic sales from Berry Global, $649 million in favorable foreign exchange translation, and $240 million from raw material inflation pass-through, offsetting an organic volume contraction of 2.0% ($260 million net sales reduction).
Table Consolidated Financial Performance and Cash Flow Analysis (FY2024–FY2026)
| Consolidated Metric | FY2026 | FY2025 | FY2024 | YoY Change (%) |
| Net Sales | $23,506M | $15,009M | $13,640M | +56.61% |
| Organic Sales Growth | (2.0)% | N/A | N/A | -200 bps |
| Gross Profit | $4,690M | $2,834M | $2,712M | +65.49% |
| Gross Margin | 20.0% | 18.9% | 19.9% | +110 bps |
| Operating Income (Reported EBIT) | $1,899M | $1,009M | $1,214M | +88.21% |
| Adjusted EBIT (Non-GAAP) | $2,813M | $1,723M | $1,560M | +63.26% |
| Implied Adjusted EBITDA | $3,705M | $2,193M | $1,976M | +68.95% |
| Implied Adjusted EBITDA Margin | 15.8% | 14.6% | 14.5% | +120 bps |
| Reported Net Income Attributable | $1,106M | $511M | $730M | +116.44% |
| Adjusted Net Income (Non-GAAP) | $1,863M | $1,136M | $1,015M | +63.99% |
| Diluted EPS (Reported) | $2.38 | $1.60 | $2.52 | +48.75% |
| Implied Adjusted Diluted EPS | $4.02 | $3.57 | $3.52 | +12.61% |
| Operating Cash Flow (OCF) | $2,151M | $1,390M | $1,321M | +54.75% |
| Capital Expenditures (CapEx) | $922M | $580M | $492M | +58.97% |
| Free Cash Flow (FCF) | $1,229M | $810M | $829M | +51.73% |
| FCF Conversion (FCF / Adj Net Inc) | 66.02% | 71.30% | 81.67% | -528 bps |
Effective January 1, 2026, Amcor plc consolidated its flexible and rigid packaging operations in Latin America under a unified management structure, recasting its reportable segments by transferring select flexible operations in Latin America into the Global Rigid division.
Table Segment Revenue and Adjusted EBIT Performance Analysis (FY2025–FY2026)
| Segment Reporting (Recasted) | Net Sales (FY26) | Net Sales (FY25) | YoY Sales Change | Adj. EBIT (FY26) | Adj. EBIT (FY25) | Operating Margin (FY26) |
| Global Flexible Solutions | $12,829M | $10,066M | +27.4% | $1,789M | $1,398M | 13.9% (Flat YoY) |
| Global Rigid Solutions | $10,677M | $4,943M | +116.0% | $1,176M | $435M | 11.0% (+220 bps) |
In Global Flexible Solutions, Berry Global added $2,240 million in inorganic sales, currency translation added $333 million, and raw material pass-through contributed $240 million, offsetting a 1.0% organic volume decline ($50 million reduction). In Global Rigid Solutions, Berry Global added $5,624 million in net sales and currency added $318 million, while organic volume fell 3.0% ($208 million reduction) combined with a 1.0% negative price/mix.
Table Geographic Revenue Distribution by Segment (FY2026)
| Geographic Revenue Region | Global Flexible ($M) | Global Rigid ($M) | Total Net Sales ($M) | % Share of Total Sales |
| North America | $6,346 | $5,379 | $11,725 | 49.9% |
| Europe | $4,536 | $3,305 | $7,841 | 33.4% |
| Asia Pacific | $1,697 | $363 | $2,060 | 8.8% |
| Latin America | $250 | $1,630 | $1,880 | 8.0% |
| Total Net Sales | $12,829 | $10,677 | $23,506 | 100.0% |
Developed markets generated 81% of FY2026 revenue, while emerging markets accounted for 19%.
Table DuPont Analysis of Financial Performance and Return on Equity (FY2025–FY2026)
| DuPont Analysis Component | FY2026 Formula / Value | FY2025 Formula / Value | Operational & Financial Driver |
| Net Profit Margin (NPM) | $1,106M / $23,506M = 4.71% | $511M / $15,009M = 3.40% | Gross margin expansion (+110 bps) & effective tax rate decline to 14.1%. |
| Asset Turnover (ATO) | $23,506M / $37,095M = 0.6337x | $15,009M / $37,066M = 0.4049x | Full-year consolidation of Berry Global sales relative to total assets. |
| Financial Leverage (FL) | $37,095M / $11,790M = 3.1463x | $37,066M / $11,728M = 3.1605x | Balance sheet equity expansion and targeted debt paydowns. |
| Return on Equity (ROE) | 9.38% | 4.36% | +502 bps expansion driven operationally by ATO and NPM expansion. |
The cash conversion cycle normalized in FY2026 following accounting distortions in FY2025, where 100% of Berry Global's balance sheet was consolidated against 2 months of income statement metrics.
Table Working Capital Efficiency and Cash Conversion Cycle Analysis (FY2025–FY2026)
| Working Capital Velocity Metric | FY2026 (Reported) | FY2025 (Pro Forma) | FY2025 (Reported) |
| Days Sales Outstanding (DSO) | 56.5 days | 53.8 days | 83.3 days |
| Days Inventory Outstanding (DIO) | 71.2 days | 68.1 days | 104.1 days |
| Days Payables Outstanding (DPO) | 78.0 days | 68.5 days | 104.6 days |
| Cash Conversion Cycle (CCC) | 49.7 days | 53.4 days | 82.8 days |
Non-GAAP adjustments to EBIT totaled $916 million in FY2026, comprising $558 million in acquired intangible amortization, $266 million in restructuring and Berry Plan integration expenses, $32 million in transaction costs, $22 million in portfolio review expenses, and $19 million in hyperinflation monetary losses in Argentina. Operating Cash Flow ($2,151 million) exceeded Reported Operating Income ($1,899 million) by $252 million due to $1,479 million in non-cash depreciation, amortization, and impairments ($873 million PP&E depreciation, $577 million intangible amortization), offsetting $252 million in net working capital cash outflows (Receivables -$323 million, Inventories -$329 million, Payables +$570 million, Other liabilities -$170 million).
Infrastructure Layout, Capital Allocation, and Regulatory Exposure
Amcor plc operates approximately 400 manufacturing and support facilities across 40 countries with 75,000 employees. Global Flexible operates ~190 facilities across 33 countries (75% owned, 25% leased), while Global Rigid operates ~210 facilities across 33 countries (60% owned, 40% leased).
In FY2026, Amcor closed two manufacturing facilities in Asia within the Flexible segment, incurring $15 million in inventory discrepancies linked to operational inefficiencies. On August 29, 2025, the company completed a $17 million acquisition of a Brazilian rigid packaging plant. Under its portfolio rationalization review targeting $2.5 billion of low-margin operations, Amcor divested four non-core rigid packaging businesses for $298 million in cash proceeds plus a $40 million deferred receivable, and exited its minority equity stake in ePac Holdings, LLC for $79 million.
Capital deployment reached $2,188 million in FY2026: $1,195 million in cash dividends, $922 million in PP&E CapEx ($451 million Flexible, $458 million Rigid, $13 million Corporate), $71 million to purchase 200,000 treasury shares on the open market at an average price of $37.65 per share to satisfy employee equity incentive vestings, and $17 million in M&A cash spent. Programmed share buybacks were $0. The Board declared a quarterly dividend of $0.65 per share on August 12, 2026, establishing an annualized run-rate of $2.60 per share (following the 1-for-5 Reverse Stock Split executed on January 14, 2026).
Table Contractual Debt Maturity Profile and Principal Repayment Schedule
| Contractual Debt Maturity Profile | FY2027 | FY2028 | FY2029 | FY2030 | FY2031 | Thereafter | Total Outflow |
| Principal Repayments ($M) | $1,704 | $1,726 | $1,250 | $3,376 | $1,600 | $4,263 | $13,919 |
Long-term debt maturities include $400 million of 1.65% notes due January 2027, €500 million of 1.13% notes due June 2027, $725 million of 4.80% notes due FY2028, $500 million of 5.50% notes due FY2028, $750 million of 4.25% notes due FY2029, $500 million of 5.45% notes due FY2029, $1.29 billion in commercial paper backstopped by a $3.75 billion syndicated credit facility maturing March 2030 (facility fee 0.11% per annum), $800 million of 2.69% notes due FY2031, and $800 million of 5.80% notes due FY2031. Undrawn committed credit headroom stood at $2.46 billion as of June 30, 2026.
Net Debt stood at $12,897 million ($14,012 million total reported debt less $1,115 million cash). Covenant net leverage was 3.48x (Net Debt / $3,705 million Adjusted EBITDA), safely below the maximum bank covenant threshold of 3.90x (4.25x M&A step-up). Interest expense was $676 million, yielding an Adjusted EBIT interest coverage ratio of 4.16x (2.81x on Reported EBIT). Short-term debt weighted-average interest was 3.98%. Swaps maintained $650 million in notional receive-fixed, pay-variable interest rate hedges.
Total Cost of Goods Sold reached $18,816 million (80.0% of Net Sales). Implied total raw material spend is $8,500 million (45.2% of COGS), where a 1.0% unrecovered increase in resin, aluminum, paper, and solvent prices reduces pre-tax income by $85 million. Commodity hedging derivative volumes stood at 23,746 tons of aluminum (-19.1% YoY), 7,334 tons of aluminum regional premium, and 560,000 lbs of PET resin (-90.4% YoY). Supply Chain Financing (SCF) obligations ended at $809 million ($901 million opening balance + $2,143 million confirmed invoices - $2,231 million paid invoices - $4 million FX impact).
Table Effective Tax Rate (ETR) Reconciliation Analysis (FY2026)
| Effective Tax Rate (ETR) Reconciliation | Pre-Tax Income / Tax Amount ($M) | % Effective Tax Rate |
| UK Statutory Tax Rate Base | $1,282M / $320M | 25.0% |
| US Cross-Border & Loss Rules | $(90)M | (7.0)% |
| US Tax Credits & Items | $(34)M | (2.6)% |
| Australia Valuation Allowances & Items | $(24)M | (1.8)% |
| Unrecognized Tax Benefits & Misc | $(25)M | (2.1)% |
| Consolidated Income Tax Expense | $181M | 14.1% |
Unrecognized Tax Benefits (UTBs) totaled $212 million (100% favorably impacts ETR if recognized) with $45 million in accrued interest/penalties. Deferred tax liabilities recorded on undistributed foreign earnings totaled $110 million.
Intangible assets and goodwill total $18,663 million (50.3% of total assets), comprising $12,075 million in goodwill ($6,019 million Flexible, $6,056 million Rigid) and $6,588 million in finite-lived intangibles ($6,102 million net customer relationships [16-year useful life], $118 million software, $368 million trademarks). Annual impairment testing on April 1 confirmed zero goodwill write-downs.
Restructuring liabilities ended at $116 million ($105 million employee severance, $11 million exit costs). The Berry Plan targets $650 million in annualized pre-tax synergies by June 30, 2028 ($530 million cost, $60 million financial, $60 million growth) on a $280 million net pre-tax cash restructuring budget ($208 million cumulative recognized charges, $107 million cash paid) and $100 million in general integration expenses ($84 million paid).
Table Operational Risk Exposure and Financial Sensitivity Analysis
| Operational Risk & Sensitivity Parameter | Quantitative Exposure & Financial Sensitivity |
| Raw Material Volatility | -$85M pre-tax income per 1% unrecovered commodity cost increase. |
| Foreign Exchange Sensitivity | -$49M Net Sales per 1% adverse move in Euro functional currency. |
| Interest Rate Yield Curve | -$20M pre-tax income per 1% interest rate increase on 15% floating debt. |
| Environmental Cleanup Liabilities |
10M Superfund PRP, $59M worldwide PP&E sites). |
| Brazil Tax Litigation Exposure | $14M accrued; $27M unaccrued exposure; $38M posted collateral/deposits. |
| Workforce Union Contracts | 37% of ~75,000 employees unionized; 19% of contracts expire in 1 year. |
In May 2026, the Board approved a change in fiscal year-end from June 30 to December 31, effective for the transition period July 1, 2026 through December 31, 2026. Forward commitments for FY2027 include $216 million in CapEx, $1,200 million in non-cancellable purchase obligations ($260 million FY28, $190 million FY29, $80 million FY30, $10 million FY31), $582 million in acquired intangible amortization ($548 million FY28, $542 million FY29, $528 million FY30, $518 million FY31), and $65.1 million in defined benefit pension plan funding. R&D spend was $170 million (0.7% of sales) supported by ~1,500 R&D personnel and >5,000 active patents.
Amcor plc is governed by an 11-member Board of Directors (Graeme Liebelt, Non-Executive Chairman; Peter Konieczny, CEO; 9 independent non-executive directors). Incorporated under the laws of the Bailiwick of Jersey, corporate governance specifies the Royal Court of Jersey as the exclusive forum for derivative shareholder claims.
HDIN Institutional Verdict
Amcor plc's post-merger integration of Berry Global Group, Inc. presents a structural bifurcation between expanded financial scale and underlying volume contraction. Management's execution of the Berry Plan is visible in the 110 basis point expansion in gross margin (20.0%) and 220 basis point expansion in Global Rigid operating margin (11.0%), confirming that targeted procurement and G&A cost synergies are offsetting organic volume headwinds (-2.0%).
Earnings quality relies heavily on Non-GAAP adjustments—totaling $916 million on EBIT—primarily driven by $558 million in acquired intangible amortization and $266 million in restructuring costs. However, Operating Cash Flow of $2,151 million provides a 1.13x coverage ratio relative to Reported Operating Income ($1,899 million), demonstrating robust cash conversion.
Balance sheet leverage remains managed. Covenant leverage of 3.48x provides a 42 basis point cushion below the 3.90x bank covenant ceiling, while $377 million in divestiture proceeds ($298 million cash + $79 million ePac exit) were directed toward debt reduction. The main mid-term operational risks rest on raw material price lag recovery ($85 million sensitivity per 1% unrecovered inflation) and meeting PCR content mandates amid recycling supply constraints.
Presentation Download & Video Access
Presentation Download: Click the PDF download link under 'Related Topics' to access the full institutional presentation of this report.
Video Link: Click this link to watch the HDIN analyst briefing on YouTube.
About HDIN Research
HDIN Research is a premier global market intelligence and strategic advisory firm specializing in institutional-grade financial analysis, supply chain audits, and macroeconomic forecasting. Our dedicated sector analysts deliver actionable, data-driven insights tailored for private equity, hedge funds, and corporate strategy teams. Visit us at [http://www.hdinresearch.com](http://www.hdinresearch.com).
2026 AI Transparency Footer
This intelligence report was authored by HDIN Research analysts following a rigorous audit of official corporate filings. AI was utilized for massive-scale data synthesis and structural drafting, ensuring 100% inclusion of reported data points. All strategic insights, financial modeling, and final verdicts were verified by our editorial board to ensure professional accuracy and compliance with 2026 Google Search E-E-A-T standards.