Coherent Corp.: Vertical Integration and AI Transceiver Surge Near Sherman Fab Drive Margin Expansion as $2.0 Billion NVIDIA Partnership Signals Capital Structural Re-alignment
Date : 2026-08-17
Reading : 932
HDIN Executive Takeaways
1. Coherent Corp. [NYSE: COHR] achieved a 22.51% revenue increase to $7,118.18 million in FY26, driven by a 40.46% surge in Datacenter & Communications to $5,274.63 million amid hyperscaler 800G/1.6T AI transceiver deployment.
2. A $2.0 billion equity placement from NVIDIA Corp. [NASDAQ: NVDA] and $1.0 billion in minority investments from Denso Corp. and Mitsubishi Electric Corp. catalyzed $1.72 billion in debt prepayments, cutting net leverage to 0.89x Operating EBITDA.
3. Operational cash flow collapsed 87.45% to $79.51 million in FY26 due to an $1,183.00 million inventory drain, while $3.1 billion in Lasers unit goodwill maintains an 8% valuation headroom.
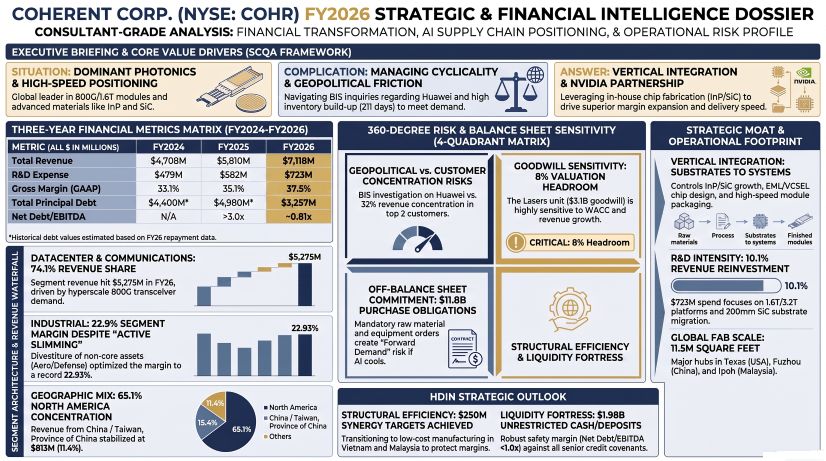
Figure Coherent Corp. Strategic & Financial Intelligence Dossier
 Segmental Realities and Financial Structural Pivot
Effective July 1, 2025, Coherent Corp. consolidated its legacy three-segment structure (Networking, Materials, Lasers) into two reportable market segments: Datacenter & Communications and Industrial. In FY26, Datacenter & Communications generated $5,274.63 million (74.10% of consolidated net revenues), up from $3,755.16 million in FY25 and $2,631.37 million in FY24, reflecting a three-year compound annual growth rate (CAGR) of 41.58%. Segment profit reached $1,329.72 million (25.21% segment margin), up 114 basis points year-over-year.
Conversely, the Industrial segment contracted 10.29% year-over-year to $1,843.55 million in FY26, down from $2,054.95 million in FY25 and $2,076.32 million in FY24, registering a three-year CAGR of -5.77%. This contraction was driven by the divestiture of the Aerospace & Defense business on September 2, 2025, for $400.00 million (generating a $124.10 million total business gain) and the sale of the Munich precision tools division on January 30, 2026 (recording a cumulative $96.00 million loss). Despite top-line contraction, Industrial segment profit expanded 310 basis points in FY26 to $422.77 million (22.93% segment margin).
Table Consolidated Financial Performance and Operating Metrics Analysis (FY2024–FY2026)
GAAP net income reached $805.00 million ($786.88 million attributable to Coherent Corp.), recovering from a net loss of $156.15 million in FY24. Adjusted Non-GAAP net income expanded to $1,288.88 million ($6.60 per diluted share). R&D expenditure reached $723.00 million (10.16% of revenue), expensed entirely under U.S. GAAP, while generating $216.00 million in deferred tax assets under Internal Revenue Code Section 174 capitalization.
Operating cash flow dropped 87.45% to $79.51 million in FY26 due to an $1,102.17 million working capital drain. Inventories expanded 79.53% to $2,581.04 million ($660.49 million raw materials, $1,556.96 million work-in-progress, $363.60 million finished goods), driving Days Inventory Outstanding (DIO) from 139.31 days in FY25 to 211.74 days in FY26. Accounts receivable reached $1,343.28 million (DSO of 68.88 days), impacted by customer concentration: Customer 1 generated $1,423.64 million (20% of revenue) and Customer 2 generated $854.18 million (12% of revenue), representing a combined 32% top-line exposure.
Table Capital Structure, Debt Profile, and Liquidity Position Analysis (FY2025–FY2026)
Floating debt accounts for $2,253.42 million (69.18% of principal), protected by a $1.50 billion notional interest rate cap capping 1-month SOFR at 1.92%, which reduced FY26 interest expense by $17.00 million. In Q2 FY26, $2.50 billion in Series B-1 and B-2 Preferred Stock converted into 30.10 million common shares. Debt amortization requires $7.92 million in FY27, $34.38 million in FY28, $93.63 million in FY29, $2,135.63 million in FY30, and $985.94 million in FY31. Under covenant testing, Total Net Leverage stands at 0.89x Operating EBITDA (ceiling 4.25x) and Interest Coverage stands at 7.46x (floor 2.50x). On August 12, 2026, a foreign subsidiary signed an undrawn $945.00 million 36-month local credit facility.
Global Industrial Footprint and Supply Chain Infrastructure
Coherent Corp. operates over 11.50 million square feet of facility area across North America, Europe, and Asia-Pacific. Fabrication of 6-inch Indium Phosphide (InP) lasers and Gallium Arsenide (GaAs) VCSEL wafers is anchored at its 700,000 square foot owned facility in Sherman, Texas, supported by $50.00 million in preliminary CHIPS Act terms and $80.00 million in cumulative Section 48D Advanced Manufacturing Investment Tax Credits ($41.00 million in FY25, $39.00 million in FY26).
Table Global Manufacturing Footprint and Operational Facility Network Overview
The company holds 3,160 granted patents and 1,280 pending applications globally, with $904.40 million in net developed technology intangibles (weighted average remaining life of 9.1 years) and $1,550.08 million in customer lists (remaining life of 10.6 years). Annual intangible amortization was $280.33 million in FY26, projected at $277.30 million in FY27, $242.60 million in FY28, $274.00 million in FY29, $251.90 million in FY30, and $240.40 million in FY31.
Geographic distribution shows North America expanding to $4,633.70 million (65.10% of total sales). China / Taiwan, Province of China generated $813.38 million (11.43% share; long-lived assets in Taiwan province stood at $4.27 million).
Supply chain risks include raw material dependencies on Yttrium, Germanium, Gallium, and Bismuth Telluride ($Bi_2Te_3$), exposed to Chinese export restrictions implemented in 2024. Off-balance sheet purchase commitments total $11.80 billion ($3.40 billion due in FY27). Non-cancellable operating lease obligations stand at $374.51 million ($316.21 million present value), and finance lease obligations total $16.56 million ($14.23 million present value). Supply chain financing programs cleared $104.00 million in invoices in FY26, with an ending payable balance of $27.00 million.
Tax holiday expirations occurred in FY26 across Singapore, Malaysia, the Philippines, and Vietnam (where SiC and Dong Nai sites transitioned from 100% tax exemption to a 50% partial exemption through June 30, 2030), raising cash tax payments to $208.10 million. In regulatory matters, the company received an inquiry in January 2025 from the U.S. Bureau of Industry and Security (BIS) regarding historical sales to Huawei Technologies Co. Ltd. Coherent Corp. stopped shipments to Huawei and initiated an internal review; no loss reserve has been recorded as the potential loss range remains unestimable. Following a February 20, 2026 U.S. Supreme Court ruling on IEEPA tariffs, the company recorded a tariff refund receivable in Q4 FY26.
HDIN Institutional Verdict
Under Chief Executive Officer Jim Anderson (appointed June 3, 2024) and Chief Financial Officer Sherri Luther (appointed September 2024), Coherent Corp. completed its $250.00 million multi-year merger synergy plan and executed multi-year cost reductions across its 2023 and 2025 Restructuring Plans ($370.00 million cumulative pretax charges). Pretax restructuring charges were $63.40 million in FY26 ($62.00 million under the 2025 Plan, $1.00 million under the 2023 Plan). Ending restructuring accruals stand at $44.54 million for the 2025 Plan and $28.58 million for the 2023 Plan.
The executive team's capital deployment strategy has successfully addressed long-term debt liabilities, but asset-side risks remain. Total goodwill stands at $4,375.60 million ($1,150.40 million in Datacenter & Communications, $3,225.20 million in Industrial). Ernst & Young LLP identified a Critical Audit Matter (CAM) regarding the Lasers reporting unit, which carries $3.10 billion in goodwill. The annual quantitative test on April 1, 2026, calculated that the unit's fair value exceeded its carrying value by 8% under an 11.0% WACC discount rate model.
While DuPont analysis highlights an ROE recovery to 7.38% (9.73% on average equity) and an ROIC expansion to 6.66% driven by net profit margin expansion to 11.31%, Asset Turnover remained flat at 0.389x. Negative Free Cash Flow of -$1,023.40 million in FY26 demonstrates that capital tie-ups in inventory and CapEx ($1,102.91 million) must yield higher asset utilization in FY27 to prevent potential goodwill impairments in the Industrial segment.
Presentation Download & Video Access:
- Presentation Download: Click the PDF download link under 'Related Topics' to access the full institutional presentation of this report.
- Video Link: Click this link to watch the HDIN analyst briefing on YouTube.
About HDIN Research:
HDIN Research is a premier global market intelligence and strategic advisory firm specializing in institutional-grade financial analysis, supply chain audits, and macroeconomic forecasting. Our dedicated sector analysts deliver actionable, data-driven insights tailored for private equity, hedge funds, and corporate strategy teams. Visit us at http://www.hdinresearch.com.
2026 AI Transparency Footer:
This intelligence report was authored by HDIN Research analysts following a rigorous audit of official corporate filings. AI was utilized for massive-scale data synthesis and structural drafting, ensuring 100% inclusion of reported data points. All strategic insights, financial modeling, and final verdicts were verified by our editorial board to ensure professional accuracy and compliance with 2026 Google Search E-E-A-T standards.
1. Coherent Corp. [NYSE: COHR] achieved a 22.51% revenue increase to $7,118.18 million in FY26, driven by a 40.46% surge in Datacenter & Communications to $5,274.63 million amid hyperscaler 800G/1.6T AI transceiver deployment.
2. A $2.0 billion equity placement from NVIDIA Corp. [NASDAQ: NVDA] and $1.0 billion in minority investments from Denso Corp. and Mitsubishi Electric Corp. catalyzed $1.72 billion in debt prepayments, cutting net leverage to 0.89x Operating EBITDA.
3. Operational cash flow collapsed 87.45% to $79.51 million in FY26 due to an $1,183.00 million inventory drain, while $3.1 billion in Lasers unit goodwill maintains an 8% valuation headroom.
Figure Coherent Corp. Strategic & Financial Intelligence Dossier
Segmental Realities and Financial Structural PivotEffective July 1, 2025, Coherent Corp. consolidated its legacy three-segment structure (Networking, Materials, Lasers) into two reportable market segments: Datacenter & Communications and Industrial. In FY26, Datacenter & Communications generated $5,274.63 million (74.10% of consolidated net revenues), up from $3,755.16 million in FY25 and $2,631.37 million in FY24, reflecting a three-year compound annual growth rate (CAGR) of 41.58%. Segment profit reached $1,329.72 million (25.21% segment margin), up 114 basis points year-over-year.
Conversely, the Industrial segment contracted 10.29% year-over-year to $1,843.55 million in FY26, down from $2,054.95 million in FY25 and $2,076.32 million in FY24, registering a three-year CAGR of -5.77%. This contraction was driven by the divestiture of the Aerospace & Defense business on September 2, 2025, for $400.00 million (generating a $124.10 million total business gain) and the sale of the Munich precision tools division on January 30, 2026 (recording a cumulative $96.00 million loss). Despite top-line contraction, Industrial segment profit expanded 310 basis points in FY26 to $422.77 million (22.93% segment margin).
Table Consolidated Financial Performance and Operating Metrics Analysis (FY2024–FY2026)
| Financial & Operating Metric | FY2024 | FY2025 | FY2026 | YoY (FY26) | 3-Year CAGR |
| Consolidated Revenue | $4,707.69M | $5,810.12M | $7,118.18M | +22.51% | +22.96% |
| Datacenter & Communications Revenue | $2,631.37M | $3,755.16M | $5,274.63M | +40.46% | +41.58% |
| Industrial Revenue | $2,076.32M | $2,054.95M | $1,843.55M | -10.29% | -5.77% |
| Gross Profit | $1,455.96M | $2,043.32M | $2,669.04M | +30.62% | +35.40% |
| Gross Margin (%) | 30.93% | 35.17% | 37.50% | +233 bps | +312 bps/yr |
| GAAP Operating Income (EBIT) | $96.12M | $289.88M | $897.86M | +209.74% | +205.63% |
| Operating EBITDA | $655.88M | $843.48M | $1,419.76M | +68.32% | +47.13% |
| GAAP Consolidated Net Earnings | ($158.76M) | $30.06M | $786.88M | +2,517.97% | N/A |
| Adjusted Non-GAAP Net Income | $365.77M | $796.43M | $1,288.88M | +61.83% | +87.71% |
| GAAP Diluted EPS | ($1.84) | ($0.52) | $4.12 | Turned Prof. | N/A |
| Adjusted Non-GAAP EPS | $2.41 | $5.15 | $6.60 | +28.16% | +65.49% |
| Operating Cash Flow (OCF) | $545.73M | $633.60M | $79.51M | -87.45% | -61.81% |
| Capital Expenditures (CapEx) | $346.82M | $440.84M | $1,102.91M | +150.19% | +78.33% |
| Free Cash Flow (FCF) | $198.92M | $192.76M | ($1,023.40M) | -630.91% | N/A |
| Research & Development (R&D) Expense | $479.00M | $582.00M | $723.00M | +24.23% | +22.86% |
| R&D Expense as % of Revenue | 10.17% | 10.02% | 10.16% | +14 bps | -0.5 bps/yr |
GAAP net income reached $805.00 million ($786.88 million attributable to Coherent Corp.), recovering from a net loss of $156.15 million in FY24. Adjusted Non-GAAP net income expanded to $1,288.88 million ($6.60 per diluted share). R&D expenditure reached $723.00 million (10.16% of revenue), expensed entirely under U.S. GAAP, while generating $216.00 million in deferred tax assets under Internal Revenue Code Section 174 capitalization.
Operating cash flow dropped 87.45% to $79.51 million in FY26 due to an $1,102.17 million working capital drain. Inventories expanded 79.53% to $2,581.04 million ($660.49 million raw materials, $1,556.96 million work-in-progress, $363.60 million finished goods), driving Days Inventory Outstanding (DIO) from 139.31 days in FY25 to 211.74 days in FY26. Accounts receivable reached $1,343.28 million (DSO of 68.88 days), impacted by customer concentration: Customer 1 generated $1,423.64 million (20% of revenue) and Customer 2 generated $854.18 million (12% of revenue), representing a combined 32% top-line exposure.
Table Capital Structure, Debt Profile, and Liquidity Position Analysis (FY2025–FY2026)
| Capital & Debt Structure Component | FY2025 | FY2026 | Maturity Year | Interest Rate / Pricing Formula |
| Cash & Cash Equivalents | $909.20M | $1,162.02M | N/A | Liquid Cash Balances |
| Short-Term Time Deposits | $0.00M | $825.00M | < 1 Year | Time Deposits |
| Restricted Cash (Silicon Carbide LLC) | $604.00M | $604.00M | Restricted | Denso / Mitsubishi Capital |
| Term Loan A Facility | $1,180.00M | $1,140.63M | 2030 | Adj. SOFR + 1.25% to 2.25% (initially 1.50%) |
| Term Loan B Facility (Term B-3) | $1,580.00M | $1,080.00M | 2029 | Adj. SOFR (0.50% floor) + 1.75% |
| 5.000% Senior Notes | $990.00M | $990.00M | 2029 | Fixed 5.000% per annum |
| Other Credit Facilities / Loans | $25.00M | $46.86M | 2029–2030 | Local Benchmark / Fixed 1.550% |
| Gross Interest-Bearing Debt | $3,736.51M | $3,257.48M | Multi-Year | Weighted Average Rate: 5.00% (FY26) |
| Net Interest-Bearing Debt | $2,827.31M | $1,270.46M | N/A | Gross Debt less Cash & ST Deposits |
| Total Shareholders' Equity | $5,644.51M | $10,903.50M | N/A | Conversion of $2.5B Series B Preferred |
Floating debt accounts for $2,253.42 million (69.18% of principal), protected by a $1.50 billion notional interest rate cap capping 1-month SOFR at 1.92%, which reduced FY26 interest expense by $17.00 million. In Q2 FY26, $2.50 billion in Series B-1 and B-2 Preferred Stock converted into 30.10 million common shares. Debt amortization requires $7.92 million in FY27, $34.38 million in FY28, $93.63 million in FY29, $2,135.63 million in FY30, and $985.94 million in FY31. Under covenant testing, Total Net Leverage stands at 0.89x Operating EBITDA (ceiling 4.25x) and Interest Coverage stands at 7.46x (floor 2.50x). On August 12, 2026, a foreign subsidiary signed an undrawn $945.00 million 36-month local credit facility.
Global Industrial Footprint and Supply Chain Infrastructure
Coherent Corp. operates over 11.50 million square feet of facility area across North America, Europe, and Asia-Pacific. Fabrication of 6-inch Indium Phosphide (InP) lasers and Gallium Arsenide (GaAs) VCSEL wafers is anchored at its 700,000 square foot owned facility in Sherman, Texas, supported by $50.00 million in preliminary CHIPS Act terms and $80.00 million in cumulative Section 48D Advanced Manufacturing Investment Tax Credits ($41.00 million in FY25, $39.00 million in FY26).
Table Global Manufacturing Footprint and Operational Facility Network Overview
| Facility Location | Region | Area (Sq. Ft.) | Tenure | Primary Operational Focus |
| Fuzhou, Greater China Region | APAC | 5,850,654 | Owned/Leased | Optoelectronic packaging, assembly, APAC distribution |
| Ipoh, Malaysia | APAC | 1,163,732 | Owned | Optical transceiver sub-assembly & testing |
| Dong Nai, Vietnam | APAC | 1,153,428 | Owned/Leased | High-volume optical components & transceiver assembly |
| Munich, Germany | EMEA | 1,027,231 | Owned/Leased | Laser heads, precision optics, EMEA distribution |
| Sherman, Texas | North America | 700,000 | Owned | 6-inch InP and GaAs wafer fabs (CHIPS Act facility) |
| Calamba, Philippines | APAC | 458,846 | Leased | High-volume optics fabrication & passive assembly |
| Easton, Pennsylvania | North America | 281,000 | Leased | Advanced materials processing & optical R&D |
| Saxonburg, Pennsylvania | North America | 235,000 | Owned/Leased | Corporate HQ, engineered materials, ceramics |
| Santa Clara, California | North America | 199,993 | Owned | Precision laser systems manufacturing & R&D |
| Sedgefield, United Kingdom | EMEA | 188,000 | Owned/Leased | Optoelectronics & device fab (ex-Newton Aycliffe) |
| Seoul / Gyeonggi, South Korea | APAC | 162,121 | Owned/Leased | Application engineering & custom product development |
| Järfälla, Sweden | EMEA | 140,896 | Leased | InP laser diode epitaxial growth & wafer fab |
| Newark, Delaware | North America | 135,000 | Leased | Materials processing & reaction-bonded ceramics |
| Zurich, Switzerland | EMEA | 127,897 | Leased | High-performance micro-optics production |
| Tampere, Finland | EMEA | 124,948 | Leased | Specialized semiconductor laser diode fabrication |
| Fremont, California | North America | 121,556 | Leased | Transceiver engineering & component assembly |
The company holds 3,160 granted patents and 1,280 pending applications globally, with $904.40 million in net developed technology intangibles (weighted average remaining life of 9.1 years) and $1,550.08 million in customer lists (remaining life of 10.6 years). Annual intangible amortization was $280.33 million in FY26, projected at $277.30 million in FY27, $242.60 million in FY28, $274.00 million in FY29, $251.90 million in FY30, and $240.40 million in FY31.
Table Geographic Revenue Distribution and Growth by Region (FY2024–FY2026)
| Geographic Revenue Region | FY2024 Revenue | FY2024 Share | FY2025 Revenue | FY2025 Share | FY2026 Revenue | FY2026 Share | 3-Year CAGR |
| North America | $2,622.57M | 55.71% | $3,564.85M | 61.36% | $4,633.70M | 65.10% | +32.92% |
| China / Taiwan, Province of China | $621.92M | 13.21% | $680.11M | 11.71% | $813.38M | 11.43% | +14.36% |
| Europe | $714.28M | 15.17% | $698.80M | 12.03% | $814.18M | 11.44% | +6.76% |
| Japan | $340.86M | 7.24% | $390.61M | 6.72% | $390.37M | 5.48% | +7.02% |
| Rest of World | $408.06M | 8.67% | $475.75M | 8.19% | $466.56M | 6.55% | +6.93% |
| Consolidated Total | $4,707.69M | 100.00% | $5,810.12M | 100.00% | $7,118.18M | 100.00% | +22.96% |
Geographic distribution shows North America expanding to $4,633.70 million (65.10% of total sales). China / Taiwan, Province of China generated $813.38 million (11.43% share; long-lived assets in Taiwan province stood at $4.27 million).
Supply chain risks include raw material dependencies on Yttrium, Germanium, Gallium, and Bismuth Telluride ($Bi_2Te_3$), exposed to Chinese export restrictions implemented in 2024. Off-balance sheet purchase commitments total $11.80 billion ($3.40 billion due in FY27). Non-cancellable operating lease obligations stand at $374.51 million ($316.21 million present value), and finance lease obligations total $16.56 million ($14.23 million present value). Supply chain financing programs cleared $104.00 million in invoices in FY26, with an ending payable balance of $27.00 million.
Tax holiday expirations occurred in FY26 across Singapore, Malaysia, the Philippines, and Vietnam (where SiC and Dong Nai sites transitioned from 100% tax exemption to a 50% partial exemption through June 30, 2030), raising cash tax payments to $208.10 million. In regulatory matters, the company received an inquiry in January 2025 from the U.S. Bureau of Industry and Security (BIS) regarding historical sales to Huawei Technologies Co. Ltd. Coherent Corp. stopped shipments to Huawei and initiated an internal review; no loss reserve has been recorded as the potential loss range remains unestimable. Following a February 20, 2026 U.S. Supreme Court ruling on IEEPA tariffs, the company recorded a tariff refund receivable in Q4 FY26.
HDIN Institutional Verdict
Under Chief Executive Officer Jim Anderson (appointed June 3, 2024) and Chief Financial Officer Sherri Luther (appointed September 2024), Coherent Corp. completed its $250.00 million multi-year merger synergy plan and executed multi-year cost reductions across its 2023 and 2025 Restructuring Plans ($370.00 million cumulative pretax charges). Pretax restructuring charges were $63.40 million in FY26 ($62.00 million under the 2025 Plan, $1.00 million under the 2023 Plan). Ending restructuring accruals stand at $44.54 million for the 2025 Plan and $28.58 million for the 2023 Plan.
The executive team's capital deployment strategy has successfully addressed long-term debt liabilities, but asset-side risks remain. Total goodwill stands at $4,375.60 million ($1,150.40 million in Datacenter & Communications, $3,225.20 million in Industrial). Ernst & Young LLP identified a Critical Audit Matter (CAM) regarding the Lasers reporting unit, which carries $3.10 billion in goodwill. The annual quantitative test on April 1, 2026, calculated that the unit's fair value exceeded its carrying value by 8% under an 11.0% WACC discount rate model.
While DuPont analysis highlights an ROE recovery to 7.38% (9.73% on average equity) and an ROIC expansion to 6.66% driven by net profit margin expansion to 11.31%, Asset Turnover remained flat at 0.389x. Negative Free Cash Flow of -$1,023.40 million in FY26 demonstrates that capital tie-ups in inventory and CapEx ($1,102.91 million) must yield higher asset utilization in FY27 to prevent potential goodwill impairments in the Industrial segment.
Presentation Download & Video Access:
- Presentation Download: Click the PDF download link under 'Related Topics' to access the full institutional presentation of this report.
- Video Link: Click this link to watch the HDIN analyst briefing on YouTube.
About HDIN Research:
HDIN Research is a premier global market intelligence and strategic advisory firm specializing in institutional-grade financial analysis, supply chain audits, and macroeconomic forecasting. Our dedicated sector analysts deliver actionable, data-driven insights tailored for private equity, hedge funds, and corporate strategy teams. Visit us at http://www.hdinresearch.com.
2026 AI Transparency Footer:
This intelligence report was authored by HDIN Research analysts following a rigorous audit of official corporate filings. AI was utilized for massive-scale data synthesis and structural drafting, ensuring 100% inclusion of reported data points. All strategic insights, financial modeling, and final verdicts were verified by our editorial board to ensure professional accuracy and compliance with 2026 Google Search E-E-A-T standards.