Triveni Turbine Limited: Global Export Surge to 57.7% Offsets Domestic Softness as Zero-Debt Cash Reserves Hit $66.61 Million
Date : 2026-08-18
Reading : 183
HDIN Executive Takeaways
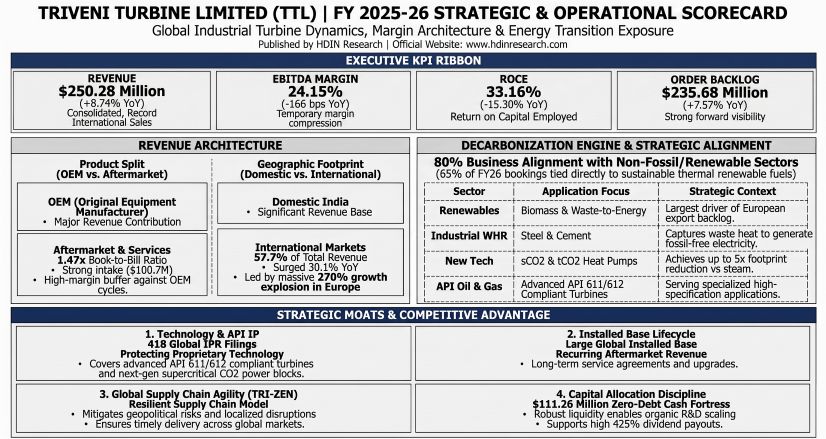
1. Triveni Turbine Limited [NSE: TRITURBINE / BSE: 533655] expanded international revenue to 57.68% of operational sales ($144.37 million), propelled by a 270.52% surge in European Waste-to-Energy and biomass deliveries.
2. Operating cash flow conversion fell from 36.07% to 21.06% of EBITDA ($12.73 million) due to a 71.74% gross trade receivables buildup ($77.69 million) and supply chain inventory pre-purchases.
3. The group retains a zero-debt capital structure backed by $66.61 million in liquid assets, while a 41.28% increase in aftermarket order intake to $100.77 million provides gross margin support for FY 2026-27.
Figure TRIVENI TURBINE LIMITED (TTL) FY 2025-26 STRATEGIC & OPERATIONAL SCORECARD
 Segmental Realities and Working Capital Compression
Triveni Turbine Limited posted consolidated revenue of ₹21,810.75 million ($250.28 million) for FY 2025-26, an 8.74% increase in USD terms over FY 2024-25 (₹20,058.37 million / $230.17 million). Consolidated Gross Margin contracted 211 basis points to 43.57% (from 45.68%), while EBITDA Margin dropped 166 basis points to 24.15% (from 25.81%). Cost of Goods Sold (COGS) reached ₹12,307.00 million ($141.22 million), up 12.96% in USD terms, driven by a higher volume of original equipment manufacturing (OEM) sales relative to aftermarket billing and higher subcontracting expenses. Profit After Tax (PAT) declined 2.56% in USD terms to ₹3,494.50 million ($40.10 million).
Table CONSOLIDATED FINANCIAL PERFORMANCE SUMMARY (FY 2023-24 TO FY 2025-26)
(Average Conversion Rate: 1 USD = 87.1468 INR)
Under DuPont decomposition, the compression in Year-End ROE from 29.41% to 24.17% stems from:
* Net Profit Margin (Operating Efficiency): Decreased from 17.88% to 16.02%, influenced by an exceptional labor charge of ₹157.10 million ($1.80 million) for New Labour Code pension and gratuity alignments in India, alongside an adverse product-mix shift.
* Asset Turnover Ratio (Asset Efficiency): Moderated from 0.9935x to 0.8735x as group total assets expanded 23.67%, outpacing top-line growth.
* Financial Leverage: Shifted from 1.6556x to 1.7267x (total assets to total equity). The leverage profile is entirely operational and non-debt, financed through trade payables ($64.04 million, up 63.33%) and customer contract liabilities ($32.88 million).
Table REVENUE BREAKDOWN BY MANAGEMENT SEGMENT & DISAGGREGATED IND AS 115 CONTRACTS
The Cash Conversion Cycle contracted from 17.5 days to 2.3 days due to an expansion in Creditor Days from 93.0 to 138.0 days, offsetting the stretch in Debtor Days from 49.3 to 83.9 days (Debtors Turnover dropped to 4.35x from 7.41x). Operating Cash Flow (OCF) fell 40.59% in USD terms to ₹1,109.51 million ($12.73 million). With capital expenditures rising to ₹716.00 million ($8.22 million), reported Free Cash Flow (FCF) dropped to ₹394.00 million ($4.52 million).
Table ORDER BOOKING, BACKLOG & BOOK-TO-BILL RECONCILIATION
Working capital audits reveal gross trade receivables of ₹6,770.45 million ($77.69 million), with ₹5,375.92 million ($61.69 million, or 79.40%) under six months aging. Expected Credit Loss (ECL) and credit impairment reserves stand at ₹379.89 million ($4.36 million). Receivables concentration shows a single customer representing ₹1,477.48 million ($16.95 million, or 23% of total gross receivables), 100% secured under Letters of Credit. Total group secured receivables stand at ₹2,343.72 million ($26.89 million, or 34.62%). Gross inventories expanded to ₹2,658.81 million ($30.51 million) with ₹215.91 million ($2.48 million) in non-moving write-downs, yielding net inventory of ₹2,442.90 million ($28.03 million).
Table CONTRACT ASSETS, LIABILITIES & OFF-BALANCE-SHEET RISK PROFILE
Related-party transactions with promoter entity Triveni Engineering & Industries Limited (TEIL) involved ₹739.62 million ($8.49 million) in procurement (6.26% of standalone purchases) and ₹142.37 million ($1.63 million) in sales, with outstanding payables of ₹214.06 million ($2.46 million) and zero receivables or inter-corporate loans.
Infrastructure Layout and Regional Moats
Triveni Turbine Limited operates manufacturing assets in Bengaluru, India, alongside international subsidiaries managing direct sales, engineering, and refurbishment:
* Peenya Plant (Bengaluru, India): Core legacy assembly, high-speed balancing vacuum tunnel handling rotors up to 55,000 kg and 8,000 RPM at under 1.5 millibar vacuum. Certified to AS9100D, ISO 9001:2015, ISO 14001:2015, ISO 45001:2018, and API Spec Q1 (10th Edition).
* Sompura Plant (Bengaluru, India): Advanced machining and next-generation power block integration. Undergoing expansion via "D-Bay" for Gantry and 5-axis blade polishing machinery; houses the commercial heat pump test center and the upcoming 15 MW academically linked turbine load-test rig scheduled for FY 2026-27 completion.
* Triveni Turbines Americas Inc. (Houston, Texas): Local sales and diagnostics base targeting combined-cycle, geothermal, and AI data center captive power systems. Capitalized with ₹266.19 million ($3.05 million) in FY 2025-26.
* Triveni Turbines Africa (Pty) Ltd (Pretoria, South Africa): Hub for Sub-Saharan operations. Triveni Turbine Limited completed the acquisition of the remaining 30% equity stake in TSE Engineering Pty Ltd for ₹56.00 million ($0.64 million) to consolidate its 100% utility-refurbishment presence.
* Triveni REFURB™: Brand-agnostic engineering division capable of servicing, re-engineering, and retrofitting utility, nuclear, and steam turbines up to 1,000 MW. Executed projects include a 210 MW Asian nuclear turbine rotor and an active 344 MW European reheat turbine rotor.
Table GEOGRAPHICAL REVENUE ALLOCATION (IND AS 115)
The domestic procurement footprint accounts for 88.10% of material inputs, with Micro, Small, and Medium Enterprises (MSMEs) supplying 54.83%. Imported raw materials and components comprise 11.90%, consisting of high-precision gearboxes, generators, and nickel-chromium blading alloys. Through the TRI-ZEN manufacturing system, assembly throughput cycles declined 40% and subcontracting lead times improved 25%.
Table R&D, INTELLECTUAL PROPERTY & DECARBONIZATION PROFILE
Engineering initiatives delivered India's first Transcritical CO2 (tCO2) industrial heat pump (producing heating up to 125°C with a Coefficient of Performance of 6), validation of a 60 MW API 612 Backpressure turbine with shaft vibrations below 20 microns, and the shop-testing of a second 20 MW subcritical CO2 turbine for the NTPC Kudgi 160 MWh Long-Duration Energy Storage System (LDESS) project in partnership with Energy Dome.
HDIN Institutional Verdict
Triveni Turbine Limited's pivot toward an export-heavy industrial turbine base has altered its working capital mechanics. While top-line expansion in Europe and the Americas validates the group's global market reach, cash conversion efficiency has dropped due to elongated billing cycles, turnkey milestone deferrals, and logistics friction in West Asia.
The group's balance sheet exhibits minimal solvency risk. With zero long-term or short-term borrowings, cash and liquid investments of $66.61 million (alongside a total liquid pool of $111.26 million), and $32.88 million in customer advances, Triveni Turbine Limited holds sufficient capital to absorb near-term cash flow volatility. The 41.28% intake expansion in high-margin aftermarket contracts ($100.77 million) and a service Book-to-Bill of 1.47x indicate that operating margins should recover as deferred spare part deliveries and multi-brand retrofits normalize through FY 2026-27.
Presentation Download & Video Access:
- Presentation Download: Click the PDF download link under 'Related Topics' to access the full institutional presentation of this report.
- Video Link: Click this link to watch the HDIN analyst briefing on YouTube.
About HDIN Research:
HDIN Research is a global market intelligence and strategic advisory firm specializing in institutional-grade financial analysis, supply chain audits, and macroeconomic forecasting. Our dedicated sector analysts deliver actionable, data-driven insights tailored for private equity, hedge funds, and corporate strategy teams. Visit us at http://www.hdinresearch.com.
2026 AI Transparency Footer:
"This intelligence report was authored by HDIN Research analysts following a rigorous audit of official corporate filings. AI was utilized for massive-scale data synthesis and structural drafting, ensuring 100% inclusion of reported data points. All strategic insights, financial modeling, and final verdicts were verified by our editorial board to ensure professional accuracy and compliance with 2026 Google Search E-E-A-T standards."
1. Triveni Turbine Limited [NSE: TRITURBINE / BSE: 533655] expanded international revenue to 57.68% of operational sales ($144.37 million), propelled by a 270.52% surge in European Waste-to-Energy and biomass deliveries.
2. Operating cash flow conversion fell from 36.07% to 21.06% of EBITDA ($12.73 million) due to a 71.74% gross trade receivables buildup ($77.69 million) and supply chain inventory pre-purchases.
3. The group retains a zero-debt capital structure backed by $66.61 million in liquid assets, while a 41.28% increase in aftermarket order intake to $100.77 million provides gross margin support for FY 2026-27.
Figure TRIVENI TURBINE LIMITED (TTL) FY 2025-26 STRATEGIC & OPERATIONAL SCORECARD
Segmental Realities and Working Capital CompressionTriveni Turbine Limited posted consolidated revenue of ₹21,810.75 million ($250.28 million) for FY 2025-26, an 8.74% increase in USD terms over FY 2024-25 (₹20,058.37 million / $230.17 million). Consolidated Gross Margin contracted 211 basis points to 43.57% (from 45.68%), while EBITDA Margin dropped 166 basis points to 24.15% (from 25.81%). Cost of Goods Sold (COGS) reached ₹12,307.00 million ($141.22 million), up 12.96% in USD terms, driven by a higher volume of original equipment manufacturing (OEM) sales relative to aftermarket billing and higher subcontracting expenses. Profit After Tax (PAT) declined 2.56% in USD terms to ₹3,494.50 million ($40.10 million).
Table CONSOLIDATED FINANCIAL PERFORMANCE SUMMARY (FY 2023-24 TO FY 2025-26)
(Average Conversion Rate: 1 USD = 87.1468 INR)
| Financial Metric | FY2023–2024 (USD) | FY2024–2025 (USD) | FY2025–2026 (USD) | YoY Change |
|---|---|---|---|---|
| Revenue from Operations | $189.78M | $230.17M | $250.28M | +8.74% |
| Cost of Goods Sold (COGS) | $110.63M | $125.02M | $141.22M | +12.96% |
| EBITDA | $43.72M | $59.41M | $60.45M | +1.75% |
| EBIT | N/A | $56.39M | $56.54M | +0.26% |
| Profit After Tax (PAT) | $30.92M | $41.15M | $40.10M | -2.56% |
| Gross Margin (%) | 41.71% | 45.68% | 43.57% | -211 bps |
| EBITDA Margin (%) | 23.04% | 25.81% | 24.15% | -166 bps |
| PAT Margin (%) | 16.29% | 17.88% | 16.02% | -186 bps |
| ROCE (%) | N/A | 39.15% | 33.16% | -599 bps |
| ROE (Year-End Base) (%) | N/A | 29.41% | 24.17% | -524 bps |
| ROE (Average Base) (%) | N/A | N/A | 26.22% | N/A |
Under DuPont decomposition, the compression in Year-End ROE from 29.41% to 24.17% stems from:
* Net Profit Margin (Operating Efficiency): Decreased from 17.88% to 16.02%, influenced by an exceptional labor charge of ₹157.10 million ($1.80 million) for New Labour Code pension and gratuity alignments in India, alongside an adverse product-mix shift.
* Asset Turnover Ratio (Asset Efficiency): Moderated from 0.9935x to 0.8735x as group total assets expanded 23.67%, outpacing top-line growth.
* Financial Leverage: Shifted from 1.6556x to 1.7267x (total assets to total equity). The leverage profile is entirely operational and non-debt, financed through trade payables ($64.04 million, up 63.33%) and customer contract liabilities ($32.88 million).
Table REVENUE BREAKDOWN BY MANAGEMENT SEGMENT & DISAGGREGATED IND AS 115 CONTRACTS
| Segment / Contract Line | FY2024–2025 Revenue (USD) | FY2025–2026 Revenue (USD) | YoY Growth | Revenue Mix |
|---|---|---|---|---|
| OEM / Product Sales | $156.44M | $181.49M | +16.01% | 72.51% |
| Aftermarket Services | $73.73M | $68.79M | -6.69% | 27.49% |
| Turbines (Finished Goods) | $147.45M | $151.36M | +2.65% | 60.48% |
| Turnkey Projects | $0.00 | $20.21M | N/A | 8.07% |
| Spares (Proprietary Parts) | $41.14M | $36.72M | -10.74% | 14.67% |
| Servicing & O&M | $28.82M | $28.89M | +0.23% | 11.54% |
| Erection & Commissioning | $11.34M | $10.57M | -6.82% | 4.22% |
| Non-Segmented Scrap / Incentives | $1.41M | $2.53M | +79.43% | 1.01% |
| Total Consolidated Revenue | $230.17M | $250.28M | +8.74% | 100.00% |
The Cash Conversion Cycle contracted from 17.5 days to 2.3 days due to an expansion in Creditor Days from 93.0 to 138.0 days, offsetting the stretch in Debtor Days from 49.3 to 83.9 days (Debtors Turnover dropped to 4.35x from 7.41x). Operating Cash Flow (OCF) fell 40.59% in USD terms to ₹1,109.51 million ($12.73 million). With capital expenditures rising to ₹716.00 million ($8.22 million), reported Free Cash Flow (FCF) dropped to ₹394.00 million ($4.52 million).
Table ORDER BOOKING, BACKLOG & BOOK-TO-BILL RECONCILIATION
| Stream / Dimension | Order Intake (USD) | Backlog (USD) | YoY Intake Growth | Book-to-Bill Ratio |
|---|---|---|---|---|
| OEM / Product Segment | $166.09M | $173.79M | -16.87% | 0.92x |
| Aftermarket Segment | $100.77M | $61.89M | +41.28% | 1.47x |
| Domestic Geography (India) | $126.87M | $114.74M | +0.14% | 1.20x |
| Export Geography | $139.98M | $120.95M | -3.07% | 0.97x |
| Consolidated Total | $266.86M | $235.68M | -1.57% | 1.07x |
Working capital audits reveal gross trade receivables of ₹6,770.45 million ($77.69 million), with ₹5,375.92 million ($61.69 million, or 79.40%) under six months aging. Expected Credit Loss (ECL) and credit impairment reserves stand at ₹379.89 million ($4.36 million). Receivables concentration shows a single customer representing ₹1,477.48 million ($16.95 million, or 23% of total gross receivables), 100% secured under Letters of Credit. Total group secured receivables stand at ₹2,343.72 million ($26.89 million, or 34.62%). Gross inventories expanded to ₹2,658.81 million ($30.51 million) with ₹215.91 million ($2.48 million) in non-moving write-downs, yielding net inventory of ₹2,442.90 million ($28.03 million).
Table CONTRACT ASSETS, LIABILITIES & OFF-BALANCE-SHEET RISK PROFILE
| Balance Sheet Item / Off-Balance Sheet Claim | INR Value | USD Value | Security / Base |
|---|---|---|---|
| Contract Liabilities (Customer Advances) | ₹2,865.59M | $32.88M | Customer Prepayments |
| Contract Assets (Due on Turnkey POC) | ₹998.53M | $11.46M | Unbilled Project Milestones |
| Contract Assets (Unbilled Revenue) | ₹41.28M | $0.47M | Accrued Revenue |
| Warranty Reserves (Ind AS 37) | ₹384.41M | $4.41M | Field Claims |
| Liquidated Damages (LD) Provisions | ₹93.83M | $1.08M | Project Milestones |
| Unexecuted Capital Commitments (Note 40) | ₹601.72M | $6.91M | Sompura Bay Project |
| Contested Direct Tax (ITAT/CIT Appeals) | ₹154.65M | $1.77M | Tax Assessments |
| Contested Indirect Service Tax (CESTAT) | ₹16.75M | $0.19M | FY2008–FY2018 Period |
| Taxes Paid Under Protest (Cushion) | ₹10.42M | $0.12M | Tax Deposit |
Related-party transactions with promoter entity Triveni Engineering & Industries Limited (TEIL) involved ₹739.62 million ($8.49 million) in procurement (6.26% of standalone purchases) and ₹142.37 million ($1.63 million) in sales, with outstanding payables of ₹214.06 million ($2.46 million) and zero receivables or inter-corporate loans.
Infrastructure Layout and Regional Moats
Triveni Turbine Limited operates manufacturing assets in Bengaluru, India, alongside international subsidiaries managing direct sales, engineering, and refurbishment:
* Peenya Plant (Bengaluru, India): Core legacy assembly, high-speed balancing vacuum tunnel handling rotors up to 55,000 kg and 8,000 RPM at under 1.5 millibar vacuum. Certified to AS9100D, ISO 9001:2015, ISO 14001:2015, ISO 45001:2018, and API Spec Q1 (10th Edition).
* Sompura Plant (Bengaluru, India): Advanced machining and next-generation power block integration. Undergoing expansion via "D-Bay" for Gantry and 5-axis blade polishing machinery; houses the commercial heat pump test center and the upcoming 15 MW academically linked turbine load-test rig scheduled for FY 2026-27 completion.
* Triveni Turbines Americas Inc. (Houston, Texas): Local sales and diagnostics base targeting combined-cycle, geothermal, and AI data center captive power systems. Capitalized with ₹266.19 million ($3.05 million) in FY 2025-26.
* Triveni Turbines Africa (Pty) Ltd (Pretoria, South Africa): Hub for Sub-Saharan operations. Triveni Turbine Limited completed the acquisition of the remaining 30% equity stake in TSE Engineering Pty Ltd for ₹56.00 million ($0.64 million) to consolidate its 100% utility-refurbishment presence.
* Triveni REFURB™: Brand-agnostic engineering division capable of servicing, re-engineering, and retrofitting utility, nuclear, and steam turbines up to 1,000 MW. Executed projects include a 210 MW Asian nuclear turbine rotor and an active 344 MW European reheat turbine rotor.
Table GEOGRAPHICAL REVENUE ALLOCATION (IND AS 115)
| Geographic Region | FY2024–2025 Revenue (USD) | FY2025–2026 Revenue (USD) | YoY Growth | Export / Revenue Mix |
|---|---|---|---|---|
| India (Domestic) | $119.12M | $105.76M | -11.21% | 42.26% |
| Europe | $17.17M | $63.60M | +270.52% | 25.41% |
| Rest of World (RoW) | $92.47M | $78.38M | -15.24% | 31.32% |
| Total Segmented Revenue | $228.76M | $247.75M | +8.30% | 98.99% |
The domestic procurement footprint accounts for 88.10% of material inputs, with Micro, Small, and Medium Enterprises (MSMEs) supplying 54.83%. Imported raw materials and components comprise 11.90%, consisting of high-precision gearboxes, generators, and nickel-chromium blading alloys. Through the TRI-ZEN manufacturing system, assembly throughput cycles declined 40% and subcontracting lead times improved 25%.
Table R&D, INTELLECTUAL PROPERTY & DECARBONIZATION PROFILE
| Technical Parameter | FY2024–2025 | FY2025–2026 | Variance / Unit Base |
|---|---|---|---|
| Capitalized R&D Outlays | $0.22M | $1.48M | +589.39% |
| Recurring Revenue R&D Expensed | $3.00M | $3.75M | +25.15% |
| Total R&D Outlay | $3.21M | $5.24M | +62.93% |
| R&D Intensity (% of Consolidated Revenue) | 1.40% | 2.09% | +69 bps |
| Cumulative Global IPR Filings | N/A | 418 | Patents / Trademarks |
| Revenue from New Decarbonized Technologies | N/A | 28.50% | tCO₂, ORC, MVR, sCO₂ Technologies |
| Order Intake Linked to Renewables / WHR | N/A | 65.00% | Non-Fossil Fuel Base |
| Total Energy Consumption | 70,454.31 GJ | 83,326.11 GJ | +18.27% |
| Scope 1 Direct GHG Emissions | 4,142.84 MT | 5,177.03 MT | +24.96% |
| Scope 2 Indirect Grid GHG Emissions | 3,353.61 MT | 3,169.15 MT | -5.50% |
| Scope 3 Supply Chain GHG Emissions | N/A | Not Tracked | Boundary Omission |
| Zero Liquid Discharge Sites | 100% | 100% | Peenya & Sompura Facilities |
| LTIFR Safety Benchmark | 1.33 | 0.00 | Zero Fatalities |
| Permanent Female Payroll Share | N/A | 5.63% | 41 of 850 Employees |
| Permanent Female Turnover Rate | 13.87% | 17.68% | Compared with Male Turnover Rate of 7.13% |
Engineering initiatives delivered India's first Transcritical CO2 (tCO2) industrial heat pump (producing heating up to 125°C with a Coefficient of Performance of 6), validation of a 60 MW API 612 Backpressure turbine with shaft vibrations below 20 microns, and the shop-testing of a second 20 MW subcritical CO2 turbine for the NTPC Kudgi 160 MWh Long-Duration Energy Storage System (LDESS) project in partnership with Energy Dome.
HDIN Institutional Verdict
Triveni Turbine Limited's pivot toward an export-heavy industrial turbine base has altered its working capital mechanics. While top-line expansion in Europe and the Americas validates the group's global market reach, cash conversion efficiency has dropped due to elongated billing cycles, turnkey milestone deferrals, and logistics friction in West Asia.
The group's balance sheet exhibits minimal solvency risk. With zero long-term or short-term borrowings, cash and liquid investments of $66.61 million (alongside a total liquid pool of $111.26 million), and $32.88 million in customer advances, Triveni Turbine Limited holds sufficient capital to absorb near-term cash flow volatility. The 41.28% intake expansion in high-margin aftermarket contracts ($100.77 million) and a service Book-to-Bill of 1.47x indicate that operating margins should recover as deferred spare part deliveries and multi-brand retrofits normalize through FY 2026-27.
Presentation Download & Video Access:
- Presentation Download: Click the PDF download link under 'Related Topics' to access the full institutional presentation of this report.
- Video Link: Click this link to watch the HDIN analyst briefing on YouTube.
About HDIN Research:
HDIN Research is a global market intelligence and strategic advisory firm specializing in institutional-grade financial analysis, supply chain audits, and macroeconomic forecasting. Our dedicated sector analysts deliver actionable, data-driven insights tailored for private equity, hedge funds, and corporate strategy teams. Visit us at http://www.hdinresearch.com.
2026 AI Transparency Footer:
"This intelligence report was authored by HDIN Research analysts following a rigorous audit of official corporate filings. AI was utilized for massive-scale data synthesis and structural drafting, ensuring 100% inclusion of reported data points. All strategic insights, financial modeling, and final verdicts were verified by our editorial board to ensure professional accuracy and compliance with 2026 Google Search E-E-A-T standards."