Western Digital Corporation: Pure-Play Hard Disk Drive Realignment Delivers Structural Margin Expansion as Hyperscale Cloud Captures 88.94% of Total Revenue
Date : 2026-08-17
Reading : 636
HDIN Executive Takeaways
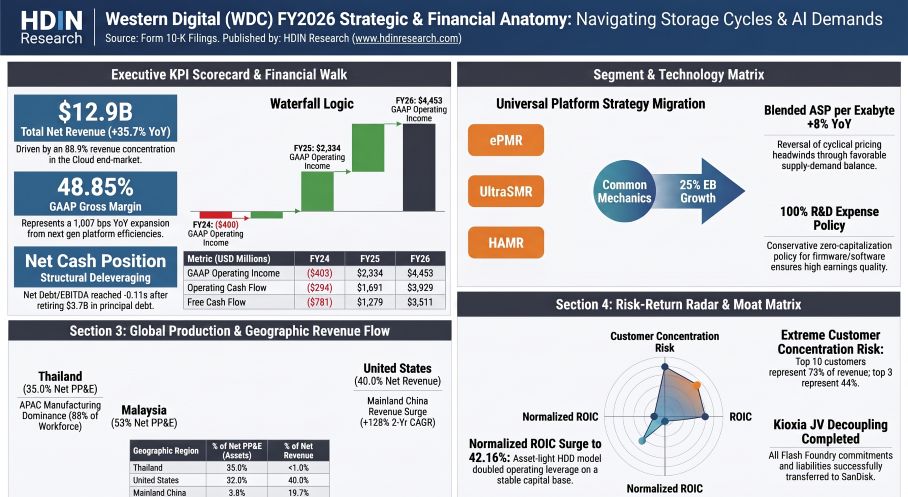
1. Western Digital completed the spin-off of its Flash business on February 21, 2025, distributing 80.1% of SanDisk Corporation shares and pivoting to a pure-play hard disk drive (HDD) manufacturer; continuing revenue expanded 35.70% year-over-year in FY26 to $12,919 million, with GAAP gross margin widening by 1,007 basis points to 48.85%.
2. Physical assets and assembly operations are concentrated across Southeast Asia, with Thailand and Malaysia housing 35.02% ($867 million) and 17.89% ($443 million) of total net PP&E ($2,476 million), while 88% of its 40,000 employees reside in the Asia-Pacific region.
3. Structural customer concentration reached critical thresholds in FY26, with the cloud end-market contributing 88.94% ($11,490 million) of continuing revenue, the top 10 customers generating 73.00%, and the top three accounts generating 44.00% (16%, 15%, and 13%).
Figure Western Digital (WDC) FY2026 Strategic & Financial Anatomy: Navigating Storage Cycles & Al Demands
 Operational Leverage and Segmental Dynamics Under Pure-Play Framework
Western Digital Corporation [NASDAQ: WDC] completed the structural separation of its Flash segment on February 21, 2025, through the distribution of 80.1% of SanDisk Corporation shares to stockholders, classifying Flash operations as Discontinued Operations. Continuing operations encompass its enterprise and commercial HDD business. In the fiscal year ended July 3, 2026 (FY26), the company achieved a GAAP operating turnaround, driven by cloud demand, product mix optimization across energy-assisted perpendicular magnetic recording (ePMR), OptiNAND, and UltraSMR platforms, and a consolidated average selling price (ASP) expansion of 8% per exabyte.
Table Financial Performance and Profitability Trends (FY2024–FY2026)
Adjusted Operating Income includes add-backs for Stock-Based Compensation ($204 million in FY26, $167 million in FY25, $202 million in FY24), Business Realignment Charges ($146 million in FY26, $(6) million in FY25, $209 million in FY24), Litigation Charges ($0 in FY26, $(198) million in FY25, $291 million in FY24), and Strategic Review Costs ($0 in FY26 and FY25, $38 million in FY24).
Consolidated exabytes sold grew 25% year-over-year in FY26, led by a 27% increase in cloud shipments, 3% growth in client, and 1% in consumer. Exabyte ASP expanded 8% in cloud, 26% in client, and 12% in consumer.
Table Revenue Breakdown by End Market and Growth Trends (FY2024–FY2026)
Geographic distribution highlights expanding shipments into Asian manufacturing hubs and Chinese cloud datacenters:
* United States: $5,169 million in FY26 (40.01% share; +39.90% 2-year CAGR) versus $4,328 million in FY25 and $2,636 million in FY24.
* Mainland China: $2,541 million in FY26 (19.67% share; +128.21% 2-year CAGR) versus $1,549 million in FY25 and $488 million in FY24.
* Europe, Middle East, & Africa: $2,114 million in FY26 (16.36% share; +40.75% 2-year CAGR) versus $1,536 million in FY25 and $1,067 million in FY24.
* Hong Kong SAR, China: $1,487 million in FY26 (11.51% share; +5.70% 2-year CAGR) versus $1,051 million in FY25 and $1,331 million in FY24.
* Rest of Asia: $1,095 million in FY26 (8.48% share; +38.24% 2-year CAGR) versus $792 million in FY25 and $573 million in FY24.
* Other (Rest of World): $513 million in FY26 (3.97% share; +51.98% 2-year CAGR) versus $264 million in FY25 and $222 million in FY24.
Structural Deleveraging and Asset Monetization Architecture
Western Digital monetized its initial 19.9% retained stake (28.8 million shares) in SanDisk Corporation across three transactions, exiting the position entirely by the close of FY26:
* June 2025: 21.3 million SanDisk shares exchanged to retire $800 million principal of Term Loan A-3.
* February 2026: 5.8 million SanDisk shares exchanged in a tax-free transaction to extinguish a $1.50 billion Bridge Loan (which consolidated Senior Notes) and the residual Term Loan A-3, incurring $539 million in transaction costs.
* Q4 FY26: 1.7 million residual SanDisk shares swapped via equity-for-equity exchanges to retire 4.8 million Western Digital common shares ($3.24 billion fair value), incurring a $254 million settlement cost.
Table Capital Structure and Leverage Position Analysis (FY2025–FY2026)
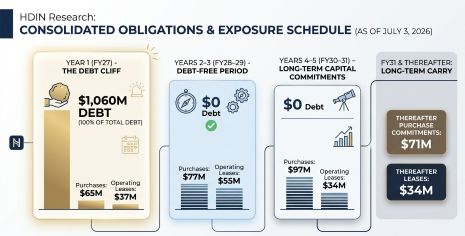
The remaining $1,060 million principal debt portfolio consists of $710 million in 3.00% Convertible Senior Notes due 2028 (triggered for conditional conversion with $343 million tendered and targeted for cash settlement) and $350 million drawn under the Revolving Credit Facility (5.127% variable rate, maturing January 2027), generating a weighted average nominal borrowing cost of 3.70%. The entire $1,060 million is classified under current liabilities as of July 3, 2026.
Capital allocations in FY26 directed $2,592 million to share repurchases and $184 million to cash dividends. R&D spending totaled $1,161 million (8.99% of revenue), expensed entirely as incurred with zero software capitalization on storage platforms. Normalized Return on Invested Capital (ROIC), applying a standard 21% tax rate against invested capital of $8,345 million, rose to 42.16% in FY26 from 22.56% on $8,174 million invested capital in FY25. Unadjusted GAAP ROIC was 50.69% in FY26.
Figure CONSOLIDATED OBLIGATIONS & EXPOSURE SCHEDULE (AS OF JULY 3, 2026)
Manufacturing Node Concentration and Supply Chain Architecture
Western Digital operates an internal head and media manufacturing framework. Physical fixed assets ($2,476 million net PP&E) are distributed across dedicated manufacturing and R&D facilities:
* Thailand: Bang Pa-In (1,595,000 sq. ft., manufacturing/R&D) and Prachinburi (1,568,000 sq. ft., manufacturing). Thailand holds $867 million in net PP&E (35.02% of total).
* United States: San Jose, California (1,957,000 sq. ft., headquarters/manufacturing/R&D) and Fremont, California (295,000 sq. ft., manufacturing/R&D). The U.S. holds $792 million in net PP&E (31.99% of total).
* Malaysia: Penang (1,192,000 sq. ft.), Johor Bahru (277,000 sq. ft.), and Kuching (638,000 sq. ft.). Malaysia holds $443 million in net PP&E (17.89% of total).
* Rest of Asia: Facilities include Laguna, Philippines (632,000 sq. ft.) and Fujisawa, Japan, holding $260 million in net PP&E (10.50% of total).
* Mainland China: Shenzhen assembly site (614,000 sq. ft.) holds $94 million in net PP&E (3.80% of total).
* EMEA: Regional infrastructure accounts for $20 million in net PP&E (0.81% of total).
All Kioxia flash foundry joint venture frameworks (Flash Partners, Flash Alliance, Flash Forward across Yokkaichi and Kitakami sites) along with the Shanghai SDSS assembly asset and Milpitas facility were transferred to SanDisk Corporation at separation, eliminating foundry-related capital calls.
HDIN Institutional Verdict
Western Digital’s reported FY26 GAAP net income of $9,424 million is distorted by a non-operating, non-taxable mark-to-market gain of $6,498 million on retained SanDisk shares, which accounted for 65.60% of pretax income ($9,905 million). With the SanDisk position fully liquidated, this tailwind terminates.
Core operating resilience is validated by $4,453 million in operating income and $3,511 million in free cash flow, yet institutional risk centers on customer concentration and fixed-cost exposure:
* Single-Client Exposure: Top three accounts generate 44.00% of net revenue, while the cloud segment accounts for 88.94%. The top two debtors represent 42.00% of outstanding accounts receivable (25% and 17%).
* Contract Rigidity: Long-Term Agreements (LTAs) lock pricing mechanisms, limiting spot pricing leverage during cyclical supply deficits while exposing margins to underutilization overhead charges and Net Realizable Value inventory write-downs if cloud capital expenditure slows. Finished goods inventories expanded 42.29% in FY26 to $397 million, compared to total inventory growth of 17.04% ($1,511 million).
* Tax and Legal Overhangs: The GAAP effective tax rate of 5% in FY26 faces normalization as the Malaysian tax holiday has expired and the primary Thailand incentive terminates on August 31, 2026, alongside the adoption of Pillar Two Global Minimum Tax rules. Concurrently, legal exposures remain unresolved, with the SPEX Technologies patent dispute subject to cross-appeals over a potential $553 million liability following an initial post-trial reduction to $1.
Presentation Download & Video Access:
- Presentation Download: Click the PDF download link under 'Related Topics' to access the full institutional presentation of this report.
- Video Link: Click this link to watch the HDIN analyst briefing on YouTube.
About HDIN Research:
HDIN Research is a global market intelligence and strategic advisory firm specializing in institutional-grade financial analysis, supply chain audits, and macroeconomic forecasting. Our sector analysts deliver data-driven insights tailored for private equity, hedge funds, and corporate strategy teams. Visit us at http://www.hdinresearch.com.
2026 AI Transparency Footer:
"This intelligence report was authored by HDIN Research analysts following a rigorous audit of official corporate filings. AI was utilized for massive-scale data synthesis and structural drafting, ensuring 100% inclusion of reported data points. All strategic insights, financial modeling, and final verdicts were verified by our editorial board to ensure professional accuracy and compliance with 2026 Google Search E-E-A-T standards."
1. Western Digital completed the spin-off of its Flash business on February 21, 2025, distributing 80.1% of SanDisk Corporation shares and pivoting to a pure-play hard disk drive (HDD) manufacturer; continuing revenue expanded 35.70% year-over-year in FY26 to $12,919 million, with GAAP gross margin widening by 1,007 basis points to 48.85%.
2. Physical assets and assembly operations are concentrated across Southeast Asia, with Thailand and Malaysia housing 35.02% ($867 million) and 17.89% ($443 million) of total net PP&E ($2,476 million), while 88% of its 40,000 employees reside in the Asia-Pacific region.
3. Structural customer concentration reached critical thresholds in FY26, with the cloud end-market contributing 88.94% ($11,490 million) of continuing revenue, the top 10 customers generating 73.00%, and the top three accounts generating 44.00% (16%, 15%, and 13%).
Figure Western Digital (WDC) FY2026 Strategic & Financial Anatomy: Navigating Storage Cycles & Al Demands
Operational Leverage and Segmental Dynamics Under Pure-Play FrameworkWestern Digital Corporation [NASDAQ: WDC] completed the structural separation of its Flash segment on February 21, 2025, through the distribution of 80.1% of SanDisk Corporation shares to stockholders, classifying Flash operations as Discontinued Operations. Continuing operations encompass its enterprise and commercial HDD business. In the fiscal year ended July 3, 2026 (FY26), the company achieved a GAAP operating turnaround, driven by cloud demand, product mix optimization across energy-assisted perpendicular magnetic recording (ePMR), OptiNAND, and UltraSMR platforms, and a consolidated average selling price (ASP) expansion of 8% per exabyte.
Table Financial Performance and Profitability Trends (FY2024–FY2026)
| Core Financial Metric (USD in Millions) | FY24 | FY25 | FY26 | YoY (FY26) | 2-Year CAGR |
| Net Revenue | $6,317 | $9,520 | $12,919 | +35.70% | +43.01% |
| Gross Profit | $1,773 | $3,692 | $6,311 | +70.94% | +88.67% |
| GAAP Gross Margin % | 28.07% | 38.78% | 48.85% | +1,007 bps | N/A |
| GAAP Operating Income (Loss) | $(403) | $2,334 | $4,453 | +90.79% | Turnaround |
| Adjusted Operating Income (Non-GAAP) | $337 | $2,297 | $4,803 | +109.10% | +277.52% |
| GAAP Net Income (Loss) | $(765) | $1,643 | $9,424 | +473.58% | Turnaround |
| Operating Cash Flow (OCF) | $(294) | $1,691 | $3,929 | +132.35% | Turnaround |
| Capital Expenditures (CapEx) | $487 | $412 | $418 | +1.46% | -7.35% |
| Free Cash Flow (FCF) | $(781) | $1,279 | $3,511 | +174.51% | Turnaround |
| Operating EBITDA | $165 | $2,785 | $4,828 | +73.36% | +440.93% |
Adjusted Operating Income includes add-backs for Stock-Based Compensation ($204 million in FY26, $167 million in FY25, $202 million in FY24), Business Realignment Charges ($146 million in FY26, $(6) million in FY25, $209 million in FY24), Litigation Charges ($0 in FY26, $(198) million in FY25, $291 million in FY24), and Strategic Review Costs ($0 in FY26 and FY25, $38 million in FY24).
Consolidated exabytes sold grew 25% year-over-year in FY26, led by a 27% increase in cloud shipments, 3% growth in client, and 1% in consumer. Exabyte ASP expanded 8% in cloud, 26% in client, and 12% in consumer.
Table Revenue Breakdown by End Market and Growth Trends (FY2024–FY2026)
| End-Market Disaggregation (USD in Millions) | FY24 Revenue | FY24 Share | FY25 Revenue | FY25 Share | FY26 Revenue | FY26 Share | 2-Yr CAGR |
| Cloud | $5,052 | 79.97% | $8,341 | 87.62% | $11,490 | 88.94% | +50.77% |
| Client | $577 | 9.13% | $556 | 5.84% | $726 | 5.62% | +12.16% |
| Consumer | $688 | 10.89% | $623 | 6.54% | $703 | 5.44% | +1.08% |
| Total Continuing Revenue | $6,317 | 100.00% | $9,520 | 100.00% | $12,919 | 100.00% | +43.01% |
Geographic distribution highlights expanding shipments into Asian manufacturing hubs and Chinese cloud datacenters:
* United States: $5,169 million in FY26 (40.01% share; +39.90% 2-year CAGR) versus $4,328 million in FY25 and $2,636 million in FY24.
* Mainland China: $2,541 million in FY26 (19.67% share; +128.21% 2-year CAGR) versus $1,549 million in FY25 and $488 million in FY24.
* Europe, Middle East, & Africa: $2,114 million in FY26 (16.36% share; +40.75% 2-year CAGR) versus $1,536 million in FY25 and $1,067 million in FY24.
* Hong Kong SAR, China: $1,487 million in FY26 (11.51% share; +5.70% 2-year CAGR) versus $1,051 million in FY25 and $1,331 million in FY24.
* Rest of Asia: $1,095 million in FY26 (8.48% share; +38.24% 2-year CAGR) versus $792 million in FY25 and $573 million in FY24.
* Other (Rest of World): $513 million in FY26 (3.97% share; +51.98% 2-year CAGR) versus $264 million in FY25 and $222 million in FY24.
Structural Deleveraging and Asset Monetization Architecture
Western Digital monetized its initial 19.9% retained stake (28.8 million shares) in SanDisk Corporation across three transactions, exiting the position entirely by the close of FY26:
* June 2025: 21.3 million SanDisk shares exchanged to retire $800 million principal of Term Loan A-3.
* February 2026: 5.8 million SanDisk shares exchanged in a tax-free transaction to extinguish a $1.50 billion Bridge Loan (which consolidated Senior Notes) and the residual Term Loan A-3, incurring $539 million in transaction costs.
* Q4 FY26: 1.7 million residual SanDisk shares swapped via equity-for-equity exchanges to retire 4.8 million Western Digital common shares ($3.24 billion fair value), incurring a $254 million settlement cost.
Table Capital Structure and Leverage Position Analysis (FY2025–FY2026)
| Capital Structure Metric (USD in Millions) | June 27, 2025 | July 3, 2026 | Variance ($) | Variance (%) |
| Cash and Cash Equivalents | $2,114 | $1,579 | $(535) | -25.31% |
| Total Debt (Principal Outstanding) | $4,749 | $1,060 | $(3,689) | -77.68% |
| Net Debt | $2,635 | $(519) | $(3,154) | Net Cash |
| Net Debt / Operating EBITDA | +0.95x | -0.11x | -1.06x | N/A |
| GAAP Interest Coverage (EBIT / Interest) | 6.54x | 26.99x | +20.45x | +312.69% |
The remaining $1,060 million principal debt portfolio consists of $710 million in 3.00% Convertible Senior Notes due 2028 (triggered for conditional conversion with $343 million tendered and targeted for cash settlement) and $350 million drawn under the Revolving Credit Facility (5.127% variable rate, maturing January 2027), generating a weighted average nominal borrowing cost of 3.70%. The entire $1,060 million is classified under current liabilities as of July 3, 2026.
Capital allocations in FY26 directed $2,592 million to share repurchases and $184 million to cash dividends. R&D spending totaled $1,161 million (8.99% of revenue), expensed entirely as incurred with zero software capitalization on storage platforms. Normalized Return on Invested Capital (ROIC), applying a standard 21% tax rate against invested capital of $8,345 million, rose to 42.16% in FY26 from 22.56% on $8,174 million invested capital in FY25. Unadjusted GAAP ROIC was 50.69% in FY26.
Figure CONSOLIDATED OBLIGATIONS & EXPOSURE SCHEDULE (AS OF JULY 3, 2026)
Manufacturing Node Concentration and Supply Chain Architecture
Western Digital operates an internal head and media manufacturing framework. Physical fixed assets ($2,476 million net PP&E) are distributed across dedicated manufacturing and R&D facilities:
* Thailand: Bang Pa-In (1,595,000 sq. ft., manufacturing/R&D) and Prachinburi (1,568,000 sq. ft., manufacturing). Thailand holds $867 million in net PP&E (35.02% of total).
* United States: San Jose, California (1,957,000 sq. ft., headquarters/manufacturing/R&D) and Fremont, California (295,000 sq. ft., manufacturing/R&D). The U.S. holds $792 million in net PP&E (31.99% of total).
* Malaysia: Penang (1,192,000 sq. ft.), Johor Bahru (277,000 sq. ft.), and Kuching (638,000 sq. ft.). Malaysia holds $443 million in net PP&E (17.89% of total).
* Rest of Asia: Facilities include Laguna, Philippines (632,000 sq. ft.) and Fujisawa, Japan, holding $260 million in net PP&E (10.50% of total).
* Mainland China: Shenzhen assembly site (614,000 sq. ft.) holds $94 million in net PP&E (3.80% of total).
* EMEA: Regional infrastructure accounts for $20 million in net PP&E (0.81% of total).
All Kioxia flash foundry joint venture frameworks (Flash Partners, Flash Alliance, Flash Forward across Yokkaichi and Kitakami sites) along with the Shanghai SDSS assembly asset and Milpitas facility were transferred to SanDisk Corporation at separation, eliminating foundry-related capital calls.
HDIN Institutional Verdict
Western Digital’s reported FY26 GAAP net income of $9,424 million is distorted by a non-operating, non-taxable mark-to-market gain of $6,498 million on retained SanDisk shares, which accounted for 65.60% of pretax income ($9,905 million). With the SanDisk position fully liquidated, this tailwind terminates.
Core operating resilience is validated by $4,453 million in operating income and $3,511 million in free cash flow, yet institutional risk centers on customer concentration and fixed-cost exposure:
* Single-Client Exposure: Top three accounts generate 44.00% of net revenue, while the cloud segment accounts for 88.94%. The top two debtors represent 42.00% of outstanding accounts receivable (25% and 17%).
* Contract Rigidity: Long-Term Agreements (LTAs) lock pricing mechanisms, limiting spot pricing leverage during cyclical supply deficits while exposing margins to underutilization overhead charges and Net Realizable Value inventory write-downs if cloud capital expenditure slows. Finished goods inventories expanded 42.29% in FY26 to $397 million, compared to total inventory growth of 17.04% ($1,511 million).
* Tax and Legal Overhangs: The GAAP effective tax rate of 5% in FY26 faces normalization as the Malaysian tax holiday has expired and the primary Thailand incentive terminates on August 31, 2026, alongside the adoption of Pillar Two Global Minimum Tax rules. Concurrently, legal exposures remain unresolved, with the SPEX Technologies patent dispute subject to cross-appeals over a potential $553 million liability following an initial post-trial reduction to $1.
Presentation Download & Video Access:
- Presentation Download: Click the PDF download link under 'Related Topics' to access the full institutional presentation of this report.
- Video Link: Click this link to watch the HDIN analyst briefing on YouTube.
About HDIN Research:
HDIN Research is a global market intelligence and strategic advisory firm specializing in institutional-grade financial analysis, supply chain audits, and macroeconomic forecasting. Our sector analysts deliver data-driven insights tailored for private equity, hedge funds, and corporate strategy teams. Visit us at http://www.hdinresearch.com.
2026 AI Transparency Footer:
"This intelligence report was authored by HDIN Research analysts following a rigorous audit of official corporate filings. AI was utilized for massive-scale data synthesis and structural drafting, ensuring 100% inclusion of reported data points. All strategic insights, financial modeling, and final verdicts were verified by our editorial board to ensure professional accuracy and compliance with 2026 Google Search E-E-A-T standards."