Tapestry, Inc.: Coach Outperformance and Working Capital Optimization Drive FY26 Free Cash Flow to $1.81 Billion Post-Capri Realignment
Date : 2026-08-20
Reading : 108
HDIN Executive Takeaways
1. Tapestry, Inc. [NYSE: TPR] expanded consolidated FY26 net sales by 14.2% to $8,004.2 million, as Coach generated $6,914.7 million (86.4% of total revenue) to offset a 10.2% top-line contraction at Kate Spade ($1,074.9 million).
2. Treasury execution improved the Cash Conversion Cycle by 37.2 days to 61.0 days, leveraging a $318.4 million Supplier Finance Program to generate $1,812.5 million in Free Cash Flow and fund $1,554.6 million in FY26 cash share repurchases.
3. Balance sheet risk contracted post-Capri termination, lowering Debt-to-EBITDA leverage to 1.17x against a 4.00x covenant ceiling, though Kate Spade’s 30% impairment headroom cushion remains sensitive to trade policy volatility.
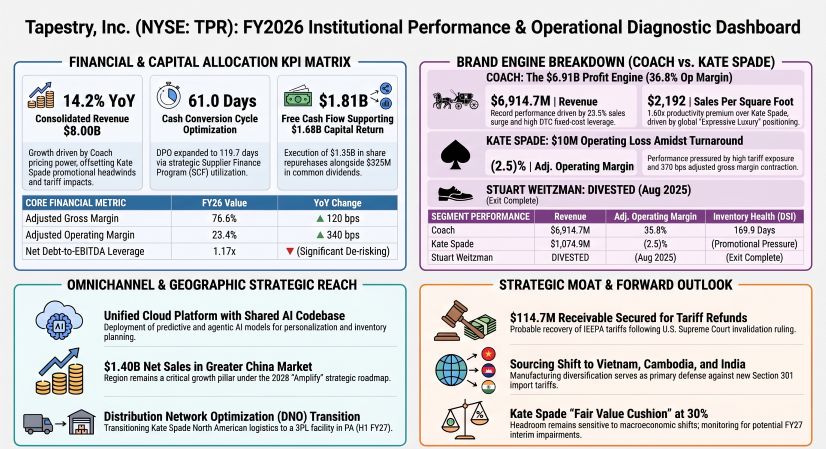
Figure Tapestry FY2026 nstitutional Performance & Operational Diagnostic Dashboard
 Segmental Realities, Margin Architecture, and Capital Allocation
Tapestry’s consolidated financial performance over the FY24–FY26 reporting period illustrates operational leverage anchored by its core brand, Coach, and the divestiture of non-core assets. In FY26, consolidated net sales grew 14.2% year-over-year to $8,004.2 million (a 16.7% expansion on a constant-currency basis excluding Stuart Weitzman). Adjusted operating income rose 33.3% to $1,865.8 million, achieving a 2-year Compound Annual Growth Rate (CAGR) of 27.9%, which outpaced the 2-year top-line revenue CAGR of 9.5% by 1,836 basis points.
Table Consolidated Financial Performance and Profitability Analysis (FY2024–FY2026)
Gross Margin Drivers and Cost Dissection
Consolidated adjusted gross margin expanded 120 basis points in FY26 to 76.6%. The drivers of this expansion include:
* Divestiture Accretion: The sale of Stuart Weitzman to Caleres, Inc. on August 4, 2025 (for an aggregate purchase price of $109.1 million in cash, generating a pre-tax GAAP loss of $22.0 million: $18.6 million in FY25 and $3.4 million in FY26, alongside $10.9 million in FY26 transaction/severance costs) structurally contributed +60 basis points to adjusted gross margins and +80 basis points to adjusted operating margins.
* Net Pricing and Product Mix: Average Unit Retail (AUR) expansion and premium brand mix contributed +60 basis points.
* Tariff Inflation Drag: Gross margin gains absorbed a 130 basis point tariff headwind resulting from the elimination of the direct-to-consumer *de minimis* exemption on August 29, 2025, combined with Section 301 tariffs (10.0% to 12.5%).
* IEEPA Settlement: GAAP gross margins included a $98.3 million pre-tax credit following the U.S. Supreme Court’s February 20, 2026, ruling invalidating certain International Emergency Economic Powers Act (IEEPA) tariffs. Tapestry collected $2.1 million in cash in Q4 FY26 ($2.0 million allocated to Cost of Sales and $0.1 million to SG&A) and recognized a $114.7 million probable receivable under Other Current Assets ($96.2 million reduction to Cost of Sales, $9.5 million to Accrued Liabilities, and $9.0 million reduction to capitalized inventory tariffs). This non-recurring item was excluded from Non-GAAP metrics.
Segment Disaggregation and Retail Unit Economics
Operational performance between Tapestry's reporting units showed distinct trajectories across store footprint productivity and profitability.
Table Brand Operational Performance and Retail Footprint Analysis (FY2024–FY2026)
*Includes $854.8M pre-tax impairment ($244.1M goodwill, $610.7M brand intangible).
Coach generated a $2,192 per-square-foot monetization profile (a 1.60x productivity multiple over Kate Spade's $1,374 per square foot). Coach expanded its network by 42 net doors (71.4% international), operating 4,855 average square-foot North American flagships and 2,391 square-foot international doors. Kate Spade closed 34 net doors (-9.4% footprint) to mitigate fixed-cost deleveraging.
Forensic SG&A Cost Disaggregation
Consolidated GAAP SG&A expenses fell 11.48% in FY26 to $4,314.6 million (53.90% of net sales) following the normalization of the FY25 $854.8 million Kate Spade impairment. Adjusted Non-GAAP SG&A contracted 210 basis points to 53.19% (or 53.3% rounded).
* Store and Selling Expenses: ~$2,243.6 million (52.0% of total SG&A).
* Marketing and Advertising: Reached $962.5 million (12.0% of net sales), up 29.3% from $744.5 million (~11.0% of net sales) in FY25.
* Corporate Overhead & Administrative: $908.2 million (21.0% of total SG&A), comprising Note 17 Corporate SG&A of $615.8 million (Non-GAAP: $583.5 million), share-based compensation of $107.4 million (up from $91.4 million in FY25 and $85.9 million in FY24), defined contribution 401(k) expenses of $13.6 million ($13.1 million in FY25), and total restructuring/efficiency items of $171.4 million.
* Distribution and Customer Logistics: $200.3 million (4.7% of total SG&A), based on gross outbound shipping and customer delivery expenses of $209.6 million ($222.0 million in FY25, $221.1 million in FY24) net of Transition Services Agreement logistics reimbursements.
* Impairment and Efficiency Adjustments: Non-cash store footprint impairments within SG&A fell to $7.8 million ($7.0 million store PP&E, $0.8 million operating lease ROU assets) from $8.8 million in FY25 ($5.8 million PP&E, $3.0 million ROU assets). Adjusted SG&A excluded $29.0 million in Organizational Efficiency Costs ($17.2 million in FY25), $9.8 million in Distribution Network Optimization (DNO) costs, and $18.6 million in acquisition/divestiture costs ($112.5 million in FY25).
Working Capital Optimization and Cash Flow Mechanics
Operating cash flow rose 62.6% to $1,978.5 million in FY26. With PP&E capital expenditures at $166.0 million ($122.7 million in FY25, $108.9 million in FY24), Free Cash Flow reached $1,812.5 million (a 122.3% Non-GAAP conversion rate).
Table Working Capital Efficiency, Cash Flow Conversion, and Balance Sheet Strength Analysis (FY2024–FY2026)
*Estimated FY24 carry value prior to Capri note redemption.
The Cash Conversion Cycle contracted by 37.2 days to 61.0 days. Inventory declined 4.0% to $826.2 million against a 14.2% top-line increase, improving inventory velocity (DSI down 12.6 days to 169.9 days; turnover up to 2.15x). Working capital management was driven by the voluntary Supplier Finance Program, which held $318.4 million in accounts payable at FY26 year-end, extending DPO by 23.0 days to 119.7 days. Valuation allowances against accounts receivable for wholesale customer markdowns fell to $10.4 million ($12.2 million in FY25), while inventory-related deferred tax assets stood at $15.4 million ($16.4 million in FY25).
Capital Execution and ASC 842 Capitalization Schedule
In FY26, total cash inflows of $2,087.6 million ($1,978.5 million operating cash flow plus $109.1 million Stuart Weitzman proceeds) funded capital outlays and capital distributions:
* Share Repurchases: $1,350.0 million open-market repurchases executed ($1,554.6 million in cash settlements), reducing the diluted share count to 200.4 million units (down 12.9% from 230.2 million in FY24). This followed a $2.02 billion Accelerated Share Repurchase (ASR) executed in FY25 out of the Board’s $3.00 billion authorization.
* Common Stock Dividends: Paid $326.1 million ($1.60 per share, representing a 22.0% Non-GAAP dividend payout ratio).
* Debt Service: Repaid $17.0 million in debt principal; long-term carrying debt stood at $2,379.0 million (principal: $2,396.6 million across the 4.125% 2027 Notes of $396.6 million, 5.100% 2030 Notes of $750.0 million, 3.050% 2032 Notes of $500.0 million, and 5.500% 2035 Notes of $750.0 million; less $15.9 million unamortized issue costs and $1.7 million fair value hedge adjustments). Fair value interest rate swaps hedged $375.0 million of the 2035 notes into floating SOFR.
* Undrawn Liquidity Facilities: $2.00 billion Amended Revolving Credit Facility (expiring May 22, 2030; SOFR/EURIBOR floating rate), $2.00 billion Commercial Paper Program, and RMB 250.0 million China Credit Facility ($34.78 million USD equivalent at 7.1875 CNY/USD exchange rate) were completely undrawn at fiscal year-end. Outstanding letters of credit and bank guarantees totaled $38.1 million ($26.5 million in FY25).
* Lease Commitments (ASC 842): Recorded $1,417.2 million in Operating Lease ROU Assets and $1,574.0 million in Lease Liabilities ($307.8 million current, $1,266.2 million non-current) across 1,299 operated retail stores, with a 7.4-year weighted average tenor and a 4.4% discount rate. Variable lease costs were $232.1 million (38.0% of total lease expenses). Sublease income recognized was $14.7 million in FY26 ($157.1 million contractual sublease receivables through FY32+).
Infrastructure Layout, Global Sourcing Networks, and Trade Governance
Tapestry operates an asset-light, multi-country supply chain architecture overseen by directly operated sourcing offices in Vietnam, mainland China, the Philippines, and Cambodia. Finished goods assembly is entirely outsourced, with no individual vendor accounting for 10% or more of total inventory purchases for either brand.
Distribution Network Optimization (DNO) and Real Estate Footprint
Tapestry's fulfillment infrastructure is undergoing geographic realignment:
* Pennsylvania Consolidation: Tapestry incurred $9.8 million in pre-tax DNO restructuring costs in FY26 to transition Kate Spade’s North American logistics from a 601,000 square-foot company-operated facility in Westchester, Ohio, to a specialized third-party facility in Pennsylvania, scheduled for completion in H1 FY27.
* North American Coach Nodes: The Coach brand maintains long-term company-operated fulfillment centers in Jacksonville, Florida (1,050,000 square feet; leased through FY37) and Las Vegas, Nevada (789,000 square feet; leased through FY37).
* International 3PL Infrastructure: Sourcing operations are supported by third-party facilities in Ontario, Canada (150,000 square feet; through FY37), Chiba, Japan (278,000 square feet; through FY37), and Shanghai, China (170,000 square feet; through FY37), alongside regional centers in the Netherlands, the United Kingdom, Singapore, South Korea, Malaysia, and Australia.
Table Global Logistics and Fulfillment Infrastructure Network Overview
Technology Assets, Digital Integration, and Forward Commitments
Tapestry operates a unified cloud platform with a shared codebase across e-commerce storefronts, Order Management Systems (OMS), Point of Sale (POS), Customer Service, and Enterprise Resource Planning (ERP). In FY26, total technology and capital outlays reached $217.1 million ($166.0 million in PP&E Capex and $51.1 million in cash cloud software implementation costs). Capitalized cloud computing implementations are amortized straight-line into SG&A over the contract term ($56.4 million in FY26, $62.0 million in FY25, $55.0 million in FY24).
Table Contractual Cash Outflow Profile and Forward Commitment Analysis (As of June 27, 2026)
The forward outlook includes definite-lived intangible amortization of $3.0 million annually through FY31 (6.0 years remaining life on customer relationships), $16.3 million in deferred net derivative gains in Accumulated Other Comprehensive Income (AOCI) to be reclassified as a reduction to FY27 Cost of Sales, and an adjusted Effective Tax Rate (ETR) expected to track the FY26 adjusted baseline of 18.2% (GAAP: 17.9%) under OECD Pillar Two QDMTT regulations. Tapestry holds $868.8 million in forward cash flow hedges and $1.82 billion in net investment hedges.
HDIN Institutional Verdict
Following the regulatory termination of the Capri Holdings acquisition on November 13, 2024—which incurred $45.1 million in reimbursed transaction expenses to Capri, a $119.4 million pre-tax debt extinguishment loss, $88.8 million in transaction SG&A, and $60.2 million in financing interest during FY25—Tapestry successfully realigned its capital allocation framework:
Table Institutional Scorecard: Management Execution and Strategic Performance Assessment
1. Core Asset Monetization: Coach generated $6.91 billion in revenue (86.4% of group sales) and delivered an adjusted operating margin of 35.8% (+230 basis points), demonstrating structural pricing power. This performance powered a 289.6% 5-year cumulative total stockholder return ($100 invested on July 3, 2021, reached $389.55 by June 27, 2026), compared to $57.50 for the S&P Composite 1500 Apparel, Accessories & Luxury Goods Index.
2. The Kate Spade Valuation Drag: Kate Spade remains an operational challenge, posting an adjusted operating loss of -$27.2 million (-2.5% margin) and a 370 basis point gross margin contraction due to markdown exposure and promotional channel dependence. While the FY26 annual impairment test indicated a 30% fair value cushion over carrying values ($381.9 million goodwill, $699.1 million brand trademark), this cushion remains vulnerable to tariff shifts or top-line weakness.
3. Unrecognized Contingencies: Tapestry carries $150.0 million in contingent tax liabilities ($115.7 million gross unrecognized tax benefits plus $34.3 million accrued interest/penalties, with $112.4 million directly affecting the effective tax rate), alongside ongoing putative securities class-action litigation in the U.S. District Court for the District of Delaware regarding Capri transaction disclosures (complaint dismissed without prejudice March 31, 2026; amended complaint filed April 30, 2026; motion to dismiss filed June 15, 2026). The valuation allowance against deferred tax assets contracted to $12.0 million ($17.6 million in FY25).
4. Shareholder Defense Constraints: Anti-takeover protections under the Maryland General Corporation Law (MGCL)—including supermajority two-thirds director removal voting rules, unilateral charter reclassification powers, five-year interested stockholder business combination moratoria, and the Board's unilateral authority to opt back into the Maryland Control Share Acquisition Act—concentrate strategic control within the Board of Directors, limiting external activist interventions.
Presentation Download & Video Access:
- Presentation Download: Click the PDF download link under 'Related Topics' to access the full institutional presentation of this report.
- Video Link: Click this link to watch the HDIN analyst briefing on YouTube.
About HDIN Research:
HDIN Research is a global market intelligence and strategic advisory firm specializing in institutional-grade financial analysis, supply chain audits, and macroeconomic forecasting. Our dedicated sector analysts deliver actionable, data-driven insights tailored for private equity, hedge funds, and corporate strategy teams. Visit us at http://www.hdinresearch.com.
2026 AI Transparency Footer:
"This intelligence report was authored by HDIN Research analysts following a rigorous audit of official corporate filings. AI was utilized for massive-scale data synthesis and structural drafting, ensuring 100% inclusion of reported data points. All strategic insights, financial modeling, and final verdicts were verified by our editorial board to ensure professional accuracy and compliance with 2026 Google Search E-E-A-T standards."
1. Tapestry, Inc. [NYSE: TPR] expanded consolidated FY26 net sales by 14.2% to $8,004.2 million, as Coach generated $6,914.7 million (86.4% of total revenue) to offset a 10.2% top-line contraction at Kate Spade ($1,074.9 million).
2. Treasury execution improved the Cash Conversion Cycle by 37.2 days to 61.0 days, leveraging a $318.4 million Supplier Finance Program to generate $1,812.5 million in Free Cash Flow and fund $1,554.6 million in FY26 cash share repurchases.
3. Balance sheet risk contracted post-Capri termination, lowering Debt-to-EBITDA leverage to 1.17x against a 4.00x covenant ceiling, though Kate Spade’s 30% impairment headroom cushion remains sensitive to trade policy volatility.
Figure Tapestry FY2026 nstitutional Performance & Operational Diagnostic Dashboard
Segmental Realities, Margin Architecture, and Capital AllocationTapestry’s consolidated financial performance over the FY24–FY26 reporting period illustrates operational leverage anchored by its core brand, Coach, and the divestiture of non-core assets. In FY26, consolidated net sales grew 14.2% year-over-year to $8,004.2 million (a 16.7% expansion on a constant-currency basis excluding Stuart Weitzman). Adjusted operating income rose 33.3% to $1,865.8 million, achieving a 2-year Compound Annual Growth Rate (CAGR) of 27.9%, which outpaced the 2-year top-line revenue CAGR of 9.5% by 1,836 basis points.
Table Consolidated Financial Performance and Profitability Analysis (FY2024–FY2026)
| Financial Metric (USD in Millions, Except Per Share Data) | FY2024 | FY2025 | FY2026 | YoY Growth (FY2025) | YoY Growth (FY2026) | 2-Year CAGR |
|---|---|---|---|---|---|---|
| Net Sales | $6,671.2 | $7,010.7 | $8,004.2 | +5.1% | +14.2% | +9.5% |
| Gross Profit | $4,889.5 | $5,288.9 | $6,229.0 | +8.2% | +17.8% | +12.9% |
| GAAP Gross Margin | 73.3% | 75.4% | 77.8% | +210 bps | +240 bps | +450 bps |
| Adjusted Gross Margin (Non-GAAP) | 73.3% | 75.4% | 76.6% | +210 bps | +120 bps | +330 bps |
| GAAP Operating Income (EBIT) | $1,140.1 | $415.0 | $1,914.4 | -63.6% | +361.3% | +29.6% |
| Adjusted Operating Income (Non-GAAP) | $1,140.1 | $1,399.5 | $1,865.8 | +22.8% | +33.3% | +27.9% |
| GAAP Operating Margin | 17.1% | 5.9% | 23.9% | -1,120 bps | +1,800 bps | +680 bps |
| Adjusted Operating Margin (Non-GAAP) | 17.1% | 20.0% | 23.4% | +290 bps | +340 bps | +630 bps |
| GAAP Net Income | $816.0 | $183.2 | $1,527.7 | -77.5% | +733.9% | +36.8% |
| Adjusted Net Income (Non-GAAP) | $816.0 | $1,134.2 | $1,482.0 | +39.0% | +30.7% | +34.8% |
| GAAP Diluted EPS | $3.50 | $0.82 | $7.27 | -76.6% | +786.6% | +44.1% |
| Adjusted Diluted EPS (Non-GAAP) | $3.50 | $5.10 | $7.05 | +45.7% | +38.2% | +41.9% |
Gross Margin Drivers and Cost Dissection
Consolidated adjusted gross margin expanded 120 basis points in FY26 to 76.6%. The drivers of this expansion include:
* Divestiture Accretion: The sale of Stuart Weitzman to Caleres, Inc. on August 4, 2025 (for an aggregate purchase price of $109.1 million in cash, generating a pre-tax GAAP loss of $22.0 million: $18.6 million in FY25 and $3.4 million in FY26, alongside $10.9 million in FY26 transaction/severance costs) structurally contributed +60 basis points to adjusted gross margins and +80 basis points to adjusted operating margins.
* Net Pricing and Product Mix: Average Unit Retail (AUR) expansion and premium brand mix contributed +60 basis points.
* Tariff Inflation Drag: Gross margin gains absorbed a 130 basis point tariff headwind resulting from the elimination of the direct-to-consumer *de minimis* exemption on August 29, 2025, combined with Section 301 tariffs (10.0% to 12.5%).
* IEEPA Settlement: GAAP gross margins included a $98.3 million pre-tax credit following the U.S. Supreme Court’s February 20, 2026, ruling invalidating certain International Emergency Economic Powers Act (IEEPA) tariffs. Tapestry collected $2.1 million in cash in Q4 FY26 ($2.0 million allocated to Cost of Sales and $0.1 million to SG&A) and recognized a $114.7 million probable receivable under Other Current Assets ($96.2 million reduction to Cost of Sales, $9.5 million to Accrued Liabilities, and $9.0 million reduction to capitalized inventory tariffs). This non-recurring item was excluded from Non-GAAP metrics.
Segment Disaggregation and Retail Unit Economics
Operational performance between Tapestry's reporting units showed distinct trajectories across store footprint productivity and profitability.
Table Brand Operational Performance and Retail Footprint Analysis (FY2024–FY2026)
| Segment / Metric | FY2024 | FY2025 | FY2026 | YoY / Net Delta |
|---|---|---|---|---|
| COACH | ||||
| Net Sales ($M) | $5,095.3 | $5,598.5 | $6,914.7 | +23.5% |
| Adjusted Gross Margin | — | 78.1% | 78.8% | +70 bps |
| Adjusted Operating Margin | — | 33.5% | 35.8% | +230 bps |
| GAAP Operating Margin | — | 33.5% | 36.8% | +330 bps |
| Store Count (NA / International) | 930 (324 / 606) | 931 (324 / 607) | 973 (336 / 637) | +42 net (+43 over 2 years) |
| Average Store Area (Square Feet) | 3,235 sq ft | 3,265 sq ft | 3,242 sq ft | -0.7% |
| Total Fleet Square Footage | 3,008,472 sq ft | 3,039,384 sq ft | 3,154,347 sq ft | +3.8% |
| Segment Sales per Square Foot | $1,694 | $1,842 | $2,192 | +19.0% |
| Core Category Mix (Handbags / Footwear) | — | — | $4.61B / $408.5M | 57.6% / 5.9% |
| KATE SPADE | ||||
| Net Sales ($M) | $1,334.4 | $1,197.1 | $1,074.9 | -10.2% |
| Adjusted Gross Margin | — | 66.7% | 63.0% | -370 bps |
| Adjusted Operating Margin | — | 7.6% | (2.5)% | -1,010 bps |
| GAAP Operating Income / (Loss) | — | $(826.6)M* | $(10.0)M | +$816.6M |
| Adjusted Operating Income / (Loss) | — | $91.0M | $(27.2)M | -$118.2M |
| Store Count (NA / International) | 378 (197 / 181) | 360 (189 / 171) | 326 (178 / 148) | -34 net (-52 over 2 years) |
| Average Store Area (Square Feet) | 2,226 sq ft | 2,301 sq ft | 2,400 sq ft | +4.3% |
| Total Fleet Square Footage | 841,412 sq ft | 828,189 sq ft | 782,402 sq ft | -5.5% |
| Segment Sales per Square Foot | $1,586 | $1,445 | $1,374 | -4.9% |
| Consolidated Group | ||||
| Total Directly Operated Store Count | 1,308 | 1,291 | 1,299 | +8 net (-9 over 2 years) |
Coach generated a $2,192 per-square-foot monetization profile (a 1.60x productivity multiple over Kate Spade's $1,374 per square foot). Coach expanded its network by 42 net doors (71.4% international), operating 4,855 average square-foot North American flagships and 2,391 square-foot international doors. Kate Spade closed 34 net doors (-9.4% footprint) to mitigate fixed-cost deleveraging.
Forensic SG&A Cost Disaggregation
Consolidated GAAP SG&A expenses fell 11.48% in FY26 to $4,314.6 million (53.90% of net sales) following the normalization of the FY25 $854.8 million Kate Spade impairment. Adjusted Non-GAAP SG&A contracted 210 basis points to 53.19% (or 53.3% rounded).
* Store and Selling Expenses: ~$2,243.6 million (52.0% of total SG&A).
* Marketing and Advertising: Reached $962.5 million (12.0% of net sales), up 29.3% from $744.5 million (~11.0% of net sales) in FY25.
* Corporate Overhead & Administrative: $908.2 million (21.0% of total SG&A), comprising Note 17 Corporate SG&A of $615.8 million (Non-GAAP: $583.5 million), share-based compensation of $107.4 million (up from $91.4 million in FY25 and $85.9 million in FY24), defined contribution 401(k) expenses of $13.6 million ($13.1 million in FY25), and total restructuring/efficiency items of $171.4 million.
* Distribution and Customer Logistics: $200.3 million (4.7% of total SG&A), based on gross outbound shipping and customer delivery expenses of $209.6 million ($222.0 million in FY25, $221.1 million in FY24) net of Transition Services Agreement logistics reimbursements.
* Impairment and Efficiency Adjustments: Non-cash store footprint impairments within SG&A fell to $7.8 million ($7.0 million store PP&E, $0.8 million operating lease ROU assets) from $8.8 million in FY25 ($5.8 million PP&E, $3.0 million ROU assets). Adjusted SG&A excluded $29.0 million in Organizational Efficiency Costs ($17.2 million in FY25), $9.8 million in Distribution Network Optimization (DNO) costs, and $18.6 million in acquisition/divestiture costs ($112.5 million in FY25).
Working Capital Optimization and Cash Flow Mechanics
Operating cash flow rose 62.6% to $1,978.5 million in FY26. With PP&E capital expenditures at $166.0 million ($122.7 million in FY25, $108.9 million in FY24), Free Cash Flow reached $1,812.5 million (a 122.3% Non-GAAP conversion rate).
Table Working Capital Efficiency, Cash Flow Conversion, and Balance Sheet Strength Analysis (FY2024–FY2026)
| Balance Sheet / Liquidity Metric | FY2024 | FY2025 | FY2026 | YoY / Net Delta |
|---|---|---|---|---|
| Operating Cash Flow (OCF) | $1,255.6M | $1,216.6M | $1,978.5M | +$761.9M |
| PP&E Capital Expenditures | $108.9M | $122.7M | $166.0M | +$43.3M |
| Cash Cloud Computing Implementation | — | — | $51.1M | +$51.1M |
| Free Cash Flow (FCF) | $1,146.7M | $1,093.9M | $1,812.5M | +$718.6M |
| Non-GAAP FCF Conversion Rate | 140.5% | 96.4% | 122.3% | +2,590 bps |
| Days Sales Outstanding (DSO) | — | 12.5 Days | 10.8 Days | -1.7 Days |
| Days Inventory Outstanding (DIO / DSI) | — | 182.5 Days | 169.9 Days | -12.6 Days |
| Days Payable Outstanding (DPO) | — | 96.7 Days | 119.7 Days | +23.0 Days |
| Cash Conversion Cycle (CCC) | — | 98.2 Days | 61.0 Days | -37.2 Days |
| Ending Inventory | — | $860.7M | $826.2M | -4.0% |
| Cost of Sales | — | $1,721.8M | $1,775.2M | +3.1% |
| Inventory Turnover Ratio | — | 2.00x | 2.15x | +0.15x |
| Supplier Finance Program (SCF) in Accounts Payable | — | — | $318.4M | FY2026 Balance |
| Carrying Value of Long-Term Debt | $4,500.0M* | $2,394.6M | $2,379.0M | -$15.6M |
| Cash and Cash Equivalents | — | — | $974.7M | Strong Solvency Position |
| Non-GAAP Adjusted EBITDA | — | $1,563.8M | $2,026.6M | +$462.8M |
| Adjusted Debt-to-EBITDA Leverage | — | 1.53x | 1.17x | -0.36x |
| Standard Non-GAAP ROIC | — | 53.45% | 79.53% | +2,608 bps |
| Lease-Adjusted ROIC (ASC 842) | — | 31.63% | 43.69% | +1,206 bps |
The Cash Conversion Cycle contracted by 37.2 days to 61.0 days. Inventory declined 4.0% to $826.2 million against a 14.2% top-line increase, improving inventory velocity (DSI down 12.6 days to 169.9 days; turnover up to 2.15x). Working capital management was driven by the voluntary Supplier Finance Program, which held $318.4 million in accounts payable at FY26 year-end, extending DPO by 23.0 days to 119.7 days. Valuation allowances against accounts receivable for wholesale customer markdowns fell to $10.4 million ($12.2 million in FY25), while inventory-related deferred tax assets stood at $15.4 million ($16.4 million in FY25).
Capital Execution and ASC 842 Capitalization Schedule
In FY26, total cash inflows of $2,087.6 million ($1,978.5 million operating cash flow plus $109.1 million Stuart Weitzman proceeds) funded capital outlays and capital distributions:
* Share Repurchases: $1,350.0 million open-market repurchases executed ($1,554.6 million in cash settlements), reducing the diluted share count to 200.4 million units (down 12.9% from 230.2 million in FY24). This followed a $2.02 billion Accelerated Share Repurchase (ASR) executed in FY25 out of the Board’s $3.00 billion authorization.
* Common Stock Dividends: Paid $326.1 million ($1.60 per share, representing a 22.0% Non-GAAP dividend payout ratio).
* Debt Service: Repaid $17.0 million in debt principal; long-term carrying debt stood at $2,379.0 million (principal: $2,396.6 million across the 4.125% 2027 Notes of $396.6 million, 5.100% 2030 Notes of $750.0 million, 3.050% 2032 Notes of $500.0 million, and 5.500% 2035 Notes of $750.0 million; less $15.9 million unamortized issue costs and $1.7 million fair value hedge adjustments). Fair value interest rate swaps hedged $375.0 million of the 2035 notes into floating SOFR.
* Undrawn Liquidity Facilities: $2.00 billion Amended Revolving Credit Facility (expiring May 22, 2030; SOFR/EURIBOR floating rate), $2.00 billion Commercial Paper Program, and RMB 250.0 million China Credit Facility ($34.78 million USD equivalent at 7.1875 CNY/USD exchange rate) were completely undrawn at fiscal year-end. Outstanding letters of credit and bank guarantees totaled $38.1 million ($26.5 million in FY25).
* Lease Commitments (ASC 842): Recorded $1,417.2 million in Operating Lease ROU Assets and $1,574.0 million in Lease Liabilities ($307.8 million current, $1,266.2 million non-current) across 1,299 operated retail stores, with a 7.4-year weighted average tenor and a 4.4% discount rate. Variable lease costs were $232.1 million (38.0% of total lease expenses). Sublease income recognized was $14.7 million in FY26 ($157.1 million contractual sublease receivables through FY32+).
Infrastructure Layout, Global Sourcing Networks, and Trade Governance
Tapestry operates an asset-light, multi-country supply chain architecture overseen by directly operated sourcing offices in Vietnam, mainland China, the Philippines, and Cambodia. Finished goods assembly is entirely outsourced, with no individual vendor accounting for 10% or more of total inventory purchases for either brand.
Distribution Network Optimization (DNO) and Real Estate Footprint
Tapestry's fulfillment infrastructure is undergoing geographic realignment:
* Pennsylvania Consolidation: Tapestry incurred $9.8 million in pre-tax DNO restructuring costs in FY26 to transition Kate Spade’s North American logistics from a 601,000 square-foot company-operated facility in Westchester, Ohio, to a specialized third-party facility in Pennsylvania, scheduled for completion in H1 FY27.
* North American Coach Nodes: The Coach brand maintains long-term company-operated fulfillment centers in Jacksonville, Florida (1,050,000 square feet; leased through FY37) and Las Vegas, Nevada (789,000 square feet; leased through FY37).
* International 3PL Infrastructure: Sourcing operations are supported by third-party facilities in Ontario, Canada (150,000 square feet; through FY37), Chiba, Japan (278,000 square feet; through FY37), and Shanghai, China (170,000 square feet; through FY37), alongside regional centers in the Netherlands, the United Kingdom, Singapore, South Korea, Malaysia, and Australia.
Table Global Logistics and Fulfillment Infrastructure Network Overview
| Facility Location | Brand Supported | Operating Model | Area (Square Feet) | Lease Expiration |
|---|---|---|---|---|
| Jacksonville, Florida | Coach (North America) | Directly Operated | 1,050,000 sq ft | Through FY2037 |
| Las Vegas, Nevada | Coach (North America) | Directly Operated | 789,000 sq ft | Through FY2037 |
| Westchester, Ohio | Kate Spade (North America) | Directly Operated | 601,000 sq ft | Exit in H1 FY2027 |
| Pennsylvania (New Hub) | Kate Spade (North America) | 3PL Partner | Scalable Footprint | Commencing H1 FY2027 |
| Ontario, Canada | Coach & Kate Spade | 3PL Partner | 150,000 sq ft | Through FY2037 |
| Chiba, Japan | Coach & Kate Spade | 3PL Partner | 278,000 sq ft | Through FY2037 |
| Shanghai, China | Coach (Asia Regional) | 3PL Partner | 170,000 sq ft | Through FY2037 |
Technology Assets, Digital Integration, and Forward Commitments
Tapestry operates a unified cloud platform with a shared codebase across e-commerce storefronts, Order Management Systems (OMS), Point of Sale (POS), Customer Service, and Enterprise Resource Planning (ERP). In FY26, total technology and capital outlays reached $217.1 million ($166.0 million in PP&E Capex and $51.1 million in cash cloud software implementation costs). Capitalized cloud computing implementations are amortized straight-line into SG&A over the contract term ($56.4 million in FY26, $62.0 million in FY25, $55.0 million in FY24).
Table Contractual Cash Outflow Profile and Forward Commitment Analysis (As of June 27, 2026)
| Commitment Category | FY2027 ($M) | FY2028–FY2029 ($M) | FY2030 & Beyond ($M) |
|---|---|---|---|
| Inventory Purchase Obligations | $768.2 | $0.0 | $0.0 |
| Operating Lease Commitments (Contractual Commenced & Signed) | $368.8 | $625.3 | $1,043.1 |
| Long-Term Debt Principal Repayments | $0.0 | $396.6 | $2,000.0 |
| Long-Term Debt Cash Interest Obligations | $111.1 | $209.6 | $457.9 |
| Capital Expenditures & Contractual Cloud Software Commitments | $45.2 | $0.0 | $0.0 |
| Other Operational Outlays | $107.6 | $80.9 | $21.8 |
| Total Forward Cash Obligations (Excluding Tax Audit Reserves) | $1,400.9 | $1,312.4 | $3,522.8 |
The forward outlook includes definite-lived intangible amortization of $3.0 million annually through FY31 (6.0 years remaining life on customer relationships), $16.3 million in deferred net derivative gains in Accumulated Other Comprehensive Income (AOCI) to be reclassified as a reduction to FY27 Cost of Sales, and an adjusted Effective Tax Rate (ETR) expected to track the FY26 adjusted baseline of 18.2% (GAAP: 17.9%) under OECD Pillar Two QDMTT regulations. Tapestry holds $868.8 million in forward cash flow hedges and $1.82 billion in net investment hedges.
HDIN Institutional Verdict
Following the regulatory termination of the Capri Holdings acquisition on November 13, 2024—which incurred $45.1 million in reimbursed transaction expenses to Capri, a $119.4 million pre-tax debt extinguishment loss, $88.8 million in transaction SG&A, and $60.2 million in financing interest during FY25—Tapestry successfully realigned its capital allocation framework:
Table Institutional Scorecard: Management Execution and Strategic Performance Assessment
| Strategic Vector | Score | Forensic Research Verdict & Analytical Commentary |
|---|---|---|
| Portfolio Optimization | 9.0/10 | Divestiture of Stuart Weitzman structurally expanded gross margin by +60 bps and improved portfolio efficiency. |
| Balance Sheet & Liability Control | 8.0/10 | Redeemed $6.20B in bridge debt, reducing leverage to 1.17x Debt-to-EBITDA. |
| Working Capital & SCF Optimization | 9.5/10 | Extension of DPO to 119.7 days supported $1.81B in free cash flow generation and enabled self-funded share repurchases. |
| Macro Volatility & Brand Defense | 7.5/10 | Coach AUR execution helped offset tariff pressures; Kate Spade turnaround progress remains behind expectations. |
| Overall Composite Rating | 8.5/10 | Upper-quartile operational execution and disciplined capital allocation performance. |
1. Core Asset Monetization: Coach generated $6.91 billion in revenue (86.4% of group sales) and delivered an adjusted operating margin of 35.8% (+230 basis points), demonstrating structural pricing power. This performance powered a 289.6% 5-year cumulative total stockholder return ($100 invested on July 3, 2021, reached $389.55 by June 27, 2026), compared to $57.50 for the S&P Composite 1500 Apparel, Accessories & Luxury Goods Index.
2. The Kate Spade Valuation Drag: Kate Spade remains an operational challenge, posting an adjusted operating loss of -$27.2 million (-2.5% margin) and a 370 basis point gross margin contraction due to markdown exposure and promotional channel dependence. While the FY26 annual impairment test indicated a 30% fair value cushion over carrying values ($381.9 million goodwill, $699.1 million brand trademark), this cushion remains vulnerable to tariff shifts or top-line weakness.
3. Unrecognized Contingencies: Tapestry carries $150.0 million in contingent tax liabilities ($115.7 million gross unrecognized tax benefits plus $34.3 million accrued interest/penalties, with $112.4 million directly affecting the effective tax rate), alongside ongoing putative securities class-action litigation in the U.S. District Court for the District of Delaware regarding Capri transaction disclosures (complaint dismissed without prejudice March 31, 2026; amended complaint filed April 30, 2026; motion to dismiss filed June 15, 2026). The valuation allowance against deferred tax assets contracted to $12.0 million ($17.6 million in FY25).
4. Shareholder Defense Constraints: Anti-takeover protections under the Maryland General Corporation Law (MGCL)—including supermajority two-thirds director removal voting rules, unilateral charter reclassification powers, five-year interested stockholder business combination moratoria, and the Board's unilateral authority to opt back into the Maryland Control Share Acquisition Act—concentrate strategic control within the Board of Directors, limiting external activist interventions.
Presentation Download & Video Access:
- Presentation Download: Click the PDF download link under 'Related Topics' to access the full institutional presentation of this report.
- Video Link: Click this link to watch the HDIN analyst briefing on YouTube.
About HDIN Research:
HDIN Research is a global market intelligence and strategic advisory firm specializing in institutional-grade financial analysis, supply chain audits, and macroeconomic forecasting. Our dedicated sector analysts deliver actionable, data-driven insights tailored for private equity, hedge funds, and corporate strategy teams. Visit us at http://www.hdinresearch.com.
2026 AI Transparency Footer:
"This intelligence report was authored by HDIN Research analysts following a rigorous audit of official corporate filings. AI was utilized for massive-scale data synthesis and structural drafting, ensuring 100% inclusion of reported data points. All strategic insights, financial modeling, and final verdicts were verified by our editorial board to ensure professional accuracy and compliance with 2026 Google Search E-E-A-T standards."