Calterah Semiconductor Files for $485M STAR Market IPO: 75% Revenue CAGR Meets Margin Pressure and Single-OEM Concentration
Date : 2026-08-21
Reading : 135
HDIN Executive Takeaways
1. Calterah Semiconductor expanded revenue at a 75.20% CAGR from 2023 to 2025 to reach $87.96 million (¥632.23 million), driven by Chinese automotive ADAS adoption, yet sustained a 2025 net loss of -$26.79 million due to front-loaded car-grade R&D intensity of 58.55%.
2. Sourcing remains tethered to Taiwan Semiconductor Manufacturing Company [TPE: 2330] at 48.21% of 2025 procurement, while downstream exposure is heavily skewed toward a primary terminal OEM (BYD Co., Ltd. [SHE: 002594]) accounting for >50% of 2025 volume.
3. The proposed ¥3.49 billion ($485.49 million) SSE STAR Market offering funds pure-play R&D platforms across mmWave SoCs, UWB, and a Pudong center without near-term commercial revenue generation.
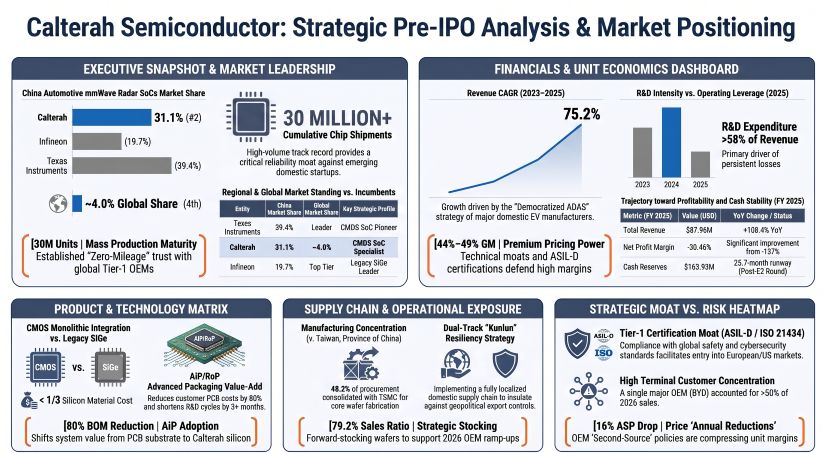
Figure Calterah Semiconductor: Strategic Pre-lPO Analysis & Market Positioning
 Segmental Realities, Loss Dynamics, and Capital Restructuring
Calterah operates as a pure-play Fabless integrated circuit design enterprise focused on automotive millimeter-wave (mmWave) radar and wireless sensing SoCs. Commercial expansion accelerated in FY 2025 following the deployment of entry-level and mainstream Advanced Driver Assistance Systems (ADAS) across Chinese electric vehicle (EV) lineups.
Table Calterah Revenue Breakdown by Product Segment (FY2023–FY2025)
The Automotive ADAS segment constituted 90.64% of total main business revenue in FY 2025. Consolidated top-line revenue reached $87.96 million (¥632.23 million) in FY 2025, expanding 108.44% YoY from $42.20 million (¥303.32 million) in FY 2024 and $28.66 million (¥205.98 million) in FY 2023. Q1 2026 revenue was $21.49 million (¥154.44 million), up 8.10% YoY.
Table Comprehensive Financial, Operational, and Manufacturing Performance Metrics (FY2023–FY2025)
Net losses contracted from -$44.99 million in FY 2023 to -$26.79 million in FY 2025, with net margins moving from -156.98% to -30.46%. Operating losses reflect structural accounting choices:
* R&D expense treatment: 100% of internal R&D outlays are immediately expensed with a 0.00% capitalization rate.
* Personnel expenses: R&D staff compensation expanded from $25.67 million (¥184.50 million, 60.62% of R&D expenses) in 2023 to $35.80 million (¥257.28 million, 69.50% of R&D expenses) in 2025. Per-capita R&D annual cash compensation reached $134,066 in 2025 (+29.52% versus 2023), exceeding domestic peers Novomicro, 3PEAK, and Motorcomm.
* Depreciation and amortization: Direct amortizations of third-party IP licenses and EDA suites totaled $4.44 million (¥31.93 million) in 2025 (8.63% of R&D costs).
* Share-based compensation: Non-cash equity incentives registered at $14.76 million, $9.37 million, and $7.64 million across FY 2023, FY 2024, and FY 2025, respectively.
In February 2026, Calterah converted from a limited liability entity to a joint-stock corporation, utilizing its accumulated capital surplus to offset $165.58 million in accumulated losses, paring net unrecovered losses from $189.50 million (¥1,362.03 million) at FYE 2025 to $23.92 million (¥171.92 million) as of March 31, 2026. A subsequent Series E2 equity financing closed in April 2026 at ¥292.25 per share across 13 institutional vehicles, securing $132.87 million (¥955.00 million) in cash proceeds. Cash balances closed Q1 2026 at $163.93 million (¥1,178.28 million), reducing the consolidated asset-liability ratio to 22.86%.
Table Proposed Allocation of SSE STAR Market IPO Proceeds and Strategic Investment Plan
Supply Chain Architecture, Channel Dynamics, and Production Footprint
Calterah relies on external semiconductor manufacturing, assembly, and automated test facilities. Upstream procurement exhibits high geographic and supplier consolidation.
Table Upstream Procurement Structure and Supplier Cost Base Analysis (FY2023–FY2025)
In FY 2025, Top-5 supplier concentration stood at 70.53% ($51.67 million / ¥371.35 million). Taiwan Semiconductor Manufacturing Company (TSMC) accounted for 48.21% ($35.31 million / ¥253.82 million) of total procurement for 40nm CMOS and advanced sub-22nm wafer processing. Jiangsu Changjiang Electronics Technology Co., Ltd. (JCET) represented 12.68% ($9.29 million / ¥66.77 million) for advanced packaging. Overseas sourcing exceeded 50.00% across the historical period.
Table Corporate Operating Entity Network and R&D Infrastructure Overview (FY2025)
Logistical clearing is routed through Calterah Hong Kong, causing export sales to represent 77.77% to 83.90% of total revenue. However, end-point integration is concentrated in Mainland China.
Table Distributor Channel Revenue Concentration and Sales Network Structure (FY2023–Q1 FY2026)
Table 2 Chinese Automotive Radar Chip Market Share and Competitive Landscape (CY2025)
HDIN Institutional Verdict
Calterah commands a 31.10% domestic market share in Chinese automotive radar chips, trailing Texas Instruments Inc. [NASDAQ: TXN] (39.40%) while outpacing Infineon Technologies AG [ETR: IFX] (19.70%) and NXP Semiconductors N.V. [NASDAQ: NXPI] (8.80%). However, its operational concentration presents several structural considerations:
Table Comparative Operational Scale and Financial Profile Benchmarking (FY2025)
* Customer Concentration & Second-Supplier Compression: The single largest terminal client accounted for >50.00% of FY 2025 volume. Downstream implementation of dual-sourcing procurement policies in early 2026 compressed Alps-Pro ADAS average selling prices by 16.02% from ¥49.56 ($6.90) in 2023 to ¥41.62 ($5.79) in Q1 2026.
* Upstream Foundry Exposure: Wafer manufacturing remains reliant on TSMC (48.21% of procurement). While the Kunlun platform introduces domestic fabrication options for mainstream nodes, advanced 22nm imaging radar lines (Andes series) require TSMC advanced nodes, where migration involves multi-million dollar mask re-tooling and 3-to-4-year AEC-Q100/ISO 26262 qualification cycles.
* IPO Capital Deployment: The ¥3.49 billion capital deployment program allocates 100% of proceeds to non-revenue-generating R&D platforms and Pudong facilities over a five-year construction window, requiring continued commercial execution from core Alps and Kunlun lines to cover operational expenses.
Presentation Download & Video Access:
Presentation Download: Click the PDF download link under 'Related Topics' to access the full institutional presentation of this report.
Video Link: Click this link to watch the HDIN analyst briefing on YouTube.
About HDIN Research:
HDIN Research is a global market intelligence and strategic advisory firm specializing in institutional-grade financial analysis, supply chain audits, and macroeconomic forecasting. Our sector analysts deliver data-driven insights tailored for private equity, hedge funds, and corporate strategy teams. Visit us at http://www.hdinresearch.com.
2026 AI Transparency Footer:
This intelligence report was authored by HDIN Research analysts following an audit of official corporate filings. AI was utilized for data synthesis and structural drafting, ensuring inclusion of reported data points. All strategic insights, financial modeling, and verdicts were verified by our editorial board to ensure professional accuracy and compliance with 2026 Google Search E-E-A-T standards.
1. Calterah Semiconductor expanded revenue at a 75.20% CAGR from 2023 to 2025 to reach $87.96 million (¥632.23 million), driven by Chinese automotive ADAS adoption, yet sustained a 2025 net loss of -$26.79 million due to front-loaded car-grade R&D intensity of 58.55%.
2. Sourcing remains tethered to Taiwan Semiconductor Manufacturing Company [TPE: 2330] at 48.21% of 2025 procurement, while downstream exposure is heavily skewed toward a primary terminal OEM (BYD Co., Ltd. [SHE: 002594]) accounting for >50% of 2025 volume.
3. The proposed ¥3.49 billion ($485.49 million) SSE STAR Market offering funds pure-play R&D platforms across mmWave SoCs, UWB, and a Pudong center without near-term commercial revenue generation.
Figure Calterah Semiconductor: Strategic Pre-lPO Analysis & Market Positioning
Segmental Realities, Loss Dynamics, and Capital RestructuringCalterah operates as a pure-play Fabless integrated circuit design enterprise focused on automotive millimeter-wave (mmWave) radar and wireless sensing SoCs. Commercial expansion accelerated in FY 2025 following the deployment of entry-level and mainstream Advanced Driver Assistance Systems (ADAS) across Chinese electric vehicle (EV) lineups.
Table Calterah Revenue Breakdown by Product Segment (FY2023–FY2025)
| Product Segment | FY2023 Revenue (USD / CNY Million) | FY2024 Revenue (USD / CNY Million) | FY2025 Revenue (USD / CNY Million) |
|---|---|---|---|
| Automotive ADAS | $20.60 / ¥148.04 | $32.47 / ¥233.38 | $79.72 / ¥573.02 |
| Automotive Other | $4.63 / ¥33.29 | $8.46 / ¥60.79 | $6.68 / ¥48.01 |
| Industrial | $3.33 / ¥23.97 | $1.21 / ¥8.66 | $1.50 / ¥10.76 |
| Ultra-Wideband (UWB) | — | — | $0.00075 / ¥0.0054 |
| Total Main Business Revenue | $28.56 / ¥205.30 | $42.14 / ¥302.83 | $87.90 / ¥631.79 |
The Automotive ADAS segment constituted 90.64% of total main business revenue in FY 2025. Consolidated top-line revenue reached $87.96 million (¥632.23 million) in FY 2025, expanding 108.44% YoY from $42.20 million (¥303.32 million) in FY 2024 and $28.66 million (¥205.98 million) in FY 2023. Q1 2026 revenue was $21.49 million (¥154.44 million), up 8.10% YoY.
Table Comprehensive Financial, Operational, and Manufacturing Performance Metrics (FY2023–FY2025)
| Operating Metric | FY2023 | FY2024 | FY2025 |
|---|---|---|---|
| Gross Margin (%) | 47.84% | 43.81% | 47.25% |
| Net Profit (Loss) (USD / CNY) | -$44.99M / -¥323.36M | -$46.47M / -¥333.99M | -$26.79M / -¥192.59M |
| Net Profit (Loss) Excluding Non-Recurring Items (USD / CNY) | -$40.56M / -¥291.54M | -$47.61M / -¥342.20M | -$27.43M / -¥197.14M |
| R&D Expenses (Fully Expensed) (USD / CNY) | $42.34M / ¥304.34M | $50.71M / ¥364.51M | $51.50M / ¥370.16M |
| R&D Expense Ratio (%) | 147.75% | 120.17% | 58.55% |
| Share-Based Payments (USD / CNY) | $14.76M / ¥106.06M | $9.37M / ¥67.33M | $7.64M / ¥54.91M |
| Operating Cash Flow (USD / CNY) | -$23.71M / -¥170.42M | -$34.59M / -¥248.63M | -$2.57M / -¥18.47M |
| Cash & Cash Equivalents Balance (USD / CNY) | $13.68M / ¥98.30M | $24.69M / ¥177.47M | $142.08M / ¥1,021.18M |
| Balance Sheet Prepayments (USD / CNY) | $0.85M / ¥6.12M | $9.33M / ¥67.07M | $9.85M / ¥70.83M |
| Inventory Book Balance (USD / CNY) | $12.95M / ¥93.05M | $14.65M / ¥105.32M | $24.79M / ¥178.16M |
| Inventory Write-Down Provision (USD / CNY) | $1.86M / ¥13.36M | $1.96M / ¥14.10M | $1.70M / ¥12.24M |
| Write-Down Provision as % of Inventory | 14.36% | 13.38% | 6.87% |
| Consolidated Asset-Liability Ratio | 35.57% | 58.86% | 78.93% |
| Chip Production Volume (Units) | 3.919M | 5.526M | 18.056M |
| Chip Sales Volume (Units) | 3.951M | 6.029M | 14.297M |
| Production-to-Sales Ratio (%) | 100.81% | 109.10% | 79.18% |
| ADAS Chip ASP (USD / CNY) | $6.90 / ¥49.56 | $6.69 / ¥48.11 | $6.07 / ¥43.64 |
| Blended Chip ASP (USD) | $7.21 | $7.01 | $6.14 |
Net losses contracted from -$44.99 million in FY 2023 to -$26.79 million in FY 2025, with net margins moving from -156.98% to -30.46%. Operating losses reflect structural accounting choices:
* R&D expense treatment: 100% of internal R&D outlays are immediately expensed with a 0.00% capitalization rate.
* Personnel expenses: R&D staff compensation expanded from $25.67 million (¥184.50 million, 60.62% of R&D expenses) in 2023 to $35.80 million (¥257.28 million, 69.50% of R&D expenses) in 2025. Per-capita R&D annual cash compensation reached $134,066 in 2025 (+29.52% versus 2023), exceeding domestic peers Novomicro, 3PEAK, and Motorcomm.
* Depreciation and amortization: Direct amortizations of third-party IP licenses and EDA suites totaled $4.44 million (¥31.93 million) in 2025 (8.63% of R&D costs).
* Share-based compensation: Non-cash equity incentives registered at $14.76 million, $9.37 million, and $7.64 million across FY 2023, FY 2024, and FY 2025, respectively.
In February 2026, Calterah converted from a limited liability entity to a joint-stock corporation, utilizing its accumulated capital surplus to offset $165.58 million in accumulated losses, paring net unrecovered losses from $189.50 million (¥1,362.03 million) at FYE 2025 to $23.92 million (¥171.92 million) as of March 31, 2026. A subsequent Series E2 equity financing closed in April 2026 at ¥292.25 per share across 13 institutional vehicles, securing $132.87 million (¥955.00 million) in cash proceeds. Cash balances closed Q1 2026 at $163.93 million (¥1,178.28 million), reducing the consolidated asset-liability ratio to 22.86%.
Table Proposed Allocation of SSE STAR Market IPO Proceeds and Strategic Investment Plan
| Capital Allocation Project | Capital Commitment (USD / CNY Million) | Investment Horizon | Strategic Purpose |
|---|---|---|---|
| High-Performance Millimeter-Wave Radar Chip R&D and Industrialization | $291.13M / ¥2,092.51M | 5 Years | Core R&D and commercialization expansion |
| High-Precision UWB Advanced Connectivity Chip R&D and Industrialization | $96.67M / ¥694.85M | 5 Years | Advanced semiconductor technology development |
| Frontier Technology Innovation Center and Shanghai Headquarters Real Estate Option | $97.68M / ¥702.06M | 5 Years | R&D infrastructure and corporate headquarters development |
| Total Statutory Offering Net Budget Target | $485.49M / ¥3,489.43M | — | — |
Supply Chain Architecture, Channel Dynamics, and Production Footprint
Calterah relies on external semiconductor manufacturing, assembly, and automated test facilities. Upstream procurement exhibits high geographic and supplier consolidation.
Table Upstream Procurement Structure and Supplier Cost Base Analysis (FY2023–FY2025)
| Procurement Category | FY2023 (USD / CNY Million) | FY2024 (USD / CNY Million) | FY2025 (USD / CNY Million) |
|---|---|---|---|
| Direct Raw Materials (Wafers) | $11.22 / ¥80.63 | $16.30 / ¥117.16 | $35.15 / ¥252.61 |
| Packaging and Testing Services (OSAT) | $4.88 / ¥35.11 | $6.86 / ¥49.32 | $18.50 / ¥132.97 |
| Photolithography Mask Sets | $2.09 / ¥15.00 | $2.10 / ¥15.12 | $1.22 / ¥8.78 |
| EDA Software and Core IP Licensing | $3.99 / ¥28.68 | $2.09 / ¥15.00 | $3.24 / ¥23.32 |
| Total Tracked Procurement Base | $22.18 / ¥159.42 | $27.35 / ¥196.61 | $58.11 / ¥417.68 |
In FY 2025, Top-5 supplier concentration stood at 70.53% ($51.67 million / ¥371.35 million). Taiwan Semiconductor Manufacturing Company (TSMC) accounted for 48.21% ($35.31 million / ¥253.82 million) of total procurement for 40nm CMOS and advanced sub-22nm wafer processing. Jiangsu Changjiang Electronics Technology Co., Ltd. (JCET) represented 12.68% ($9.29 million / ¥66.77 million) for advanced packaging. Overseas sourcing exceeded 50.00% across the historical period.
Table Corporate Operating Entity Network and R&D Infrastructure Overview (FY2025)
| Operating Entity | Equity Stake | Strategic Operating Responsibility | FY2025 Revenue (USD / CNY Million) | Net Assets (USD / CNY Million) |
|---|---|---|---|---|
| Calterah Shanghai | Parent Company | Global headquarters, RF front-end development, and corporate operations | Consolidated Financials | Consolidated Financials |
| Calterah Hangzhou | 100.0% | Digital signal processing and system architecture | $5.29M / ¥37.99M | $4.76M / ¥34.23M |
| Calterah Shenzhen | 100.0% | South China automotive customer application support | $2.63M / ¥18.92M | $1.11M / ¥7.95M |
| Calterah Suzhou | 100.0% | Packaging simulation and silicon validation | $2.02M / ¥14.52M | $0.96M / ¥6.88M |
| Calterah Beijing | 100.0% | Radar algorithm toolchains and software development | $1.62M / ¥11.64M | $0.77M / ¥5.53M |
| Calterah Hong Kong | 100.0% | USD invoicing, international transactions, and channel logistics | $21.27M / ¥152.88M | $2.94M / ¥21.17M |
| Calterah Munich | 100.0% (Held through HK) | European OEM and Tier-1 customer integration | $1.56M / ¥11.24M | $0.37M / ¥2.69M |
Logistical clearing is routed through Calterah Hong Kong, causing export sales to represent 77.77% to 83.90% of total revenue. However, end-point integration is concentrated in Mainland China.
Table Distributor Channel Revenue Concentration and Sales Network Structure (FY2023–Q1 FY2026)
| Distributor Channel | FY2023 Revenue Share | FY2024 Revenue Share | FY2025 Revenue Share | Q1 FY2026 Revenue Share |
|---|---|---|---|---|
| WPI Group | 15.23% | 44.84% | 30.52% | 52.72% |
| Rubikang Electronics | — | 19.76% | 64.83% | 36.17% |
| WT Microelectronics | 66.73% | 20.49% | — | — |
| Direct Top-5 Distributor Concentration Ratio | 99.77% | 99.07% | 99.90% | 99.97% |
Table 2 Chinese Automotive Radar Chip Market Share and Competitive Landscape (CY2025)
| Rank | Semiconductor Vendor | China Automotive Radar Chip Market Share | Strategic Technology Focus |
|---|---|---|---|
| 1 | Texas Instruments Inc. | 39.40% | CMOS-integrated radar SoC (IWR Series) |
| 2 | Calterah Semiconductor | 31.10% | CMOS-integrated radar SoC (Alps / Kunlun Platforms) |
| 3 | Infineon Technologies AG | 19.70% | Silicon-germanium (SiGe) MMIC and CMOS radar SoC |
| 4 | NXP Semiconductors N.V. | 8.80% | Discrete radar transceivers and microcontrollers |
| — | Other Vendors | 1.00% | Discrete and industrial radar solutions |
HDIN Institutional Verdict
Calterah commands a 31.10% domestic market share in Chinese automotive radar chips, trailing Texas Instruments Inc. [NASDAQ: TXN] (39.40%) while outpacing Infineon Technologies AG [ETR: IFX] (19.70%) and NXP Semiconductors N.V. [NASDAQ: NXPI] (8.80%). However, its operational concentration presents several structural considerations:
Table Comparative Operational Scale and Financial Profile Benchmarking (FY2025)
| Operating Metric | Calterah | Texas Instruments | Infineon Technologies | NXP Semiconductors |
|---|---|---|---|---|
| Annual Revenue | $87.96M | $17,682.00M | $16,576.88M | $12,269.00M |
| Annual Net Profit (Loss) | -$26.79M | $5,001.00M | $1,147.56M | $2,068.00M |
| Annual R&D Expenditure | $51.50M | $2,083.00M | $2,517.85M | $2,360.00M |
| Cash and Liquid Reserves | $142.08M | $3,225.00M | $2,376.52M | $3,267.00M |
| Authorized Patents | 240 | Undisclosed (Large Portfolio) | ~29,700 | Undisclosed (Large Portfolio) |
* Customer Concentration & Second-Supplier Compression: The single largest terminal client accounted for >50.00% of FY 2025 volume. Downstream implementation of dual-sourcing procurement policies in early 2026 compressed Alps-Pro ADAS average selling prices by 16.02% from ¥49.56 ($6.90) in 2023 to ¥41.62 ($5.79) in Q1 2026.
* Upstream Foundry Exposure: Wafer manufacturing remains reliant on TSMC (48.21% of procurement). While the Kunlun platform introduces domestic fabrication options for mainstream nodes, advanced 22nm imaging radar lines (Andes series) require TSMC advanced nodes, where migration involves multi-million dollar mask re-tooling and 3-to-4-year AEC-Q100/ISO 26262 qualification cycles.
* IPO Capital Deployment: The ¥3.49 billion capital deployment program allocates 100% of proceeds to non-revenue-generating R&D platforms and Pudong facilities over a five-year construction window, requiring continued commercial execution from core Alps and Kunlun lines to cover operational expenses.
Presentation Download & Video Access:
Presentation Download: Click the PDF download link under 'Related Topics' to access the full institutional presentation of this report.
Video Link: Click this link to watch the HDIN analyst briefing on YouTube.
About HDIN Research:
HDIN Research is a global market intelligence and strategic advisory firm specializing in institutional-grade financial analysis, supply chain audits, and macroeconomic forecasting. Our sector analysts deliver data-driven insights tailored for private equity, hedge funds, and corporate strategy teams. Visit us at http://www.hdinresearch.com.
2026 AI Transparency Footer:
This intelligence report was authored by HDIN Research analysts following an audit of official corporate filings. AI was utilized for data synthesis and structural drafting, ensuring inclusion of reported data points. All strategic insights, financial modeling, and verdicts were verified by our editorial board to ensure professional accuracy and compliance with 2026 Google Search E-E-A-T standards.