Hunan Yuneng New Energy Battery Material Co., Ltd.: Vertical Precursor Integration and Guizhou Mining Direct Sourcing Buffer Margin Volatility Across 1.30 Million-Ton LFP Footprint
Date : 2026-08-21
Reading : 90
HDIN Executive Takeaways
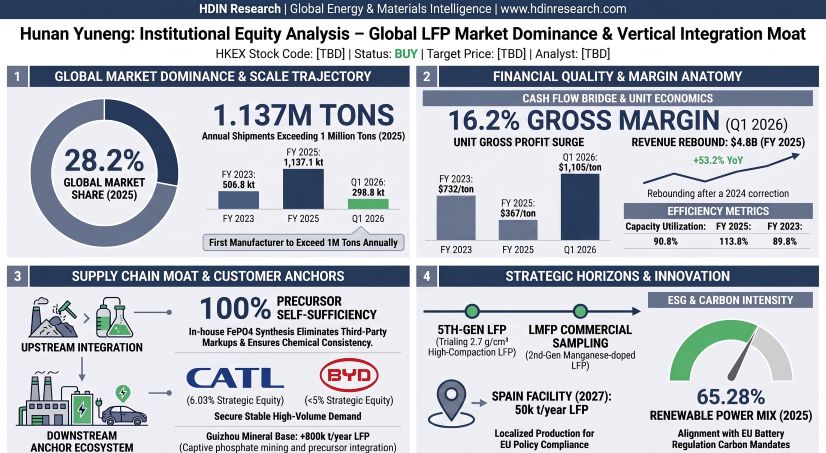
1. Hunan Yuneng New Energy Battery Material Co., Ltd. expanded global LFP cathode shipment share to 28.2% in 2025, lifting actual sales volume 60.0% year-over-year to 1,137.1 kt.
2. Vertical integration reached 100% in-house iron phosphate precursor self-sufficiency by 2024, expanding Q1 2026 gross margin to 16.1% with unit gross margin reaching $1,105.01 per ton.
3. Execution of the $3.339 billion Guizhou mine-to-market project and the $136.6 million Spain facility directly mitigates upstream lithium carbonate volatility and Western regulatory trade barriers.
Figure Hunan Yuneng Institutional Equity Analysis - Global LFP Market Dominance & Vertical integration Moat
 Operational Performance, Pricing Dynamics, and Segment Trajectory
Hunan Yuneng New Energy Battery Material Co., Ltd. operates as the world's largest supplier of lithium iron phosphate (LFP) cathode materials, commanding a 28.2% global market share in 2025 across an aggregate completed annual operating capacity of 1.30 million metric tons as of March 31, 2026. The group executed production line technical modifications and scheduling optimizations, yielding capacity utilization rates of 101.3% in 2024 and 113.8% in 2025 against nominal designed capacities.
Table Core Product Line Operational Trajectory — Phosphate-Based Cathode Materials (LFP) Capacity, Production, and Sales Performance (FY2023–Q1 FY2026)
Average Selling Price (ASP) contracted 61.4% in 2024 to $4,349.53/t (RMB 31,262/t) and 4.8% in 2025 to $4,149.06/t (RMB 29,821/t) due to spot battery-grade lithium carbonate dropping from over RMB 600,000/t in 2022 to RMB 76,000/t in 2025. Following a spot lithium carbonate rebound to RMB 163,000/t, Q1 2026 ASP expanded 64.5% year-over-year to $6,847.44/t (RMB 49,216/t). Formulaic monthly price linkages pegged to Shanghai Nonferrous Metals (SMM) indices shifted material volatility downstream.
Table Unit Economics and Pricing Dynamics of LFP Cathode Materials (FY2023–Q1 FY2026)
Group top-line revenue rebounded 53.2% in FY 2025 to $4,817.36M after dropping 45.4% in FY 2024 to $3,144.14M, subsequently recording $2,082.15M in Q1 2026. Phosphate-based cathode material generated 97.9% to 99.4% of consolidated revenue, while the remainder comprised manufacturing by-products and surplus material recovery.
Table Consolidated Revenue Breakdown by Product Category and Geographic Market (FY2023–Q1 FY2026)
Table Earnings Quality, Government Support, and Effective Tax Rate Reconciliation (FY2023–Q1 FY2026)
Value Chain Ecosystem, Customer Alliances, and Working Capital Mechanics
The downstream buyer ecosystem is anchored by Contemporary Amperex Technology Co., Limited (CATL) and BYD Company Limited (BYD), which hold respective pre-IPO equity stakes of 6.03% and under 5.00%. Both entities maintain dual roles as principal equity partners, primary off-takers, and upstream suppliers of raw lithium carbonate. The aggregate revenue concentration of the Top 5 customers moderated from 96.1% in FY 2023 to 63.6% in Q1 2026 as shipments broadened across EVE Energy Co., Ltd., Xiamen Hithium Energy Storage Technology Co., Ltd., REPT BATTERO Energy Co., Ltd., Envision AESC, and Sunwoda Electronic Co., Ltd.
Table Top Five Customer Revenue Concentration and Dependency Trend Analysis (FY2023–Q1 FY2026)
Upstream material procurement relies on lithium carbonate, representing 53.5% of total product cost in FY 2025. Top 5 supplier procurement concentration dropped from 75.5% in FY 2023 to 37.0% in Q1 2026. Sourcing includes bilateral agreements with SQM S.A. (Supplier E), lithium futures trading on the Guangzhou Futures Exchange (GFEX), and refining via subsidiary Hunan Yuneng Recycling Technology Co., Ltd., which holds 70,000 tons of operational battery-grade lithium carbonate processing capacity utilizing virgin ores and black mass.
Table Top Five Supplier Procurement Concentration and Supply Chain Diversification Analysis (FY2023–Q1 FY2026)
Working capital mismatch derives from an asymmetric credit cycle where Accounts Receivable (AR) turnover days (48 days in 2023, 80 days in 2024, 63 days in 2025, and 49 days in Q1 2026) persistently exceed Accounts Payable (AP) settlement windows (34 days in 2023, 36 days in 2024, 28 days in 2025, and 22 days in Q1 2026), generating a Net Working Capital gap of +27 to +44 days.
Table Working Capital Efficiency, Cash Flow Reconciliation, and Leverage Dynamics Analysis (FY2023–Q1 FY2026)
Hunan Yuneng funds capital expenditures by endorsing bank acceptance bills directly to construction and equipment vendors ($334.9M in 2023, $351.2M in 2024, and $419.3M in 2025). Adding back these non-cash bill transactions converts negative reported Operating Cash Flows (-$215.1M in FY 2025) into adjusted operational cash generations of +$206.2M in FY 2024 and +$204.2M in FY 2025. Total interest-bearing debt expanded to $1,784.1M by Q1 2026, offset by $793.7M in total liquid cash reserves following a net $658.4M (RMB 4.73B) private placement executed on the Shenzhen Stock Exchange in April 2026.
Manufacturing Infrastructure, Technical Moats, and International Expansion
Hunan Yuneng’s industrial layout consists of five primary domestic manufacturing bases totaling 5,348 mu of allocated industrial land, alongside captive mining rights and overseas expansion nodes.
Table Manufacturing Asset Footprint and Global Industrial Capacity Allocation Overview
Table Consolidated Process Energy Intensity and Greenhouse Gas Emissions Performance (FY2023–Q1 FY2026)
Synthesis is governed by the proprietary Double-Sintering Solid-Phase Iron Phosphate method. This process decomposes raw materials and expels carbon dioxide in the primary firing stage before fine regrinding, organic carbon introduction, and secondary lower-temperature sintering. The methodology achieves a mass-production compaction density of 2.6 g/cm³ or greater, compared to the 2.4 to 2.5 g/cm³ industry standard.
Table R&D Investment Profile and Technology Pipeline Architecture (FY2023–Q1 FY2026)
Capital allocation centers on two major construction pipelines:
* Guizhou New Battery Materials Mineral-Integrated Project: RMB 24.0 billion ($3.339 billion) budget across a 5-year schedule, adding 800,000 tpa LFP cathode and 1,000,000 tpa iron phosphate precursor capacity linked to captive extraction at the Huangjiapo and Dashichang phosphate mines.
* Spanish Production Facility (Yuneng International Spain): RMB 982 million ($136.6 million) budget, adding 50,000 tpa localized LFP capacity on a 467,300 sq.m. parcel. Environmental impact assessments and land leveling are complete ahead of commercial commissioning scheduled for 2027 to satisfy the EU Battery Regulation, the Net Zero Industry Act, and Carbon Border Adjustment Mechanism (CBAM) frameworks.
HDIN Institutional Verdict
Hunan Yuneng New Energy Battery Material Co., Ltd. demonstrates structural cost leadership within the global phosphate cathode sector. By pairing a 100% self-supplied iron phosphate precursor network with captive Guizhou phosphate mining rights, the group has decoupled its cost baseline from merchant precursor markups, preserving operational margins despite cyclical spot lithium swings.
Table Direct Material Cost Sensitivity Impact on Profit Before Tax (FY2023–Q1 FY2026)
Management's reliance on non-cash bank acceptance bill endorsements to fund capital asset deployment accounts for historical divergences between Net Profit and reported Operating Cash Flow. Downstream equity alignment with CATL and BYD anchors baseline capacity utilization, while capital allocation into the 50,000 tpa Spain facility establishes an operational hedge against Western protectionist legislation, including US Inflation Reduction Act (IRA) FEOC restrictions and EU localized content mandates.
Presentation Download & Video Access:
- Presentation Download: Click the PDF download link under 'Related Topics' to access the full institutional presentation of this report.
- Video Link: Click this link to watch the HDIN analyst briefing on YouTube.
About HDIN Research:
HDIN Research is a premier global market intelligence and strategic advisory firm specializing in institutional-grade financial analysis, supply chain audits, and macroeconomic forecasting. Our dedicated sector analysts deliver actionable, data-driven insights tailored for private equity, hedge funds, and corporate strategy teams. Visit us at http://www.hdinresearch.com.
2026 AI Transparency Footer:
"This intelligence report was authored by HDIN Research analysts following a rigorous audit of official corporate filings. AI was utilized for massive-scale data synthesis and structural drafting, ensuring 100% inclusion of reported data points. All strategic insights, financial modeling, and final verdicts were verified by our editorial board to ensure professional accuracy and compliance with 2026 Google Search E-E-A-T standards."
1. Hunan Yuneng New Energy Battery Material Co., Ltd. expanded global LFP cathode shipment share to 28.2% in 2025, lifting actual sales volume 60.0% year-over-year to 1,137.1 kt.
2. Vertical integration reached 100% in-house iron phosphate precursor self-sufficiency by 2024, expanding Q1 2026 gross margin to 16.1% with unit gross margin reaching $1,105.01 per ton.
3. Execution of the $3.339 billion Guizhou mine-to-market project and the $136.6 million Spain facility directly mitigates upstream lithium carbonate volatility and Western regulatory trade barriers.
Figure Hunan Yuneng Institutional Equity Analysis - Global LFP Market Dominance & Vertical integration Moat
Operational Performance, Pricing Dynamics, and Segment TrajectoryHunan Yuneng New Energy Battery Material Co., Ltd. operates as the world's largest supplier of lithium iron phosphate (LFP) cathode materials, commanding a 28.2% global market share in 2025 across an aggregate completed annual operating capacity of 1.30 million metric tons as of March 31, 2026. The group executed production line technical modifications and scheduling optimizations, yielding capacity utilization rates of 101.3% in 2024 and 113.8% in 2025 against nominal designed capacities.
Table Core Product Line Operational Trajectory — Phosphate-Based Cathode Materials (LFP) Capacity, Production, and Sales Performance (FY2023–Q1 FY2026)
| Metric | FY2023 | FY2024 | FY2025 | Q1 FY2025 (Unaudited) | Q1 FY2026 (Unaudited) |
|---|---|---|---|---|---|
| Designed Annual Capacity (kt) | 561.9 | 726.0 | 994.5 | 211.8 | 334.5 |
| Actual Production Volume (kt) | 504.4 | 735.5 | 1,131.3 | 224.7 | 303.7 |
| Capacity Utilization Rate (%) | 89.8% | 101.3% | 113.8% | 106.1% | 90.8% |
| Actual Sales Volume (kt) | 506.8 | 710.6 | 1,137.1 | 222.6 | 298.8 |
Average Selling Price (ASP) contracted 61.4% in 2024 to $4,349.53/t (RMB 31,262/t) and 4.8% in 2025 to $4,149.06/t (RMB 29,821/t) due to spot battery-grade lithium carbonate dropping from over RMB 600,000/t in 2022 to RMB 76,000/t in 2025. Following a spot lithium carbonate rebound to RMB 163,000/t, Q1 2026 ASP expanded 64.5% year-over-year to $6,847.44/t (RMB 49,216/t). Formulaic monthly price linkages pegged to Shanghai Nonferrous Metals (SMM) indices shifted material volatility downstream.
Table Unit Economics and Pricing Dynamics of LFP Cathode Materials (FY2023–Q1 FY2026)
| Indicator | FY2023 | FY2024 | FY2025 | Q1 FY2025 (Unaudited) | Q1 FY2026 (Unaudited) |
|---|---|---|---|---|---|
| Average Selling Price (ASP) per Ton (USD/t) | $11,284.66 | $4,349.53 | $4,149.06 | $4,158.51 | $6,847.44 |
| Average Selling Price (ASP) per Ton (RMB/t) | ¥81,108 | ¥31,262 | ¥29,821 | ¥29,889 | ¥49,216 |
| Unit Cost of Sales (USD/t) | $10,552.48 | $4,024.07 | $3,782.14 | $3,941.04 | $5,742.43 |
| Unit Cost of Sales (RMB/t) | ¥75,846 | ¥28,923 | ¥27,184 | ¥28,326 | ¥41,274 |
| Unit Gross Margin (USD/t) | $732.18 | $325.46 | $366.91 | $217.47 | $1,105.01 |
| Unit Gross Margin (RMB/t) | ¥5,263 | ¥2,339 | ¥2,637 | ¥1,563 | ¥7,942 |
| Segment Gross Margin (%) | 6.5% | 7.5% | 8.8% | 5.2% | 16.1% |
Group top-line revenue rebounded 53.2% in FY 2025 to $4,817.36M after dropping 45.4% in FY 2024 to $3,144.14M, subsequently recording $2,082.15M in Q1 2026. Phosphate-based cathode material generated 97.9% to 99.4% of consolidated revenue, while the remainder comprised manufacturing by-products and surplus material recovery.
Table Consolidated Revenue Breakdown by Product Category and Geographic Market (FY2023–Q1 FY2026)
| Segment | FY2023 | FY2024 | FY2025 | Q1 FY2025 (Unaudited) | Q1 FY2026 (Unaudited) |
|---|---|---|---|---|---|
| Phosphate-Based Cathode Materials (LFP) | $5,719.06 | $3,090.78 | $4,717.89 | $925.68 | $2,046.02 |
| Product Revenue Share (%) | 99.4% | 98.3% | 97.9% | 98.4% | 98.3% |
| Other Products (By-products / Scrap) | $35.05 | $53.37 | $99.47 | $15.14 | $36.13 |
| Product Revenue Share (%) | 0.6% | 1.7% | 2.1% | 1.6% | 1.7% |
| Mainland China Market | $5,753.18 | $3,142.43 | $4,777.77 | $940.50 | $2,012.55 |
| Geographic Revenue Share (%) | 99.98% | 99.95% | 99.18% | 99.97% | 96.66% |
| Overseas and Other Markets | $0.93 | $1.72 | $39.59 | $0.31 | $69.59 |
| Geographic Revenue Share (%) | 0.02% | 0.05% | 0.82% | 0.03% | 3.34% |
| Total Group Revenue | $5,754.11 | $3,144.14 | $4,817.36 | $940.82 | $2,082.15 |
Table Earnings Quality, Government Support, and Effective Tax Rate Reconciliation (FY2023–Q1 FY2026)
| Metric | FY2023 | FY2024 | FY2025 | Q1 FY2026 (Unaudited) | Status / Classification |
|---|---|---|---|---|---|
| Profit Before Tax (PBT) | $260.83 | $98.20 | $204.86 | $229.11 | Reported |
| Consolidated Net Profit | $219.90 | $82.08 | $176.29 | $189.14 | Reported |
| Income Tax Expense | $40.93 | $16.12 | $28.57 | $39.97 | Approx. 15% Tax Shield |
| Effective Tax Rate (%) | 15.69% | 16.42% | 13.95% | 17.44% | Preferential Tax Treatment |
| Total Government Subsidies | $11.34 | $7.44 | $9.28 | $3.49 | P&L Recognition |
| Subsidies / Net Profit (%) | 5.16% | 9.06% | 5.26% | 1.85% | Declining Contribution |
| VAT Input Credit Concessions | $5.68 | $3.00 | $(5.62) | $0.06 | 2025 Reversal Impact |
| R&D Tax Super-Deductions | $4.20 | $3.31 | $4.02 | $2.18 | Direct Tax Deduction |
Value Chain Ecosystem, Customer Alliances, and Working Capital Mechanics
The downstream buyer ecosystem is anchored by Contemporary Amperex Technology Co., Limited (CATL) and BYD Company Limited (BYD), which hold respective pre-IPO equity stakes of 6.03% and under 5.00%. Both entities maintain dual roles as principal equity partners, primary off-takers, and upstream suppliers of raw lithium carbonate. The aggregate revenue concentration of the Top 5 customers moderated from 96.1% in FY 2023 to 63.6% in Q1 2026 as shipments broadened across EVE Energy Co., Ltd., Xiamen Hithium Energy Storage Technology Co., Ltd., REPT BATTERO Energy Co., Ltd., Envision AESC, and Sunwoda Electronic Co., Ltd.
Table Top Five Customer Revenue Concentration and Dependency Trend Analysis (FY2023–Q1 FY2026)
| Counterparty | FY2023 | FY2024 | FY2025 | Q1 FY2026 (Unaudited) | Client Status |
|---|---|---|---|---|---|
| CATL (Company A / Customer B) | $2,177.08 | $860.31 | $1,432.31 | $574.02 | 6.03% Equity Stake; Tier-1 Strategic Customer |
| Revenue Share (%) | 37.8% | 27.4% | 29.7% | 27.6% | — |
| BYD (Company B / Customer A) | $2,357.89 | $977.19 | $832.18 | $223.18 | <5% Equity Stake; Tier-1 Strategic Customer |
| Revenue Share (%) | 41.0% | 31.1% | 17.3% | 10.7% | — |
| EVE Energy (Company C) | $350.53 | $283.99 | $520.88 | $194.91 | Tier-1 Domestic Customer |
| Revenue Share (%) | 6.1% | 9.0% | 10.8% | 9.4% | — |
| Client E / G (Hithium / REPT) | $338.94 | $255.73 | $328.34 | $165.01 | Energy Storage System (ESS) / Power Battery Segment |
| Revenue Share (%) | 5.9% | 8.1% | 6.8% | 7.9% | Scaling Customer |
| Company D / Client F | $306.02 | $181.06 | $324.99 | $165.66 | Automotive / Power Battery Applications |
| Revenue Share (%) | 5.3% | 5.8% | 6.7% | 8.0% | Multi-Client Expansion |
Upstream material procurement relies on lithium carbonate, representing 53.5% of total product cost in FY 2025. Top 5 supplier procurement concentration dropped from 75.5% in FY 2023 to 37.0% in Q1 2026. Sourcing includes bilateral agreements with SQM S.A. (Supplier E), lithium futures trading on the Guangzhou Futures Exchange (GFEX), and refining via subsidiary Hunan Yuneng Recycling Technology Co., Ltd., which holds 70,000 tons of operational battery-grade lithium carbonate processing capacity utilizing virgin ores and black mass.
Table Top Five Supplier Procurement Concentration and Supply Chain Diversification Analysis (FY2023–Q1 FY2026)
| Supplier / Node | FY2023 | FY2024 | FY2025 | Q1 FY2026 (Unaudited) | Core Input / Supply Role |
|---|---|---|---|---|---|
| BYD (Company B) | $1,601.93 | $479.94 | $435.69 | $112.21 | Lithium Carbonate (Li₂CO₃); Supply Chain Overlap |
| Procurement Share (%) | 36.4% | 18.9% | 12.0% | 6.5% | — |
| CATL (Company A) | $1,058.38 | $115.77 | $0.00 | $132.10 | Lithium Carbonate (Li₂CO₃); Supply Chain Overlap |
| Procurement Share (%) | 24.0% | 4.6% | 0.0% | 7.7% | — |
| Supplier E (SQM Chile) | $503.15 | $353.81 | $296.13 | $152.06 | Brine Lithium Resources; Overseas Supply |
| Procurement Share (%) | 11.4% | 14.0% | 8.2% | 8.8% | — |
| Supplier H / F | $70.29 | $155.79 | $156.73 | $115.92 | Spodumene / Lithium Raw Materials; Merchant Supply |
| Procurement Share (%) | 1.6% | 6.1% | 4.3% | 6.7% | — |
| Supplier K / J / I / G | $93.05 | $113.08 | $143.24 | $111.21 | Lithium Carbonate (Li₂CO₃); Merchant Supply |
| Procurement Share (%) | 2.1% | 4.5% | 3.9% | 6.5% | — |
Working capital mismatch derives from an asymmetric credit cycle where Accounts Receivable (AR) turnover days (48 days in 2023, 80 days in 2024, 63 days in 2025, and 49 days in Q1 2026) persistently exceed Accounts Payable (AP) settlement windows (34 days in 2023, 36 days in 2024, 28 days in 2025, and 22 days in Q1 2026), generating a Net Working Capital gap of +27 to +44 days.
Table Working Capital Efficiency, Cash Flow Reconciliation, and Leverage Dynamics Analysis (FY2023–Q1 FY2026)
| Metric | FY2023 | FY2024 | FY2025 | Q1 FY2026 (Unaudited) | Benchmark / Analytical Note |
|---|---|---|---|---|---|
| Cash Conversion Cycle (CCC) | 44 days | 80 days | 72 days | 58 days | Working capital pressure increased in FY2024 |
| Reported Operating Cash Flow | $69.7M | $(145.0)M | $(215.1)M | $(145.4)M | Divergence from reported profitability |
| Non-Cash Bill-Endorsed Capital Expenditure | $334.9M | $351.2M | $419.3M | $135.4M | Off-cash financing structure |
| Adjusted Operating Cash Flow | $404.6M | $206.2M | $204.2M | $(10.0)M | Underlying cash generation profile |
| Gearing Ratio (Liabilities / Assets) | 57.8% | 61.6% | 66.9% | 61.2% | Elevated leverage; supported by RMB 658M equity base |
| Derecognized Bank Bills | $1,481.99M | $920.87M | $1,820.85M | $2,343.83M | Excluded from balance sheet recognition |
| Recognized Recourse Notes | $32.31M | $75.29M | $203.15M | $250.75M | Included in other current liabilities |
| Bill Discounting P&L Charges | $6.64M | $1.16M | $5.60M | $2.55M | Financing-related expense impact |
| Contractual Capital Expenditure Commitments | $60.35M | $274.76M | $279.72M | $277.15M | Future PP&E investment obligations |
Hunan Yuneng funds capital expenditures by endorsing bank acceptance bills directly to construction and equipment vendors ($334.9M in 2023, $351.2M in 2024, and $419.3M in 2025). Adding back these non-cash bill transactions converts negative reported Operating Cash Flows (-$215.1M in FY 2025) into adjusted operational cash generations of +$206.2M in FY 2024 and +$204.2M in FY 2025. Total interest-bearing debt expanded to $1,784.1M by Q1 2026, offset by $793.7M in total liquid cash reserves following a net $658.4M (RMB 4.73B) private placement executed on the Shenzhen Stock Exchange in April 2026.
Manufacturing Infrastructure, Technical Moats, and International Expansion
Hunan Yuneng’s industrial layout consists of five primary domestic manufacturing bases totaling 5,348 mu of allocated industrial land, alongside captive mining rights and overseas expansion nodes.
Table Manufacturing Asset Footprint and Global Industrial Capacity Allocation Overview
| Manufacturing Location | Land Area | Strategic Role and Core Operations |
|---|---|---|
| Xiangtan Base (Hunan) | 329 mu | Corporate headquarters, R&D laboratories, CNAS-certified testing facilities, and LFP cathode material production lines |
| Xiangxiang Base (Hunan) | 423 mu | LFP cathode material processing and iron phosphate (FePO₄) precursor production operations |
| Suining Base (Sichuan) | 767 mu | Integrated LFP cathode material and FePO₄ precursor manufacturing facility |
| Fuquan Base (Guizhou) | 2,220 mu | Large-scale integrated production hub adjacent to Huangjiapo and Dashichang industrial resources |
| Anning Base (Yunnan) | 1,609 mu | Large-scale LFP cathode synthesis and upstream precursor refining operations |
| Spain Base (Europe S.L.) | 467,300 m² | Localized European LFP manufacturing facility with planned 50,000 tpa capacity commissioning in 2027 |
| Singapore Hub (PTE Ltd.) | Capital / Corporate Hub | Global procurement coordination, international logistics management, and foreign exchange settlement |
Table Consolidated Process Energy Intensity and Greenhouse Gas Emissions Performance (FY2023–Q1 FY2026)
| Utility / Emission Indicator | FY 2023 | FY 2024 | FY 2025 | Q1 2026 (Unaudited) | Unit Metric |
|---|---|---|---|---|---|
| Actual LFP Production | 504,400 | 735,500 | 1,131,300 | 303,700 | Metric Tons |
| Purchased Grid Electricity | 1,900.23 | 2,635.07 | 4,202.38 | 1,095.57 | Million kWh |
| Electricity Intensity | 3,767.31 | 3,582.69 | 3,714.65 | 3,607.41 | kWh / ton LFP |
| Natural Gas Consumption | 258.74 | 338.90 | 459.20 | 125.15 | Million m³ |
| Natural Gas Intensity | 512.97 | 460.78 | 405.91 | 412.10 | m³ / ton LFP |
| Total Comprehensive Energy Consumption | 548,243.73 | 736,065.44 | 1,075,405.90 | 287,128.17 | tce |
| Total Energy Intensity | 1.09 | 1.00 | 0.95 | 0.95 | tce / ton LFP |
| Direct Renewable Grid Share | 60.72% | 50.81% | 54.94% | 33.60% | % of Physical Grid Electricity |
| Consolidated Green Power Utilization | — | — | 65.28% | — | Including Green Certificates |
| Scope 1 GHG Emissions | 720,393.94 | 957,161.69 | 1,271,009.20 | 332,767.00 | tCO₂e |
| Scope 2 GHG Emissions | 1,008,262.70 | 1,398,168.20 | 2,229,781.80 | 581,307.64 | tCO₂e |
| Scope 3 GHG Emissions | 2,891,498.50 | 4,264,201.70 | 8,431,570.20 | N/A | tCO₂e |
| GHG Emissions Intensity (Scope 1 + Scope 2) | 3.43 | 3.20 | 3.09 | 3.01 | tCO₂e / ton LFP |
Synthesis is governed by the proprietary Double-Sintering Solid-Phase Iron Phosphate method. This process decomposes raw materials and expels carbon dioxide in the primary firing stage before fine regrinding, organic carbon introduction, and secondary lower-temperature sintering. The methodology achieves a mass-production compaction density of 2.6 g/cm³ or greater, compared to the 2.4 to 2.5 g/cm³ industry standard.
Table R&D Investment Profile and Technology Pipeline Architecture (FY2023–Q1 FY2026)
| R&D Profile Indicator | FY 2023 | FY 2024 | FY 2025 | Q1 2026 (Unaudited) | Accounting Classification |
|---|---|---|---|---|---|
| Expensed R&D Expenditure (USD Million) | $49.83 | $40.56 | $52.99 | $25.11 | 100% Expensed |
| R&D Capitalization Ratio | 0.0% | 0.0% | 0.0% | 0.0% | No Capitalization |
| Direct Materials Used in R&D | 76.4% | 60.4% | 67.7% | 80.3% | Pilot-Scale Validation |
| R&D Personnel Headcount | — | — | — | 683 | 8.1% of Total Workforce |
| Domestic Issued Patents | — | — | — | 167 | Including 97 Invention Patents |
Capital allocation centers on two major construction pipelines:
* Guizhou New Battery Materials Mineral-Integrated Project: RMB 24.0 billion ($3.339 billion) budget across a 5-year schedule, adding 800,000 tpa LFP cathode and 1,000,000 tpa iron phosphate precursor capacity linked to captive extraction at the Huangjiapo and Dashichang phosphate mines.
* Spanish Production Facility (Yuneng International Spain): RMB 982 million ($136.6 million) budget, adding 50,000 tpa localized LFP capacity on a 467,300 sq.m. parcel. Environmental impact assessments and land leveling are complete ahead of commercial commissioning scheduled for 2027 to satisfy the EU Battery Regulation, the Net Zero Industry Act, and Carbon Border Adjustment Mechanism (CBAM) frameworks.
HDIN Institutional Verdict
Hunan Yuneng New Energy Battery Material Co., Ltd. demonstrates structural cost leadership within the global phosphate cathode sector. By pairing a 100% self-supplied iron phosphate precursor network with captive Guizhou phosphate mining rights, the group has decoupled its cost baseline from merchant precursor markups, preserving operational margins despite cyclical spot lithium swings.
Table Direct Material Cost Sensitivity Impact on Profit Before Tax (FY2023–Q1 FY2026)
| Reporting Period | Direct Materials Expenditure (USD Million) | ±1% Standalone Cost Shift Impact | ±5% Standalone Cost Shift Impact |
|---|---|---|---|
| FY 2023 | $4,739.93 | ±$47.40 | ±$237.00 |
| FY 2024 | $2,172.48 | ±$21.72 | ±$108.62 |
| FY 2025 | $3,239.16 | ±$32.39 | ±$161.96 |
| Q1 2026 (3 Months) | $1,420.97 | ±$14.21 | ±$71.05 |
Management's reliance on non-cash bank acceptance bill endorsements to fund capital asset deployment accounts for historical divergences between Net Profit and reported Operating Cash Flow. Downstream equity alignment with CATL and BYD anchors baseline capacity utilization, while capital allocation into the 50,000 tpa Spain facility establishes an operational hedge against Western protectionist legislation, including US Inflation Reduction Act (IRA) FEOC restrictions and EU localized content mandates.
Presentation Download & Video Access:
- Presentation Download: Click the PDF download link under 'Related Topics' to access the full institutional presentation of this report.
- Video Link: Click this link to watch the HDIN analyst briefing on YouTube.
About HDIN Research:
HDIN Research is a premier global market intelligence and strategic advisory firm specializing in institutional-grade financial analysis, supply chain audits, and macroeconomic forecasting. Our dedicated sector analysts deliver actionable, data-driven insights tailored for private equity, hedge funds, and corporate strategy teams. Visit us at http://www.hdinresearch.com.
2026 AI Transparency Footer:
"This intelligence report was authored by HDIN Research analysts following a rigorous audit of official corporate filings. AI was utilized for massive-scale data synthesis and structural drafting, ensuring 100% inclusion of reported data points. All strategic insights, financial modeling, and final verdicts were verified by our editorial board to ensure professional accuracy and compliance with 2026 Google Search E-E-A-T standards."