SanDisk Corporation: AI Hyperscale Pivot Near Japanese JV Hubs Yields $11.5B FCF Turnaround as Operating Margin Hits 61.3%
Date : 2026-08-19
Reading : 405
HDIN Executive Takeaways
1. SanDisk Corporation [NASDAQ: SNDK] executed a complete financial turnaround in FY2026, delivering net revenue of $20,248 million (+175.3% YoY) and GAAP operating income of $12,389 million (+8,000 bps operating margin expansion to 61.3%), driven by explosive 436.8% Datacenter expansion.
2. Production concentration remains acute across the Yokkaichi and Kitakami joint-venture fabrication hubs in Japan alongside backend operations in Penang, Malaysia, with Asian customer destinations absorbing 70.34% of net revenues.
3. Free cash flow surged to $11,494 million supported by $2.59 billion in upfront New Business Model customer deposits and advances, securing a committed multi-year contractual backlog of $91.1 billion that structurally buffers memory cycle volatility.
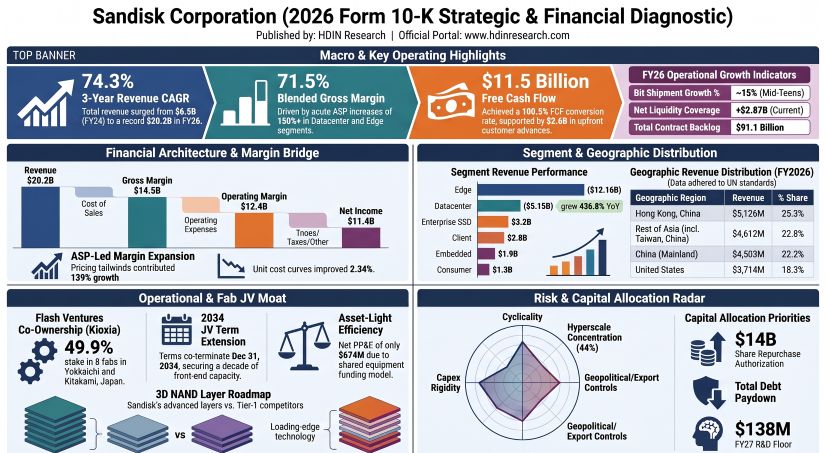
Figure Sandisk Corporation 2026 Form 10-K Strategic & Financial Diagnostic
 Segment Performance and Margin Architecture
SanDisk Corporation completed its separation from Western Digital Corporation on February 21, 2025, operating as a single reportable operating segment disaggregated across three end markets: Datacenter, Edge, and Consumer.
Table Revenue Distribution by Business Line and End Market (FY2024–FY2026)
Datacenter bit shipments rose by almost 120% alongside an ASP expansion of almost 150%. Edge bit shipments grew in high single digits with ASP rising almost 180%. Consumer revenue expansion was purely price-driven (+low-fifties percent ASP) offsetting a mid-teens percent bit decline.
Table Financial Performance Overview and Profitability Transformation (FY2024–FY2026)
Gross margin surged 4,140 bps to 71.5%, driven by an implied blended ASP growth of 139.39% against a 2.34% implied unit cost reduction. Manufacturing underutilization charges at Flash Ventures declined to $11 million from $75 million in FY2025 ($249 million in FY2024), while inventory write-downs increased to $91 million ($45 million in FY2025).
Non-GAAP Adjusted EBITDA reconciles FY2026 GAAP Operating Income of $12,389 million by adding:
* Depreciation and amortization: $149 million
* Stock-based compensation: $232 million
* Restructuring credits: $(2) million
* Business separation costs: $25 million
* Divestiture loss adjustment: $10 million
* Debt extinguishment loss: $46 million
Table Geographic Revenue Distribution and Growth Profile by Ship-to Destination (FY2024–FY2026)
Global Production Footprint and Joint-Venture Moats
SanDisk Corporation relies on a shared-wafer joint-venture model across eight clean-room fabs via Flash Ventures (49.9% SanDisk equity, 50.1% Kioxia Corporation):
* Yokkaichi Hub, Japan: Fabs Y3 (300mm, 2004), Y4 (300mm, 2006), Y5 (300mm, two-phase, 2010), New Y2 (2016 3D transition), Y6 (2018 3D capacity), and Y7 (January 2022).
* Kitakami Hub, Japan: Fab K1 (2019) and Fab K2 (operational wafer output commenced FY2026).
* Shared-Fab Economics: SanDisk pays 50% of Flash Ventures' total fixed operating costs regardless of wafer volume taken, plus variable costs on a 3-month binding rolling forecast. On January 29, 2026, JV terms were aligned to co-terminate on December 31, 2034. SanDisk is committed to $1.2 billion in cash payments to Kioxia from 2026 to 2029 under the Agreement to Enhance Collaboration.
* Backend Assembly & Test: Centered at an owned 1,177,000 sq ft facility in Penang, Malaysia. On September 28, 2024, SanDisk sold 80% of SanDisk Semiconductor Shanghai (SDSS) to JCET for $659 million (retaining 20%), committing to a 5-year Supply Agreement with a $550 million minimum annual purchase commitment ($519 million actual purchases in FY2026).
* Strategic DRAM Sourcing: Addressing its NAND-only architecture deficit, SanDisk acquired a 3.9% stake (139 million shares) in Nanya Technology Corporation for $970 million on March 25, 2026, paired with a long-term supply agreement totaling $5,892 million in purchase commitments through 2031 ($926 million in FY2027).
* Global R&D Layout: Milpitas HQ (578,000 sq ft) and Irvine (105,000 sq ft), California; Longmont and Rochester (76,000 sq ft); Hsinchu, Taichung, and Taipei (40,000 sq ft); Beijing and Shenzhen (11,000 sq ft); Fujisawa, Japan (23,000 sq ft owned); Bangalore, India (108,000 sq ft); Kfar Saba, Tefen, and Omer, Israel (301,000 sq ft); Prague, Czech Republic (5,000 sq ft). Minimum joint R&D commitment with Kioxia is $138 million for FY2027.
Table Contractual Cash Obligations and Liquidity Position Analysis (FY2027–Beyond 2031)
SanDisk fully repaid its $2.0 billion Term Loan on March 4, 2026, leaving $0 debt on the balance sheet. Liquid reserves include $4,762 million in cash ($2,879 million held internationally) and an undrawn $1,500 million credit facility maturing February 21, 2030. Nanya Technology marketable equity is carried at $1,777 million under a 3-year statutory lock-up. Building depreciation prepayments include $840 million in uncredited balances and $402 million in future commitments ($118 million in FY2027). Flash Ventures lease guarantees total ¥149.0 billion ($923 million).
HDIN Institutional Verdict
HDIN Research's forensic audit reveals that while SanDisk Corporation's 102.1% Operating Cash Flow conversion ($11,671 million OCF / $11,433 million Net Income) appears peer-leading, the working capital engine was structurally supported by $2.59 billion in upfront customer collections under New Business Model (NBM) agreements ($1,374 million incremental refund liabilities/security deposits and $1,217 million incremental contract liabilities/advances). Absent this upfront liquidity, OCF would have absorbed a $4,259 million operational drag from receivables float (-$3,640 million) and inventory builds (-$619 million).
Table Inventory Composition and Year-over-Year Change Analysis (FY2025–FY2026)
Operational duration metrics highlight emerging de-linking:
* Cash Conversion Cycle (CCC): Expanded by 26 days to 162 days in FY2026 (DSO improved 3 days to 48; DPO extended 14 days to 64; DIO deteriorated 43 days to 178).
* Working Capital Concentration: Raw materials comprise 71.83% of inventory due to 50% fixed-cost absorption mandates at Flash Ventures.
* Accounts Receivable Concentration: 41.0% ($1,930.3 million) of the $4,708 million gross AR is owed by three counterparties (Customer A: 19%, Customer B: 12%, Customer C: 10%), with zero receivables factored in FY2026 ($339 million in FY2024).
The NBM structure provides commercial protection: secured remaining performance obligations reached $59.8 billion ($58.7 billion unbilled, ~19% or $11.36 billion converting in FY2027), with two post-balance sheet contracts expanding total backlog to $91.1 billion, backed by $5.0 billion in third-party collateral.
However, institutional risk models must discount three critical medium-term variables:
1. Effective Tax Rate Normalization: FY2026 GAAP ETR of 12.0% ($1,584 million provision on $13,017 million pre-tax income) and cash tax rate of 1.12% ($146 million cash paid) are shielded by Malaysian tax holidays ($492 million benefit, $3.18/share) expiring progressively from 2028 to 2031, compounded by Corporate Alternative Minimum Tax (CAMT) onset in FY2027 and $128 million in Western Digital Corporation tax indemnification liabilities.
2. 2028 Talent Retention Cliff: Post-spin stock appreciation of 4,847.22% creates an executive retention vulnerability when unvested equity awards vest in February and September 2028.
3. JV Fixed-Cost Operating Beta: SanDisk's 50% fixed-cost liability across Kioxia fabs exposes margins to unabsorbed overhead penalties whenever industry fab utilization cuts occur.
Presentation Download & Video Access:
- Presentation Download: Click the PDF download link under 'Related Topics' to access the full institutional presentation of this report.
- Video Link: Click this link to watch the HDIN analyst briefing on YouTube.
About HDIN Research:
HDIN Research is a premier global market intelligence and strategic advisory firm specializing in institutional-grade financial analysis, supply chain audits, and macroeconomic forecasting. Our dedicated sector analysts deliver actionable, data-driven insights tailored for private equity, hedge funds, and corporate strategy teams. Visit us at http://www.hdinresearch.com.
2026 AI Transparency Footer:
"This intelligence report was authored by HDIN Research analysts following a rigorous audit of official corporate filings. AI was utilized for massive-scale data synthesis and structural drafting, ensuring 100% inclusion of reported data points. All strategic insights, financial modeling, and final verdicts were verified by our editorial board to ensure professional accuracy and compliance with 2026 Google Search E-E-A-T standards."
1. SanDisk Corporation [NASDAQ: SNDK] executed a complete financial turnaround in FY2026, delivering net revenue of $20,248 million (+175.3% YoY) and GAAP operating income of $12,389 million (+8,000 bps operating margin expansion to 61.3%), driven by explosive 436.8% Datacenter expansion.
2. Production concentration remains acute across the Yokkaichi and Kitakami joint-venture fabrication hubs in Japan alongside backend operations in Penang, Malaysia, with Asian customer destinations absorbing 70.34% of net revenues.
3. Free cash flow surged to $11,494 million supported by $2.59 billion in upfront New Business Model customer deposits and advances, securing a committed multi-year contractual backlog of $91.1 billion that structurally buffers memory cycle volatility.
Figure Sandisk Corporation 2026 Form 10-K Strategic & Financial Diagnostic
Segment Performance and Margin ArchitectureSanDisk Corporation completed its separation from Western Digital Corporation on February 21, 2025, operating as a single reportable operating segment disaggregated across three end markets: Datacenter, Edge, and Consumer.
Table Revenue Distribution by Business Line and End Market (FY2024–FY2026)
| Business Line / End Market | FY2024 Revenue ($M) | FY2024 Share (%) | FY2025 Revenue ($M) | FY2025 Share (%) | FY2025 YoY (%) | FY2026 Revenue ($M) | FY2026 Share (%) | FY2026 YoY (%) |
| Datacenter | 325 | 4.88% | 960 | 13.05% | +195.38% | 5,153 | 25.45% | +436.77% |
| Edge | 4,069 | 61.07% | 4,127 | 56.11% | +1.43% | 12,160 | 60.06% | +194.65% |
| Consumer | 2,269 | 34.05% | 2,268 | 30.84% | -0.04% | 2,935 | 14.50% | +29.41% |
| Total Net Revenue | 6,663 | 100.00% | 7,355 | 100.00% | +10.39% | 20,248 | 100.00% | +175.30% |
Datacenter bit shipments rose by almost 120% alongside an ASP expansion of almost 150%. Edge bit shipments grew in high single digits with ASP rising almost 180%. Consumer revenue expansion was purely price-driven (+low-fifties percent ASP) offsetting a mid-teens percent bit decline.
Table Financial Performance Overview and Profitability Transformation (FY2024–FY2026)
| Financial Metric | FY2024 ($M) | FY2025 ($M) | FY2026 ($M) | YoY Change (FY25–FY26) |
| Total Revenue | 6,663 | 7,355 | 20,248 | +175.3% |
| Gross Profit | 1,072 | 2,212 | 14,472 | +554.3% |
| Gross Margin (%) | 16.1% | 30.1% | 71.5% | +4,140 bps |
| Operating Income (Loss) | (468) | (1,377) | 12,389 | Turnaround |
| Operating Margin (%) | -7.0% | -18.7% | 61.3% | +8,000 bps |
| EBITDA Non-GAAP | (244) | (1,214) | 12,538 | Turnaround |
| Adjusted EBITDA Non-GAAP | (71) | 852 | 12,849 | +1,408.1% |
| Net Income (Loss) | (672) | (1,641) | 11,433 | Turnaround |
| Operating Cash Flow | (309) | 84 | 11,671 | +13,794.0% |
| Capital Expenditures | 166 | 204 | 177 | -13.2% |
| Free Cash Flow | (475) | (120) | 11,494 | Turnaround |
| ROIC (Definition A: Debt + Equity - Cash) | -5.83% | -15.95% | 99.35% | +115.30% pts |
| ROIC (Definition B: Assets - Non-Debt CL) | N/A | -13.20% | 64.41% | +77.61% pts |
Gross margin surged 4,140 bps to 71.5%, driven by an implied blended ASP growth of 139.39% against a 2.34% implied unit cost reduction. Manufacturing underutilization charges at Flash Ventures declined to $11 million from $75 million in FY2025 ($249 million in FY2024), while inventory write-downs increased to $91 million ($45 million in FY2025).
Non-GAAP Adjusted EBITDA reconciles FY2026 GAAP Operating Income of $12,389 million by adding:
* Depreciation and amortization: $149 million
* Stock-based compensation: $232 million
* Restructuring credits: $(2) million
* Business separation costs: $25 million
* Divestiture loss adjustment: $10 million
* Debt extinguishment loss: $46 million
Table Geographic Revenue Distribution and Growth Profile by Ship-to Destination (FY2024–FY2026)
| Geographic Region (Ship-to Destination) | FY2024 Revenue ($M) | FY2024 Share (%) | FY2025 Revenue ($M) | FY2025 Share (%) | FY2026 Revenue ($M) | FY2026 Share (%) | FY2026 YoY (%) |
| Hong Kong, China | 1,044 | 15.67% | 1,301 | 17.69% | 5,126 | 25.32% | +294.00% |
| Rest of Asia (incl. Taiwan, China) | 917 | 13.76% | 1,116 | 15.17% | 4,612 | 22.78% | +313.26% |
| China (Mainland) | 2,549 | 38.26% | 2,040 | 27.74% | 4,503 | 22.24% | +120.74% |
| United States | 933 | 14.00% | 1,447 | 19.67% | 3,714 | 18.34% | +156.67% |
| Europe, Middle East, Africa | 1,058 | 15.88% | 1,280 | 17.40% | 1,732 | 8.55% | +35.31% |
| Other | 162 | 2.43% | 171 | 2.32% | 561 | 2.77% | +228.07% |
| Total Net Revenue | 6,663 | 100.00% | 7,355 | 100.00% | 20,248 | 100.00% | +175.30% |
Global Production Footprint and Joint-Venture Moats
SanDisk Corporation relies on a shared-wafer joint-venture model across eight clean-room fabs via Flash Ventures (49.9% SanDisk equity, 50.1% Kioxia Corporation):
* Yokkaichi Hub, Japan: Fabs Y3 (300mm, 2004), Y4 (300mm, 2006), Y5 (300mm, two-phase, 2010), New Y2 (2016 3D transition), Y6 (2018 3D capacity), and Y7 (January 2022).
* Kitakami Hub, Japan: Fab K1 (2019) and Fab K2 (operational wafer output commenced FY2026).
* Shared-Fab Economics: SanDisk pays 50% of Flash Ventures' total fixed operating costs regardless of wafer volume taken, plus variable costs on a 3-month binding rolling forecast. On January 29, 2026, JV terms were aligned to co-terminate on December 31, 2034. SanDisk is committed to $1.2 billion in cash payments to Kioxia from 2026 to 2029 under the Agreement to Enhance Collaboration.
* Backend Assembly & Test: Centered at an owned 1,177,000 sq ft facility in Penang, Malaysia. On September 28, 2024, SanDisk sold 80% of SanDisk Semiconductor Shanghai (SDSS) to JCET for $659 million (retaining 20%), committing to a 5-year Supply Agreement with a $550 million minimum annual purchase commitment ($519 million actual purchases in FY2026).
* Strategic DRAM Sourcing: Addressing its NAND-only architecture deficit, SanDisk acquired a 3.9% stake (139 million shares) in Nanya Technology Corporation for $970 million on March 25, 2026, paired with a long-term supply agreement totaling $5,892 million in purchase commitments through 2031 ($926 million in FY2027).
* Global R&D Layout: Milpitas HQ (578,000 sq ft) and Irvine (105,000 sq ft), California; Longmont and Rochester (76,000 sq ft); Hsinchu, Taichung, and Taipei (40,000 sq ft); Beijing and Shenzhen (11,000 sq ft); Fujisawa, Japan (23,000 sq ft owned); Bangalore, India (108,000 sq ft); Kfar Saba, Tefen, and Omer, Israel (301,000 sq ft); Prague, Czech Republic (5,000 sq ft). Minimum joint R&D commitment with Kioxia is $138 million for FY2027.
Table Contractual Cash Obligations and Liquidity Position Analysis (FY2027–Beyond 2031)
| Contractual Cash Obligations vs. Liquidity | FY2027 ($M) | FY2028–FY2029 ($M) | FY2030–FY2031 ($M) | Beyond 2031 ($M) | Total ($M) |
| JV Lease & Funding Commitments | 2,627 | 2,577 | 1,318 | 37 | 6,559 |
| Purchase Obligations (incl. Nanya) | 726 | 2,993 | 1,111 | 72 | 4,902 |
| Operating Leases (ASC 842) | 38 | 55 | 44 | 162 | 299 |
| Term Loan Facility | 0 | 0 | 0 | 0 | 0 |
| Undrawn Revolver ($1.5B capacity) | 0 | 0 | 0 | 0 | 0 |
| Total Fixed Cash Obligations | 3,391 | 5,625 | 2,473 | 271 | 11,760 |
| Total Liquid Reserves (Cash + Revolver) | 6,262 | — | — | — | 6,262 |
SanDisk fully repaid its $2.0 billion Term Loan on March 4, 2026, leaving $0 debt on the balance sheet. Liquid reserves include $4,762 million in cash ($2,879 million held internationally) and an undrawn $1,500 million credit facility maturing February 21, 2030. Nanya Technology marketable equity is carried at $1,777 million under a 3-year statutory lock-up. Building depreciation prepayments include $840 million in uncredited balances and $402 million in future commitments ($118 million in FY2027). Flash Ventures lease guarantees total ¥149.0 billion ($923 million).
HDIN Institutional Verdict
HDIN Research's forensic audit reveals that while SanDisk Corporation's 102.1% Operating Cash Flow conversion ($11,671 million OCF / $11,433 million Net Income) appears peer-leading, the working capital engine was structurally supported by $2.59 billion in upfront customer collections under New Business Model (NBM) agreements ($1,374 million incremental refund liabilities/security deposits and $1,217 million incremental contract liabilities/advances). Absent this upfront liquidity, OCF would have absorbed a $4,259 million operational drag from receivables float (-$3,640 million) and inventory builds (-$619 million).
Table Inventory Composition and Year-over-Year Change Analysis (FY2025–FY2026)
| Inventory Breakdown (Note 5) | FY2025 ($M) | FY2025 Mix (%) | FY2026 ($M) | FY2026 Mix (%) | YoY Change (%) |
| Raw Materials & Components | 1,517 | 72.97% | 1,938 | 71.83% | +27.75% |
| Work-in-Process (WIP) | 262 | 12.60% | 313 | 11.60% | +19.47% |
| Finished Goods | 300 | 14.43% | 447 | 16.57% | +49.00% |
| Total Inventory | 2,079 | 100.00% | 2,698 | 100.00% | +29.77% |
Operational duration metrics highlight emerging de-linking:
* Cash Conversion Cycle (CCC): Expanded by 26 days to 162 days in FY2026 (DSO improved 3 days to 48; DPO extended 14 days to 64; DIO deteriorated 43 days to 178).
* Working Capital Concentration: Raw materials comprise 71.83% of inventory due to 50% fixed-cost absorption mandates at Flash Ventures.
* Accounts Receivable Concentration: 41.0% ($1,930.3 million) of the $4,708 million gross AR is owed by three counterparties (Customer A: 19%, Customer B: 12%, Customer C: 10%), with zero receivables factored in FY2026 ($339 million in FY2024).
The NBM structure provides commercial protection: secured remaining performance obligations reached $59.8 billion ($58.7 billion unbilled, ~19% or $11.36 billion converting in FY2027), with two post-balance sheet contracts expanding total backlog to $91.1 billion, backed by $5.0 billion in third-party collateral.
However, institutional risk models must discount three critical medium-term variables:
1. Effective Tax Rate Normalization: FY2026 GAAP ETR of 12.0% ($1,584 million provision on $13,017 million pre-tax income) and cash tax rate of 1.12% ($146 million cash paid) are shielded by Malaysian tax holidays ($492 million benefit, $3.18/share) expiring progressively from 2028 to 2031, compounded by Corporate Alternative Minimum Tax (CAMT) onset in FY2027 and $128 million in Western Digital Corporation tax indemnification liabilities.
2. 2028 Talent Retention Cliff: Post-spin stock appreciation of 4,847.22% creates an executive retention vulnerability when unvested equity awards vest in February and September 2028.
3. JV Fixed-Cost Operating Beta: SanDisk's 50% fixed-cost liability across Kioxia fabs exposes margins to unabsorbed overhead penalties whenever industry fab utilization cuts occur.
Presentation Download & Video Access:
- Presentation Download: Click the PDF download link under 'Related Topics' to access the full institutional presentation of this report.
- Video Link: Click this link to watch the HDIN analyst briefing on YouTube.
About HDIN Research:
HDIN Research is a premier global market intelligence and strategic advisory firm specializing in institutional-grade financial analysis, supply chain audits, and macroeconomic forecasting. Our dedicated sector analysts deliver actionable, data-driven insights tailored for private equity, hedge funds, and corporate strategy teams. Visit us at http://www.hdinresearch.com.
2026 AI Transparency Footer:
"This intelligence report was authored by HDIN Research analysts following a rigorous audit of official corporate filings. AI was utilized for massive-scale data synthesis and structural drafting, ensuring 100% inclusion of reported data points. All strategic insights, financial modeling, and final verdicts were verified by our editorial board to ensure professional accuracy and compliance with 2026 Google Search E-E-A-T standards."