Lumentum Holdings Inc.: Strategic Single-Segment Consolidation Near Pathum Thani Hub as 83.2% Top-Line Expansion Signals Post-Turnaround Cash Surge
Date : 2026-08-19
Reading : 512
HDIN Executive Takeaways
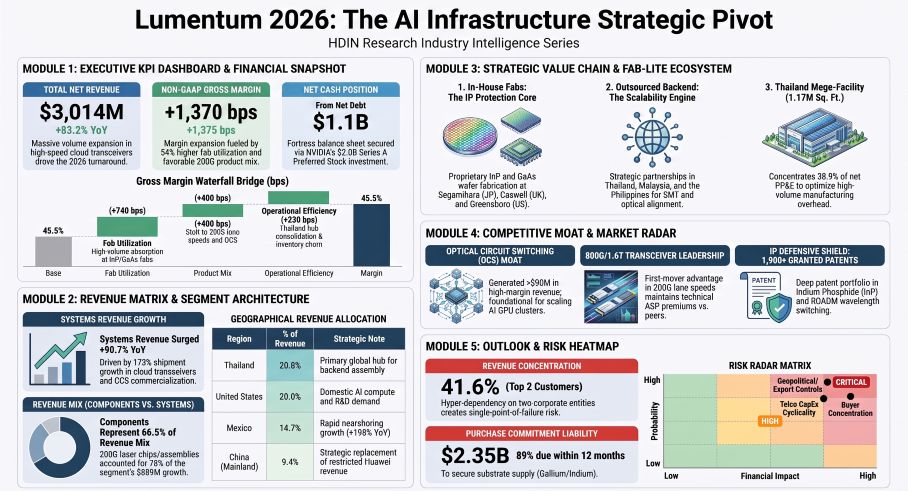
1. Lumentum Holdings Inc. [NASDAQ: LITE] expanded consolidated FY 2026 net revenue by 83.22% year-over-year to $3,014.0 million, supported by high-speed cloud transceiver shipments surging over 173% and an operational gross margin expansion of 1,370 basis points to 41.70%.
2. Physical backend operations shifted toward Pathum Thani, Thailand—now housing $450.6 million (38.9%) of global net PP&E—while direct shipments to Mexico increased 198.8% to $443.7 million (14.7% of net revenue), indicating nearshoring to North American compute clusters.
3. Underlying operational liquidity shifted from a Net Debt position of $1,696.10 million in FY 2025 to a Net Cash position of $1,101.00 million, backed by a $2.0 billion convertible preferred stock investment from NVIDIA Corporation, neutralizing an ASC 470-50 non-cash debt extinguishment loss of $7,755.1 million.
Figure Lumentum 2026: The Al infrastructure Strategic Pivot
 Segmental Realities and Capital Realignment
In Q1 FY 2026, Lumentum Holdings Inc. dismantled its historical dual-segment architecture (Cloud & Networking and Industrial Tech), consolidating all operating activities into a single reportable enterprise segment to unify photonic research and deployment across datacom, telecom, and industrial laser nodes.
Top-line revenue expansion was driven by parallel growth across both disaggregated product lines:
* Components Portfolio: Net revenue expanded 79.66% year-over-year from $1,116.30 million in FY 2025 to $2,005.60 million in FY 2026 (representing 66.54% of net sales). Growth was 78% driven ($693.7 million increase) by the structural shift toward 200G optical lane speeds, premium Electro-Absorption Modulated Lasers (EMLs), and continuous wave (CW) high-power laser sources feeding Co-Packaged Optics (CPO) architectures. The remaining 22% ($195.6 million) was generated by long-haul terrestrial line subsystems and submarine pump products.
* Systems Portfolio: Net revenue increased 90.73% year-over-year from $528.70 million to $1,008.40 million (representing 33.46% of net sales). Cloud optical transceivers (400G/800G/1.6T) grew in volume by more than 173% year-over-year, counterbalanced by commoditization-driven average selling price (ASP) erosion. Optical Circuit Switches (OCS) generated over $90.0 million in high-margin scale-up clustering revenue.
Table Multi-Year Operational Quality & Financial Health Dissection
*(All monetary figures in USD millions, except per share and operational metric units)*
Accounting Extinguishment Anomaly and Working Capital Dynamics
Lumentum reported a GAAP net loss of $6,935.10 million in FY 2026. This variance was caused by non-cash ASC 470-50 extinguishment rules. Concurrent with early convertible note conversions, the company issued 10.6 million common shares to extinguish $1,124.90 million in debt principal. The surge in Lumentum's equity valuation produced an aggregate conversion market value exceeding the principal by $7,755.10 million, recorded as an accounting expense.
Adjusting for this non-cash extinguishment, normalized net income totaled $821.50 million. The company converted this operational leverage into $300.10 million of Free Cash Flow, ending two consecutive fiscal cycles of cash burn ($(108.30) million in FY 2024 and $(104.70) million in FY 2025). The Cash Conversion Cycle compressed by 46.53 days to 89.99 days, achieved by leveraging suppliers to extend Days Payable Outstanding to 123.24 days ($567.4 million in payables vs. $225.2 million in FY 2025).
Infrastructure Footprint and Geopolitical Dependencies
Lumentum structures its physical infrastructure through a hybrid "Fab-lite" framework, retaining high-IP compound semiconductor wafer fabrication in owned cleanrooms while shifting labor-intensive packaging, surface mount technology (SMT), and testing to external contract manufacturers and regional operating hubs.
Table GEOGRAPHICAL NET REVENUE DISPERSION (FY 2026)
Physical Real Estate & Owned Wafer Fabrication Assets
As of June 27, 2026, Lumentum's corporate property envelope totaled 3.1 million square feet, of which 2.136 million square feet were owned assets:
* Pathum Thani, Thailand (1,173,000 sq ft owned): Houses centralized backend assembly, testing, and optical packaging. Reflecting post-acquisition line consolidations from NeoPhotonics, the site accounts for $450.6 million, or 38.88%, of Lumentum's total consolidated net PP&E ($1,159.10 million).
* Sagamihara, Japan (472,000 sq ft owned): Primary Indium Phosphide (InP) wafer fabrication site. Acquired unencumbered in July 2024 for $42.2 million in cash, carrying $232.1 million in net PP&E (20.02% of total).
* Caswell, United Kingdom (183,000 sq ft owned): Center for InP high-speed telecom laser design and wafer fabrication, holding $139.1 million in net PP&E (12.00% of total).
* Greensboro, North Carolina, USA (148,000 sq ft owned): Acquired on March 17, 2026, for $38.0 million in cash. Adds Gallium Arsenide (GaAs) and InP cleanroom infrastructure ($39.5 million in PP&E, $8.4 million in goodwill) and operates under a 15-month transitional supply agreement where Lumentum acts as an agent, recording margin-only revenues.
* San Jose, California, USA (124,000 sq ft owned): Corporate headquarters and advanced photonic R&D labs, representing part of the $153.0 million total U.S. PP&E footprint (13.20% of total).
* Ljubljana, Slovenia (36,000 sq ft owned): Specialty optical fiber drawing and preform processing facility.
HDIN Institutional Verdict
Lumentum Holdings Inc.'s top-line recovery and margin expansion are real, but its operational footnotes reveal significant risk-absorption points across downstream buyer channels and upstream supply chains.
1. Downstream Buyer Concentration: Two customers generate 41.6% ($1,253.8 million) of total net revenue, while two accounts control 41.1% ($213.8 million) of gross accounts receivable. These accounts transact via rolling short-term purchase orders without minimum purchase volumes. A 20% volume cut by Customer A would reduce annual net revenue by $160.34 million and lower gross margin by 130 basis points through overhead under-absorption.
2. Purchase Obligations Exceed Annual COGS: Lumentum entered into $2,354.4 million of non-cancellable purchase obligations ($2,112.5 million due within 12 months), surpassing its entire FY 2026 Cost of Sales of $1,680.1 million. This inventory stocking ($370.2 million in raw materials) buffers Chinese mineral export controls on gallium and indium, but shifts the inventory obsolescence risk of rapid 800G-to-1.6T technology cycles onto Lumentum's balance sheet.
3. Product Warranty Red Flag: Product warranty provisions charged to Cost of Sales surged 153.92% from $10.2 million in FY 2025 to $25.9 million in FY 2026, while total warranty reserves rose 71.53% to $24.7 million. This signals yield and reliability strain on newly scaled high-speed transceivers.
4. Convertible Debt Structural Mismatch: Because common shares traded over 130% of conversion thresholds, $1,544.6 million in convertible notes are classified as current liabilities. With indentures mandating cash principal settlements, Lumentum faces an early conversion cash call ($757.8 million principal received as of August 14, 2026). However, the company's total liquidity of $2,738.40 million (supported by NVIDIA's $2.0 billion Preferred Stock investment) and an undrawn $400.0 million revolving facility mitigate immediate liquidity risks.
Presentation Download & Video Access:
- Presentation Download: Click the PDF download link under 'Related Topics' to access the full institutional presentation of this report.
- Video Link: Click this link to watch the HDIN analyst briefing on YouTube.
About HDIN Research:
HDIN Research is a premier global market intelligence and strategic advisory firm specializing in institutional-grade financial analysis, supply chain audits, and macroeconomic forecasting. Our dedicated sector analysts deliver actionable, data-driven insights tailored for private equity, hedge funds, and corporate strategy teams. Visit us at http://www.hdinresearch.com.
2026 AI Transparency Footer:
"This intelligence report was authored by HDIN Research analysts following a rigorous audit of official corporate filings. AI was utilized for massive-scale data synthesis and structural drafting, ensuring 100% inclusion of reported data points. All strategic insights, financial modeling, and final verdicts were verified by our editorial board to ensure professional accuracy and compliance with 2026 Google Search E-E-A-T standards."
1. Lumentum Holdings Inc. [NASDAQ: LITE] expanded consolidated FY 2026 net revenue by 83.22% year-over-year to $3,014.0 million, supported by high-speed cloud transceiver shipments surging over 173% and an operational gross margin expansion of 1,370 basis points to 41.70%.
2. Physical backend operations shifted toward Pathum Thani, Thailand—now housing $450.6 million (38.9%) of global net PP&E—while direct shipments to Mexico increased 198.8% to $443.7 million (14.7% of net revenue), indicating nearshoring to North American compute clusters.
3. Underlying operational liquidity shifted from a Net Debt position of $1,696.10 million in FY 2025 to a Net Cash position of $1,101.00 million, backed by a $2.0 billion convertible preferred stock investment from NVIDIA Corporation, neutralizing an ASC 470-50 non-cash debt extinguishment loss of $7,755.1 million.
Figure Lumentum 2026: The Al infrastructure Strategic Pivot
Segmental Realities and Capital RealignmentIn Q1 FY 2026, Lumentum Holdings Inc. dismantled its historical dual-segment architecture (Cloud & Networking and Industrial Tech), consolidating all operating activities into a single reportable enterprise segment to unify photonic research and deployment across datacom, telecom, and industrial laser nodes.
Top-line revenue expansion was driven by parallel growth across both disaggregated product lines:
* Components Portfolio: Net revenue expanded 79.66% year-over-year from $1,116.30 million in FY 2025 to $2,005.60 million in FY 2026 (representing 66.54% of net sales). Growth was 78% driven ($693.7 million increase) by the structural shift toward 200G optical lane speeds, premium Electro-Absorption Modulated Lasers (EMLs), and continuous wave (CW) high-power laser sources feeding Co-Packaged Optics (CPO) architectures. The remaining 22% ($195.6 million) was generated by long-haul terrestrial line subsystems and submarine pump products.
* Systems Portfolio: Net revenue increased 90.73% year-over-year from $528.70 million to $1,008.40 million (representing 33.46% of net sales). Cloud optical transceivers (400G/800G/1.6T) grew in volume by more than 173% year-over-year, counterbalanced by commoditization-driven average selling price (ASP) erosion. Optical Circuit Switches (OCS) generated over $90.0 million in high-margin scale-up clustering revenue.
Table Multi-Year Operational Quality & Financial Health Dissection
*(All monetary figures in USD millions, except per share and operational metric units)*
| Metric | FY 2024 | FY 2025 | FY 2026 | YoY Variance (FY26 vs. FY25) |
| Components Revenue | $822.10 | $1,116.30 | $2,005.60 | +79.66% |
| Systems Revenue | $537.10 | $528.70 | $1,008.40 | +90.73% |
| Total Net Revenue | $1,359.20 | $1,645.00 | $3,014.00 | +83.22% |
| GAAP Gross Profit | $251.50 | $459.90 | $1,255.90 | +173.08% |
| GAAP Gross Margin (%) | 18.50% | 28.00% | 41.70% | +1,370 bps |
| Non-GAAP Gross Margin (%) | 27.62% | 35.20% | 45.55% | +1,035 bps |
| GAAP Operating Income / (Loss) | $(434.00) | $(180.10) | $524.80 | Turnaround |
| GAAP Operating Margin (%) | -31.93% | -10.95% | 17.41% | +2,836 bps |
| GAAP Net Income / (Loss) | $(546.50) | $25.90 | $(6,935.10) | Loss Artifact |
| Adjusted Net Income (excl. Extinguishment) | $(546.50) | $25.90 | $821.50 | +3,071.8% |
| EBITDA | $(172.80) | $73.90 | $789.30 | +968.06% |
| Operating Cash Flow (OCF) | $24.70 | $126.30 | $751.40 | +494.93% |
| Capital Expenditures (CapEx) | $(133.00) | $(231.00) | $(451.30) | +95.37% |
| Free Cash Flow (FCF) | $(108.30) | $(104.70) | $300.10 | Turnaround |
| Days Sales Outstanding (DSO) | 55.47 days | 55.47 days | 63.01 days | +7.54 days |
| Days Inventory Outstanding (DIO) | 155.58 days | 155.58 days | 150.21 days | -5.37 days |
| Days Payable Outstanding (DPO) | 74.53 days | 74.53 days | 123.24 days | +48.71 days |
| Cash Conversion Cycle (CCC) | 136.52 days | 136.52 days | 89.99 days | -46.53 days |
Accounting Extinguishment Anomaly and Working Capital Dynamics
Lumentum reported a GAAP net loss of $6,935.10 million in FY 2026. This variance was caused by non-cash ASC 470-50 extinguishment rules. Concurrent with early convertible note conversions, the company issued 10.6 million common shares to extinguish $1,124.90 million in debt principal. The surge in Lumentum's equity valuation produced an aggregate conversion market value exceeding the principal by $7,755.10 million, recorded as an accounting expense.
Adjusting for this non-cash extinguishment, normalized net income totaled $821.50 million. The company converted this operational leverage into $300.10 million of Free Cash Flow, ending two consecutive fiscal cycles of cash burn ($(108.30) million in FY 2024 and $(104.70) million in FY 2025). The Cash Conversion Cycle compressed by 46.53 days to 89.99 days, achieved by leveraging suppliers to extend Days Payable Outstanding to 123.24 days ($567.4 million in payables vs. $225.2 million in FY 2025).
Infrastructure Footprint and Geopolitical Dependencies
Lumentum structures its physical infrastructure through a hybrid "Fab-lite" framework, retaining high-IP compound semiconductor wafer fabrication in owned cleanrooms while shifting labor-intensive packaging, surface mount technology (SMT), and testing to external contract manufacturers and regional operating hubs.
Table GEOGRAPHICAL NET REVENUE DISPERSION (FY 2026)
| Destination Region | Net Revenue ($ Million) | Share of Consolidated Revenue |
|---|---|---|
| United States | $627.90 | 20.83% |
| Thailand | $626.60 | 20.79% |
| Hong Kong | $519.30 | 17.23% |
| Mexico | $443.70 | 14.72% |
| Mainland China | $284.80 | 9.45% |
| Other Asia-Pacific* | $216.90 | 7.20% |
| Europe, Middle East & Africa (EMEA) | $177.00 | 5.87% |
| Japan | $104.60 | 3.47% |
| Other Americas | $13.20 | 0.44% |
| Total Consolidated Revenue | $3,014.00 | 100.00% |
Physical Real Estate & Owned Wafer Fabrication Assets
As of June 27, 2026, Lumentum's corporate property envelope totaled 3.1 million square feet, of which 2.136 million square feet were owned assets:
* Pathum Thani, Thailand (1,173,000 sq ft owned): Houses centralized backend assembly, testing, and optical packaging. Reflecting post-acquisition line consolidations from NeoPhotonics, the site accounts for $450.6 million, or 38.88%, of Lumentum's total consolidated net PP&E ($1,159.10 million).
* Sagamihara, Japan (472,000 sq ft owned): Primary Indium Phosphide (InP) wafer fabrication site. Acquired unencumbered in July 2024 for $42.2 million in cash, carrying $232.1 million in net PP&E (20.02% of total).
* Caswell, United Kingdom (183,000 sq ft owned): Center for InP high-speed telecom laser design and wafer fabrication, holding $139.1 million in net PP&E (12.00% of total).
* Greensboro, North Carolina, USA (148,000 sq ft owned): Acquired on March 17, 2026, for $38.0 million in cash. Adds Gallium Arsenide (GaAs) and InP cleanroom infrastructure ($39.5 million in PP&E, $8.4 million in goodwill) and operates under a 15-month transitional supply agreement where Lumentum acts as an agent, recording margin-only revenues.
* San Jose, California, USA (124,000 sq ft owned): Corporate headquarters and advanced photonic R&D labs, representing part of the $153.0 million total U.S. PP&E footprint (13.20% of total).
* Ljubljana, Slovenia (36,000 sq ft owned): Specialty optical fiber drawing and preform processing facility.
HDIN Institutional Verdict
Lumentum Holdings Inc.'s top-line recovery and margin expansion are real, but its operational footnotes reveal significant risk-absorption points across downstream buyer channels and upstream supply chains.
1. Downstream Buyer Concentration: Two customers generate 41.6% ($1,253.8 million) of total net revenue, while two accounts control 41.1% ($213.8 million) of gross accounts receivable. These accounts transact via rolling short-term purchase orders without minimum purchase volumes. A 20% volume cut by Customer A would reduce annual net revenue by $160.34 million and lower gross margin by 130 basis points through overhead under-absorption.
2. Purchase Obligations Exceed Annual COGS: Lumentum entered into $2,354.4 million of non-cancellable purchase obligations ($2,112.5 million due within 12 months), surpassing its entire FY 2026 Cost of Sales of $1,680.1 million. This inventory stocking ($370.2 million in raw materials) buffers Chinese mineral export controls on gallium and indium, but shifts the inventory obsolescence risk of rapid 800G-to-1.6T technology cycles onto Lumentum's balance sheet.
3. Product Warranty Red Flag: Product warranty provisions charged to Cost of Sales surged 153.92% from $10.2 million in FY 2025 to $25.9 million in FY 2026, while total warranty reserves rose 71.53% to $24.7 million. This signals yield and reliability strain on newly scaled high-speed transceivers.
4. Convertible Debt Structural Mismatch: Because common shares traded over 130% of conversion thresholds, $1,544.6 million in convertible notes are classified as current liabilities. With indentures mandating cash principal settlements, Lumentum faces an early conversion cash call ($757.8 million principal received as of August 14, 2026). However, the company's total liquidity of $2,738.40 million (supported by NVIDIA's $2.0 billion Preferred Stock investment) and an undrawn $400.0 million revolving facility mitigate immediate liquidity risks.
Presentation Download & Video Access:
- Presentation Download: Click the PDF download link under 'Related Topics' to access the full institutional presentation of this report.
- Video Link: Click this link to watch the HDIN analyst briefing on YouTube.
About HDIN Research:
HDIN Research is a premier global market intelligence and strategic advisory firm specializing in institutional-grade financial analysis, supply chain audits, and macroeconomic forecasting. Our dedicated sector analysts deliver actionable, data-driven insights tailored for private equity, hedge funds, and corporate strategy teams. Visit us at http://www.hdinresearch.com.
2026 AI Transparency Footer:
"This intelligence report was authored by HDIN Research analysts following a rigorous audit of official corporate filings. AI was utilized for massive-scale data synthesis and structural drafting, ensuring 100% inclusion of reported data points. All strategic insights, financial modeling, and final verdicts were verified by our editorial board to ensure professional accuracy and compliance with 2026 Google Search E-E-A-T standards."