Yangtze Memory Technologies Corp.: Fab 2 Full Utilization and Xtacking® Iteration Drive Gross Margin to 76.77% Ahead of RMB 33.00 Billion STAR Market IPO
Date : 2026-08-24
Reading : 682
HDIN Executive Takeaways
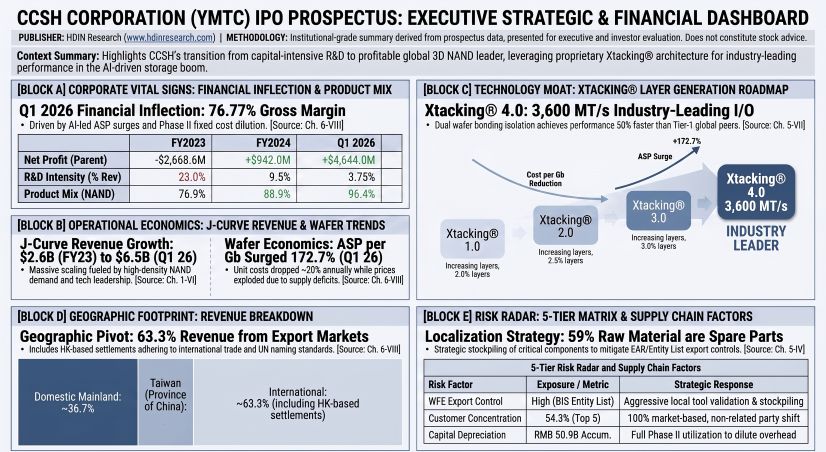
1. Yangtze Memory Technologies Corp. [CCSH] reversed FY2023 net losses of RMB 19,180.64 million (-$2,668.61 million) to deliver Q1 2026 net profit of RMB 33,378.88 million ($4,644.02 million), propelled by a 76.77% consolidated gross margin.
2. Production concentration at the Wuhan East Lake manufacturing cluster (Fab 1 and Fab 2 encompassing 530,087.07 square meters) enabled 98.02% capacity utilization, diluting fixed manufacturing depreciation overhead to 41.39% of cost of goods sold.
3. The planned RMB 33.00 billion ($4,591.30 million) STAR Market initial public offering funds Phase III and 300-layer line upgrades, providing balance-sheet insulation against foreign equipment procurement limits and active Micron Technology Inc. patent disputes.
Figure CCSH CORPORATION (YMTC) IPO PROSPECTUS: EXECUTIVE STRATEGIC & FINANCIAL DASHBOARD
 Segmental Realities, Margin Inflection, and Unit Economics
The operational turnaround of Yangtze Memory Technologies Corp. between FY2023 and Q1 2026 reflects fixed-cost absorption across its 12-inch wafer lines and the market transition toward generative artificial intelligence storage architectures. Consolidated revenue scaled from RMB 18,743.80 million ($2,607.83 million) in FY2023 to RMB 63,184.62 million ($8,790.90 million) in FY2025, reaching RMB 47,042.31 million ($6,545.02 million) in Q1 2026 alone.
Table CONSOLIDATED FINANCIAL PERFORMANCE RECORD (2023 – Q1 2026)
Table SEGMENT REVENUE AND MARGIN PROFILE (2023 – Q1 2026)
NAND Flash products expanded from 76.88% of total revenue in FY2023 to 96.42% in Q1 2026. Micro-unit cost dynamics demonstrate the operating leverage of high-density wafer fabrication:
* Unit Economics Evolution: Indexed against a FY2023 baseline of 100.00, average selling price (ASP) per gigabit (Gb) shifted to 225.11 in FY2024, 194.13 in FY2025, and 529.43 in Q1 2026. Conversely, manufacturing cost per Gb fell 20.20% in FY2024 (index 157.00), 20.78% in FY2025 (index 124.38), and 9.38% in Q1 2026 (index 112.71). The cost-to-ASP ratio compressed from 1.97x in FY2023 to 0.21x in Q1 2026.
* Cost of Goods Sold (COGS) Breakdown: In NAND Flash production (excluding inventory valuation provision write-offs), direct materials accounted for 25.65% (FY2023), 21.95% (FY2024), 22.31% (FY2025), and 23.02% (Q1 2026). Direct labor remained constrained at 5.07%, 4.84%, 4.71%, and 5.04%, while manufacturing overhead dominated at 69.28%, 73.21%, 72.97%, and 71.95%.
* Purified Manufacturing Depreciation: Stripping non-production depreciation yields actual manufacturing plant depreciation charges of RMB 11,202.15 million ($1,558.56 million; 64.55% of COGS) in FY2023, RMB 13,241.95 million ($1,842.36 million; 43.75% of COGS) in FY2024, RMB 16,262.23 million ($2,262.57 million; 39.93% of COGS) in FY2025, and RMB 4,507.76 million ($627.17 million; 41.39% of COGS) in Q1 2026.
* DuPont Return on Equity (ROE) Decomposition:
* FY2023 (Period-End Baseline, Method A Parent Basis): ROE -25.32% = Net Margin -102.33% × Asset Turnover 0.0947x × Equity Multiplier 2.6119x. (Method B Total Basis: ROE -25.04% = Net Margin -102.30% × Asset Turnover 0.0947x × Equity Multiplier 2.5837x).
* FY2024 (Average Basis): Method A Parent ROE 8.37% = Net Margin 14.98% × Asset Turnover 0.2211x × Equity Multiplier 2.5266x. Method B Total ROE (Prospectus baseline) 8.23% = Net Margin 15.27% × Asset Turnover 0.2211x × Equity Multiplier 2.4385x.
* FY2025 (Average Basis): Method A Parent ROE (Prospectus baseline) 15.08% = Net Margin 22.49% × Asset Turnover 0.2876x × Equity Multiplier 2.3318x. Method B Total ROE 13.88% = Net Margin 22.52% × Asset Turnover 0.2876x × Equity Multiplier 2.1436x.
* Q1 2026 (Annualized, Method A Parent Basis): ROE 112.13% = Net Margin 70.95% × Asset Turnover 0.7681x × Equity Multiplier 2.0574x.
Table INVENTORY PROVISIONING AND WRITEDOWN RECOVERY (CNY M)
In FY2023, asset impairment losses totaled RMB 11,518.15 million ($1,602.53 million), of which RMB 11,352.52 million comprised inventory write-downs. As NAND contract pricing recovered, Yangtze Memory Technologies Corp. reversed and wrote off RMB 13,898.82 million in FY2023 and RMB 2,997.90 million in FY2024 against COGS upon product delivery. Subsequent provisions in FY2025 (RMB 693.10 million) and Q1 2026 (RMB 248.50 million) were restricted to aging spare tooling parts and chemicals.
Table CAPACITY UTILIZATION SENSITIVITY AND GROSS MARGIN STRESS TEST
-Fixed Cost Structure: ~77% (Depreciation/Plant) | Variable Cost Structure: ~23% (Direct Materials)
Infrastructure Footprint, Supply Chain Architecture, and Geopolitical Defenses
Yangtze Memory Technologies Corp. structures its integrated device manufacturing operations around dedicated domestic hubs, while export routes manage international revenue flows:
Table GEOGRAPHIC REVENUE SPLIT (NAND FLASH PRODUCTS, 2023 – Q1 2026)
Export market deliveries are settled in United States dollars via free-port trading entities in Hong Kong, generating foreign exchange balance-sheet exposure. Financial expenses registered net foreign exchange losses of RMB 135.12 million in FY2023, gains of RMB 39.21 million in FY2024, losses of RMB 238.15 million in FY2025, and losses of RMB 126.54 million in Q1 2026.
Table MANUFACTURING ASSET AND SUBSIDIARY FOOTPRINT
Upstream procurement shows strategic inventory adjustments in response to United States Bureau of Industry and Security (BIS) Entity List export controls:
Table TOP FIVE RAW MATERIAL SUPPLIER AUDIT (2023 – Q1 2026)
Tooling spare parts expanded from 40.99% of total material purchases in FY2023 to 58.99% in Q1 2026, establishing a buffer against equipment maintenance halts. Days Inventory Outstanding (DIO) shifted from 272.7 days in FY2023 to 172.2 days in FY2024, 142.3 days in FY2025, and 145.2 days in Q1 2026. Days Sales Outstanding (DSO) stood at 33.2 days (FY2023), 28.5 days (FY2024), 42.7 days (FY2025), and 31.0 days (Q1 2026), with accounts receivable aged under six months exceeding 97.31%.
Table CAPITAL EXPENDITURE J-CURVE AND CONSTRUCTION IN PROGRESS (CIP) BREAKDOWN
Table PLANNED STAR MARKET INITIAL PUBLIC OFFERING CAPITAL ALLOCATION
Table GLOBAL 3D NAND TECHNICAL ROADMAP AND ARCHITECTURAL BENCHMARKING
Source: TrendForce Data Compiled in CCSH Prospectus
In Q1 2026, TrendForce ranked Yangtze Memory Technologies Corp. third globally in NAND Flash revenue and physical bit volume, and first within the Chinese Mainland market. The proprietary Xtacking® architecture bonds peripheral CMOS logic and memory array structures from two independent wafers using copper-to-copper (Cu-Cu) interconnects, bypassing high-temperature thermal degradation of logic transistors. Fifth-generation TLC (X4-9070/9060) and QLC (X4-6080 2Tb 8-plane) reach transfer speeds of 3,600 MT/s, driving enterprise SSD (PE522/PE511/PE501) read speeds to 14,200 MB/s and PCIe 5.0 client drives (TiPro9000) to 14,900 MB/s.
Table EQUITY OWNERSHIP AND CORPORATE GOVERNANCE STRUCTURE (PRE-IPO)
The Employee Stock Ownership Plan (ESOP) incorporates 1,024 core executives and engineers holding 1.2949% pre-IPO equity via six direct partnerships (Zhixin 1–6) and 24 tiered entities (Zhixin 7–30). Share-based compensation expenses totaled RMB 89.49 million in FY2025 and RMB 41.98 million in Q1 2026. On July 30, 2026, shareholders approved the abolition of the Board of Supervisors, delegating supervisory powers to an expanded five-member Board Audit Committee chaired by independent director Prof. Wang Yonghai (comprising 60% independent directors).
HDIN Institutional Verdict
Yangtze Memory Technologies Corp.'s financial inflection confirms that production volume across Fab 1 and Fab 2 has reached fixed overhead breakeven. However, institutional valuation modeling requires adjustments across three underlying operational constraints:
* Research and Development Expensing Discipline: Cumulative R&D expenditures of RMB 15,952.59 million across the reporting period (RMB 4,310.49 million in FY2023, RMB 4,294.39 million in FY2024, RMB 5,584.59 million in FY2025, and RMB 1,763.13 million in Q1 2026) maintained a 0% capitalization rate. All R&D was expensed immediately, removing intangible development amortization overhangs from the balance sheet.
* Depreciation Drag from Phase III Equipment Influx: Fixed assets are depreciated over 5 to 15 years with 0% residual value (5 to 7 years for wafer tools; 10 to 15 years for cleanroom HVAC, gas piping, and ultrapure water infrastructure). The deployment of the RMB 33.00 billion IPO capital will introduce annual depreciation and amortization charges of RMB 5,411.43 million (7-year tooling scenario) to RMB 6,600.00 million (5-year tooling scenario). While manageable against annualized Q1 2026 operating profits of RMB 134,109.12 million (4.03% to 4.92% profit drag), the charge would absorb 38.18% to 46.57% of normalized FY2025 operating profits (RMB 14,173.19 million) during memory market downturns.
* Active IP Exposure and Zero Provisioning: Across its portfolio of 6,088 authorized patents (5,611 invention patents: 3,452 domestic, 2,636 overseas), the company faces ongoing patent infringement litigation and counter-petitions with Micron Technology Inc. in United States federal courts. Total balance-sheet estimated liabilities stood at RMB 83.22 million in Q1 2026, comprising RMB 96.14 million in legacy Wuhan Xinxin product warranty reserves and RMB 6.34 million in outsourced material disposal fees. Management allocated zero balance-sheet provisions for the Micron litigation, relying on external counsel assessments of low defeat probability.
Table EQUITY DILUTION AND COMPARATIVE PEER VALUATION BENCHMARKS
Presentation Download & Video Access:
- Presentation Download: Click the PDF download link under 'Related Topics' to access the full institutional presentation of this report.
- Video Link: Click this link to watch the HDIN analyst briefing on YouTube.
About HDIN Research:
HDIN Research is a premier global market intelligence and strategic advisory firm specializing in institutional-grade financial analysis, supply chain audits, and macroeconomic forecasting. Our dedicated sector analysts deliver actionable, data-driven insights tailored for private equity, hedge funds, and corporate strategy teams. Visit us at http://www.hdinresearch.com.
2026 AI Transparency Footer:
"This intelligence report was authored by HDIN Research analysts following a rigorous audit of official corporate filings. AI was utilized for massive-scale data synthesis and structural drafting, ensuring 100% inclusion of reported data points. All strategic insights, financial modeling, and final verdicts were verified by our editorial board to ensure professional accuracy and compliance with 2026 Google Search E-E-A-T standards."
1. Yangtze Memory Technologies Corp. [CCSH] reversed FY2023 net losses of RMB 19,180.64 million (-$2,668.61 million) to deliver Q1 2026 net profit of RMB 33,378.88 million ($4,644.02 million), propelled by a 76.77% consolidated gross margin.
2. Production concentration at the Wuhan East Lake manufacturing cluster (Fab 1 and Fab 2 encompassing 530,087.07 square meters) enabled 98.02% capacity utilization, diluting fixed manufacturing depreciation overhead to 41.39% of cost of goods sold.
3. The planned RMB 33.00 billion ($4,591.30 million) STAR Market initial public offering funds Phase III and 300-layer line upgrades, providing balance-sheet insulation against foreign equipment procurement limits and active Micron Technology Inc. patent disputes.
Figure CCSH CORPORATION (YMTC) IPO PROSPECTUS: EXECUTIVE STRATEGIC & FINANCIAL DASHBOARD
Segmental Realities, Margin Inflection, and Unit EconomicsThe operational turnaround of Yangtze Memory Technologies Corp. between FY2023 and Q1 2026 reflects fixed-cost absorption across its 12-inch wafer lines and the market transition toward generative artificial intelligence storage architectures. Consolidated revenue scaled from RMB 18,743.80 million ($2,607.83 million) in FY2023 to RMB 63,184.62 million ($8,790.90 million) in FY2025, reaching RMB 47,042.31 million ($6,545.02 million) in Q1 2026 alone.
Table CONSOLIDATED FINANCIAL PERFORMANCE RECORD (2023 – Q1 2026)
| Financial Metric | FY2023 (CNY M) | FY2023 (USD M) | FY2024 (CNY M) | FY2024 (USD M) | FY2025 (CNY M) | FY2025 (USD M) | Q1 FY2026 (CNY M) | Q1 FY2026 (USD M) |
|---|---|---|---|---|---|---|---|---|
| Revenue | 18,743.80 | $2,607.83 | 45,203.22 | $6,289.14 | 63,184.62 | $8,790.90 | 47,042.31 | $6,545.02 |
| Gross Margin (%) | 5.45% | 5.45% | 32.49% | 32.49% | 35.30% | 35.30% | 76.77% | 76.77% |
| Total Net Profit | (19,175.39) | $(2,667.88) | 6,901.00 | $960.14 | 14,229.63 | $1,979.78 | 33,485.08 | $4,658.79 |
| Net Profit Attributable to Parent | (19,180.64) | $(2,668.61) | 6,770.75 | $942.02 | 14,210.74 | $1,977.15 | 33,378.88 | $4,644.02 |
| Adjusted Net Profit | (19,359.86) | $(2,693.55) | 6,229.64 | $866.73 | 13,309.10 | $1,851.70 | 33,172.15 | $4,615.26 |
| EBITDA | (2,963.94) | $(412.37) | 24,306.47 | $3,381.77 | 33,829.44 | $4,706.71 | 38,754.80 | $5,391.97 |
| Operating Cash Flow (OCF) | 988.70 | $137.56 | 21,720.72 | $3,022.01 | 32,683.58 | $4,547.28 | 26,744.05 | $3,720.91 |
| Capital Expenditures (Capex) | 21,315.84 | $2,965.68 | 31,012.35 | $4,314.76 | 36,192.25 | $5,035.44 | 7,869.84 | $1,094.93 |
| Free Cash Flow (FCF) | (20,327.14) | $(2,828.12) | (9,291.63) | $(1,292.75) | (3,508.67) | $(350.86) | 18,874.21 | $2,626.01 |
| Monthly Cash Burn / (Inflow) | (1,693.93) | $(235.68) | (774.30) | $(107.73) | (292.39) | $(29.24) | 2,208.52 | $875.34 |
| R&D Intensity (%) | 23.00% | 23.00% | 9.50% | 9.50% | 8.84% | 8.84% | 3.75% | 3.75% |
| Interest Coverage Ratio | (4.15x) | (4.15x) | 3.18x | 3.18x | 7.70x | 7.70x | 93.80x | 93.80x |
Table SEGMENT REVENUE AND MARGIN PROFILE (2023 – Q1 2026)
| Business Segment | FY2023 Revenue (CNY M) | Margin (%) | FY2024 Revenue (CNY M) | Margin (%) | FY2025 Revenue (CNY M) | Margin (%) | Q1 FY2026 Revenue (CNY M) | Margin (%) |
|---|---|---|---|---|---|---|---|---|
| NAND Flash Products | 14,101.61 | 1.00% | 39,880.10 | 34.24% | 56,659.68 | 36.66% | 45,237.76 | 78.73% |
| └─ Storage Chips (Raw Wafer) | 8,976.04 | 0.61% | 23,989.18 | 41.87% | 29,444.03 | 44.21% | 23,854.95 | 84.23% |
| └─ Embedded Storage (eMMC / UFS) | 3,666.79 | 0.50% | 12,006.52 | 25.24% | 21,191.11 | 29.83% | 16,668.31 | 73.26% |
| └─ Solid State Drives (SSD) | 1,458.78 | 4.69% | 3,884.41 | 14.95% | 6,024.54 | 23.75% | 4,714.49 | 70.29% |
| Other Products and Services | 4,241.71 | 19.98% | 4,966.56 | 18.56% | 5,761.73 | 16.06% | 1,680.46 | 24.45% |
| └─ Wafer Foundry | 2,546.93 | 14.58% | 3,071.82 | 14.48% | 3,847.72 | 19.48% | 909.82 | 24.29% |
| └─ NOR Flash Products | 614.76 | 17.81% | 652.94 | 20.27% | 757.01 | 20.82% | 347.27 | 31.25% |
| └─ Chip Packaging & Testing | 329.17 | 25.18% | 404.84 | 24.92% | 751.77 | 20.05% | 260.24 | 24.52% |
| └─ Other Miscellaneous Services | 750.86 | N/A | 836.97 | N/A | 405.22 | N/A | 163.13 | N/A |
| Total Main Business Revenue | 18,343.32 | 5.39% | 44,846.66 | 32.51% | 62,421.41 | 34.76% | 46,918.22 | 76.79% |
NAND Flash products expanded from 76.88% of total revenue in FY2023 to 96.42% in Q1 2026. Micro-unit cost dynamics demonstrate the operating leverage of high-density wafer fabrication:
* Unit Economics Evolution: Indexed against a FY2023 baseline of 100.00, average selling price (ASP) per gigabit (Gb) shifted to 225.11 in FY2024, 194.13 in FY2025, and 529.43 in Q1 2026. Conversely, manufacturing cost per Gb fell 20.20% in FY2024 (index 157.00), 20.78% in FY2025 (index 124.38), and 9.38% in Q1 2026 (index 112.71). The cost-to-ASP ratio compressed from 1.97x in FY2023 to 0.21x in Q1 2026.
* Cost of Goods Sold (COGS) Breakdown: In NAND Flash production (excluding inventory valuation provision write-offs), direct materials accounted for 25.65% (FY2023), 21.95% (FY2024), 22.31% (FY2025), and 23.02% (Q1 2026). Direct labor remained constrained at 5.07%, 4.84%, 4.71%, and 5.04%, while manufacturing overhead dominated at 69.28%, 73.21%, 72.97%, and 71.95%.
* Purified Manufacturing Depreciation: Stripping non-production depreciation yields actual manufacturing plant depreciation charges of RMB 11,202.15 million ($1,558.56 million; 64.55% of COGS) in FY2023, RMB 13,241.95 million ($1,842.36 million; 43.75% of COGS) in FY2024, RMB 16,262.23 million ($2,262.57 million; 39.93% of COGS) in FY2025, and RMB 4,507.76 million ($627.17 million; 41.39% of COGS) in Q1 2026.
* DuPont Return on Equity (ROE) Decomposition:
* FY2023 (Period-End Baseline, Method A Parent Basis): ROE -25.32% = Net Margin -102.33% × Asset Turnover 0.0947x × Equity Multiplier 2.6119x. (Method B Total Basis: ROE -25.04% = Net Margin -102.30% × Asset Turnover 0.0947x × Equity Multiplier 2.5837x).
* FY2024 (Average Basis): Method A Parent ROE 8.37% = Net Margin 14.98% × Asset Turnover 0.2211x × Equity Multiplier 2.5266x. Method B Total ROE (Prospectus baseline) 8.23% = Net Margin 15.27% × Asset Turnover 0.2211x × Equity Multiplier 2.4385x.
* FY2025 (Average Basis): Method A Parent ROE (Prospectus baseline) 15.08% = Net Margin 22.49% × Asset Turnover 0.2876x × Equity Multiplier 2.3318x. Method B Total ROE 13.88% = Net Margin 22.52% × Asset Turnover 0.2876x × Equity Multiplier 2.1436x.
* Q1 2026 (Annualized, Method A Parent Basis): ROE 112.13% = Net Margin 70.95% × Asset Turnover 0.7681x × Equity Multiplier 2.0574x.
Table INVENTORY PROVISIONING AND WRITEDOWN RECOVERY (CNY M)
| Inventory Category | FY2023 Gross Inventory (CNY M) | Provision Rate (%) | FY2024 Gross Inventory (CNY M) | Provision Rate (%) | FY2025 Gross Inventory (CNY M) | Provision Rate (%) | Q1 FY2026 Gross Inventory (CNY M) | Provision Rate (%) |
|---|---|---|---|---|---|---|---|---|
| Raw Materials | 3,951.35 | 13.49% | 3,795.42 | 21.35% | 4,487.57 | 20.30% | 4,388.66 | 22.36% |
| Work-in-Progress (WIP) | 7,577.14 | 8.20% | 8,308.51 | 3.14% | 9,626.50 | 1.20% | 9,718.42 | 1.57% |
| Finished Goods | 4,684.85 | 60.89% | 3,767.93 | 4.43% | 1,819.77 | 7.01% | 1,760.30 | 7.00% |
| Other Inventories | 466.93 | 44.84% | 1,177.33 | 8.90% | 1,928.88 | 4.55% | 4,073.74 | 2.26% |
| Total Gross Inventory | 17,680.27 | 23.85% | 17,049.19 | 7.88% | 17,862.72 | 6.95% | 19,941.42 | 6.77% |
| Total Ending Inventory Provision Balance | 4,216.64 | — | 1,342.79 | — | 1,242.07 | — | 1,349.42 | — |
In FY2023, asset impairment losses totaled RMB 11,518.15 million ($1,602.53 million), of which RMB 11,352.52 million comprised inventory write-downs. As NAND contract pricing recovered, Yangtze Memory Technologies Corp. reversed and wrote off RMB 13,898.82 million in FY2023 and RMB 2,997.90 million in FY2024 against COGS upon product delivery. Subsequent provisions in FY2025 (RMB 693.10 million) and Q1 2026 (RMB 248.50 million) were restricted to aging spare tooling parts and chemicals.
Table CAPACITY UTILIZATION SENSITIVITY AND GROSS MARGIN STRESS TEST
-Fixed Cost Structure: ~77% (Depreciation/Plant) | Variable Cost Structure: ~23% (Direct Materials)
| Capacity Utilization (U) | Unit Wafer Cost Index | Cost Delta vs. 100% Utilization | Margin (Q1 2026 ASP Index) | Margin (FY2023 ASP Index) |
|---|---|---|---|---|
| 100% (Nominal Capacity) | 100.00 | 0.00% | 77.13% | 9.54% |
| 98% (Q1 2026 Actual: 98.02%) | 101.57 | +1.57% | 76.77% | 8.12% |
| 95% (FY2024 Actual: 95.43%) | 104.05 | +4.05% | 76.20% | 5.88% |
| 90% | 108.56 | +8.56% | 75.17% | 1.80% |
| 85% | 113.59 | +13.59% | 74.02% | -2.75% |
| 80% | 119.25 | +19.25% | 72.73% | -7.87% |
| 70% | 133.00 | +33.00% | 69.58% | -20.31% |
| 50% | 177.00 | +77.00% | 59.52% | -60.11% |
Infrastructure Footprint, Supply Chain Architecture, and Geopolitical Defenses
Yangtze Memory Technologies Corp. structures its integrated device manufacturing operations around dedicated domestic hubs, while export routes manage international revenue flows:
Table GEOGRAPHIC REVENUE SPLIT (NAND FLASH PRODUCTS, 2023 – Q1 2026)
| Region | FY2023 Revenue (CNY M) | Mix (%) | FY2024 Revenue (CNY M) | Mix (%) | FY2025 Revenue (CNY M) | Mix (%) | Q1 2026 Revenue (CNY M) | Mix (%) |
|---|---|---|---|---|---|---|---|---|
| Chinese Mainland | 6,333.78 | 44.92% | 22,587.09 | 56.64% | 24,204.92 | 42.72% | 16,611.04 | 36.72% |
| Export Markets (Hong Kong) | 7,767.83 | 55.08% | 17,293.01 | 43.36% | 32,454.76 | 57.28% | 28,626.72 | 63.28% |
| Total NAND Sales | 14,101.61 | 100.00% | 39,880.10 | 100.00% | 56,659.68 | 100.00% | 45,237.76 | 100.00% |
Export market deliveries are settled in United States dollars via free-port trading entities in Hong Kong, generating foreign exchange balance-sheet exposure. Financial expenses registered net foreign exchange losses of RMB 135.12 million in FY2023, gains of RMB 39.21 million in FY2024, losses of RMB 238.15 million in FY2025, and losses of RMB 126.54 million in Q1 2026.
Table MANUFACTURING ASSET AND SUBSIDIARY FOOTPRINT
| Facility / Entity | Location | Floor Area (sqm) | Core Operational Mandate |
|---|---|---|---|
| Fab 1 (Plant 1) | Wuhan East Lake Zone | 266,948.51 | 12-inch 3D NAND Phase I production; early-stage Xtacking ramp-up |
| Fab 2 (Plants 2a & 2b) | Wuhan East Lake Zone | 263,138.56 | 12-inch 3D NAND Phase II production (Plant 2a: 135,761.80 sqm; Plant 2b: 127,376.76 sqm) |
| Shanghai Kangqiao Base | Pudong, Shanghai | 26,839.70 | R&D headquarters, memory architecture development, and circuit design |
| Unimos Microelectronics | Songze Avenue, Qingpu, Shanghai | 66,859.73 | High-density packaging and testing (DDP, QDP, 32DP stacking) |
| Macroic Wuhan | Wuhan East Lake FTZ | N/A | Near-fab advanced memory packaging and backend testing |
| Wuhan Xinxin (Deconsolidated) | Wuhan, Hubei | N/A | Deconsolidated on July 9, 2026 (ownership stake reduced from 68.19% to 29.19%) |
Upstream procurement shows strategic inventory adjustments in response to United States Bureau of Industry and Security (BIS) Entity List export controls:
Table TOP FIVE RAW MATERIAL SUPPLIER AUDIT (2023 – Q1 2026)
| Period | Supplier | Supplier Type | Procurement Category | Amount (CNY M) | Amount (USD M) | Share of Purchases |
|---|---|---|---|---|---|---|
| Q1 2026 | Supplier B | Trading Entity | Spare Parts & Tooling | 1,236.63 | 172.05 | 23.04% |
| Supplier E | Original Vendor | Spare Parts & Tooling | 231.72 | 3.22 | 4.32% | |
| Supplier C | Original Vendor | Chemicals | 192.38 | 2.68 | 3.59% | |
| Supplier D | Trading Entity | Silicon Wafers | 171.43 | 2.38 | 3.19% | |
| Supplier R | Original Vendor | Industrial Gases | 156.69 | 2.18 | 2.92% | |
| Top 5 Combined | - | - | 1,988.84 | 276.71 | 37.06% | |
| FY2025 | Supplier A | Trading Entity | Spare Parts | 1,084.77 | 150.93 | 6.68% |
| Supplier B | Trading Entity | Spare Parts | 1,004.07 | 139.70 | 6.19% | |
| Supplier C | Original Vendor | Chemicals | 671.57 | 93.44 | 4.14% | |
| Supplier D | Trading Entity | Silicon Wafers | 596.05 | 82.93 | 3.67% | |
| Supplier E | Original Vendor | Spare Parts | 539.81 | 75.10 | 3.33% | |
| Top 5 Combined | - | - | 3,896.26 | 542.10 | 24.01% | |
| FY2024 | Supplier A | Trading Entity | Spare Parts | 683.04 | 95.03 | 5.59% |
| Supplier F | Vendor / Trader | Photoresists | 612.06 | 85.16 | 5.01% | |
| Supplier C | Original Vendor | Chemicals | 543.28 | 75.59 | 4.45% | |
| Supplier D | Trading Entity | Silicon Wafers | 425.31 | 59.16 | 3.48% | |
| Supplier G | Vendor / Trader | Spare Parts | 402.64 | 56.02 | 3.30% | |
| Top 5 Combined | - | - | 2,666.32 | 370.97 | 21.83% | |
| FY2023 | Supplier H | Original Vendor | Spare Parts | 472.54 | 65.74 | 5.25% |
| Supplier C | Original Vendor | Chemicals | 467.16 | 64.99 | 5.19% | |
| Supplier I | Original Vendor | Silicon Wafers | 465.76 | 64.80 | 5.17% | |
| Supplier F | Vendor / Trader | Photoresists | 463.44 | 64.48 | 5.14% | |
| Supplier J | Original Vendor | Silicon Wafers | 443.01 | 61.63 | 4.92% | |
| Top 5 Combined | - | - | 2,311.91 | 321.66 | 25.67% |
Tooling spare parts expanded from 40.99% of total material purchases in FY2023 to 58.99% in Q1 2026, establishing a buffer against equipment maintenance halts. Days Inventory Outstanding (DIO) shifted from 272.7 days in FY2023 to 172.2 days in FY2024, 142.3 days in FY2025, and 145.2 days in Q1 2026. Days Sales Outstanding (DSO) stood at 33.2 days (FY2023), 28.5 days (FY2024), 42.7 days (FY2025), and 31.0 days (Q1 2026), with accounts receivable aged under six months exceeding 97.31%.
Table CAPITAL EXPENDITURE J-CURVE AND CONSTRUCTION IN PROGRESS (CIP) BREAKDOWN
| Project Phase | Budget Execution / Conversion Status | CIP Balance as of March 31, 2026 |
|---|---|---|
| Phase I Line (Fab 1) | 99.00% converted to fixed assets | Line technical upgrade ongoing |
| Phase II Line (Fab 2) | 98.61% cumulative budget converted | Fully operational and production-loaded |
| Phase III Line | 16.76% budget spent (early development phase) | RMB 10,242.00M ($1,424.97M) |
| Total CIP Book Balance | - | RMB 24,147.00M ($3,359.58M) |
| Historical Cumulative Capex | FY2023: RMB 21.32B | FY2024: RMB 31.01B | FY2025: RMB 36.19B | Q1 2026: RMB 7.87B | Total: RMB 96.39B ($13.41B) |
Table PLANNED STAR MARKET INITIAL PUBLIC OFFERING CAPITAL ALLOCATION
| Project Designation | Allocation (CNY M) | Allocation (USD M) | Fund Share | Implementation Location |
|---|---|---|---|---|
| Production Line Technical Upgrade | 20,800.00 | 2,893.91 | 63.03% | Wuhan East Lake High-Tech Zone |
| Advanced R&D Project Construction | 12,200.00 | 1,697.39 | 36.97% | Wuhan East Lake High-Tech Zone |
| Total Planned Net IPO Proceeds | 33,000.00 | 4,591.30 | 100.00% | No new land requisition required |
Table GLOBAL 3D NAND TECHNICAL ROADMAP AND ARCHITECTURAL BENCHMARKING
| Metric / Technology Node | Yangtze Memory (YMTC) | Samsung Electronics | SK hynix (Including Solidigm) | Micron Technology | Kioxia / SanDisk (WDC) |
|---|---|---|---|---|---|
| Core Architecture | Xtacking® 1.0–4.0 | V-NAND (V1–V10) | 4D NAND / Floating Gate | Replacement Gate | BiCS NAND |
| 2024 Mainstream Node | X3-9070/6070 (200L+ TLC) | V8 (236-layer TLC) | V8 (238-layer TLC/QLC) | G8 (232-layer TLC) | BiCS6 (162-layer TLC) |
| 2025 Mainstream Node | X4-9070/6080 (Fifth Generation) | V9 (286-layer TLC) | V9 (321-layer TLC/QLC) | G9 (276-layer TLC) | BiCS8 (218-layer TLC) |
| 2026 Frontier Target | 300L+ technology upgrades | V10 series (in development) | V10 (375-layer class) | G10 (459-layer class) | BiCS9 (264-layer class) |
| Peak Product I/O Rate | 3,600 MT/s (Fifth Generation) | 2,400 MT/s (V8) | 2,400 MT/s (V8) | 2,400 MT/s (G8) | 2,000–2,400 MT/s |
| Wafer Bonding Structure | Dual-wafer Cu-Cu hybrid bonding | PuD / Coplanar | COP / Floating Gate | CuA Replacement Gate | PuD Coplanar |
In Q1 2026, TrendForce ranked Yangtze Memory Technologies Corp. third globally in NAND Flash revenue and physical bit volume, and first within the Chinese Mainland market. The proprietary Xtacking® architecture bonds peripheral CMOS logic and memory array structures from two independent wafers using copper-to-copper (Cu-Cu) interconnects, bypassing high-temperature thermal degradation of logic transistors. Fifth-generation TLC (X4-9070/9060) and QLC (X4-6080 2Tb 8-plane) reach transfer speeds of 3,600 MT/s, driving enterprise SSD (PE522/PE511/PE501) read speeds to 14,200 MB/s and PCIe 5.0 client drives (TiPro9000) to 14,900 MB/s.
Table EQUITY OWNERSHIP AND CORPORATE GOVERNANCE STRUCTURE (PRE-IPO)
| Shareholder Name | Share Count ('000) | Ownership (%) | Shareholder Classification | State-Owned (SS) |
|---|---|---|---|---|
| Hubei Changsheng | 473,018.46 | 26.54% | Regional State Capital | SS |
| Xinfei Technology | 451,804.76 | 25.35% | Strategic Capital / Optics Valley | SS |
| China Integrated Circuit Fund I | 213,288.54 | 11.97% | National Strategic Fund (MOF ownership: 36.47%) | SS |
| China Integrated Circuit Fund II | 202,722.20 | 11.38% | National Strategic Fund (MOF ownership: 11.02%) | SS |
| Optics Valley Industry Investment | 164,923.72 | 9.25% | Regional State Capital (Hubei Science) | SS |
| Guoxin Fund | 105,207.37 | 5.90% | Regional IC Fund (Hubei IC ownership: 92.29%) | — |
| Changjiang Industry Group | 45,051.64 | 2.53% | Regional State Capital | SS |
| Famous Investment | 17,478.97 | 0.98% | Private Equity Fund | — |
| ABC Financial Asset Investment | 10,924.36 | 0.61% | Debt-to-Equity Investment | SS |
| CCB Financial Asset Investment | 10,924.36 | 0.61% | Debt-to-Equity Investment | SS |
| BoCom Financial Asset Investment | 10,924.36 | 0.61% | Debt-to-Equity Investment | SS |
| BOC Asset Management Scheme No. 1 | 10,924.36 | 0.61% | Debt-to-Equity Investment | SS |
| ICBC Financial Asset Investment | 10,924.36 | 0.61% | Debt-to-Equity Investment | — |
| Other Shareholders (including 6 ESOPs) | 54,952.12 | 3.05% | Employee Shareholding & Strategic Investors | — |
| Total Capital Baseline | 1,782,000.00 | 100.00% | — | — |
The Employee Stock Ownership Plan (ESOP) incorporates 1,024 core executives and engineers holding 1.2949% pre-IPO equity via six direct partnerships (Zhixin 1–6) and 24 tiered entities (Zhixin 7–30). Share-based compensation expenses totaled RMB 89.49 million in FY2025 and RMB 41.98 million in Q1 2026. On July 30, 2026, shareholders approved the abolition of the Board of Supervisors, delegating supervisory powers to an expanded five-member Board Audit Committee chaired by independent director Prof. Wang Yonghai (comprising 60% independent directors).
HDIN Institutional Verdict
Yangtze Memory Technologies Corp.'s financial inflection confirms that production volume across Fab 1 and Fab 2 has reached fixed overhead breakeven. However, institutional valuation modeling requires adjustments across three underlying operational constraints:
* Research and Development Expensing Discipline: Cumulative R&D expenditures of RMB 15,952.59 million across the reporting period (RMB 4,310.49 million in FY2023, RMB 4,294.39 million in FY2024, RMB 5,584.59 million in FY2025, and RMB 1,763.13 million in Q1 2026) maintained a 0% capitalization rate. All R&D was expensed immediately, removing intangible development amortization overhangs from the balance sheet.
* Depreciation Drag from Phase III Equipment Influx: Fixed assets are depreciated over 5 to 15 years with 0% residual value (5 to 7 years for wafer tools; 10 to 15 years for cleanroom HVAC, gas piping, and ultrapure water infrastructure). The deployment of the RMB 33.00 billion IPO capital will introduce annual depreciation and amortization charges of RMB 5,411.43 million (7-year tooling scenario) to RMB 6,600.00 million (5-year tooling scenario). While manageable against annualized Q1 2026 operating profits of RMB 134,109.12 million (4.03% to 4.92% profit drag), the charge would absorb 38.18% to 46.57% of normalized FY2025 operating profits (RMB 14,173.19 million) during memory market downturns.
* Active IP Exposure and Zero Provisioning: Across its portfolio of 6,088 authorized patents (5,611 invention patents: 3,452 domestic, 2,636 overseas), the company faces ongoing patent infringement litigation and counter-petitions with Micron Technology Inc. in United States federal courts. Total balance-sheet estimated liabilities stood at RMB 83.22 million in Q1 2026, comprising RMB 96.14 million in legacy Wuhan Xinxin product warranty reserves and RMB 6.34 million in outsourced material disposal fees. Management allocated zero balance-sheet provisions for the Micron litigation, relying on external counsel assessments of low defeat probability.
Table EQUITY DILUTION AND COMPARATIVE PEER VALUATION BENCHMARKS
| Metric / Scenario | Valuation Basis | Implied Valuation Range (CNY / USD) |
|---|---|---|
| Dilution Scenario A (1.98B New Shares / 10%) | Post-Money BPS: RMB 8.52/share | +11.87% BPS accretion vs. RMB 7.62 pre-IPO |
| Dilution Scenario B (2.43B New Shares / 12%) | Post-Money BPS: RMB 8.33/share | +9.38% BPS accretion vs. RMB 7.62 pre-IPO |
| Price-to-Sales (P/S: 4.0x–6.0x) | FY2025 Revenue (RMB 63.18B) | RMB 252.74B–379.11B ($35.16B–$52.75B) |
| Price-to-Sales (P/S: 4.0x–6.0x) | Q1 2026 Annualized Revenue (RMB 188.17B) | RMB 752.68B–1,129.02B ($104.72B–$157.08B) |
| Price-to-Book (P/B: 2.5x–3.5x) | Post-Money Equity Value (RMB 168.78B) | RMB 421.94B–590.72B ($58.71B–$82.19B) |
| Enterprise Value (EV/EBITDA: 10.0x–12.0x) | FY2025 EBITDA (RMB 33.83B) | RMB 338.29B–405.95B ($47.07B–$56.48B) |
Presentation Download & Video Access:
- Presentation Download: Click the PDF download link under 'Related Topics' to access the full institutional presentation of this report.
- Video Link: Click this link to watch the HDIN analyst briefing on YouTube.
About HDIN Research:
HDIN Research is a premier global market intelligence and strategic advisory firm specializing in institutional-grade financial analysis, supply chain audits, and macroeconomic forecasting. Our dedicated sector analysts deliver actionable, data-driven insights tailored for private equity, hedge funds, and corporate strategy teams. Visit us at http://www.hdinresearch.com.
2026 AI Transparency Footer:
"This intelligence report was authored by HDIN Research analysts following a rigorous audit of official corporate filings. AI was utilized for massive-scale data synthesis and structural drafting, ensuring 100% inclusion of reported data points. All strategic insights, financial modeling, and final verdicts were verified by our editorial board to ensure professional accuracy and compliance with 2026 Google Search E-E-A-T standards."