Intelligent Bio Solutions Inc.: Strategic Pivot Near Cambridge and Indian Manufacturing Hubs as 38.1% Revenue Growth Clashes with 3.5-Month Cash Runway
Date : 2026-08-26
Reading : 208
HDIN Executive Takeaways
1. Intelligent Bio Solutions Inc. expanded FY2026 revenue by 38.1% to $4.22 million, driven by consumable cartridge pull-through (+41.1%), but faces structural cash burn of -$11.93 million against an adjusted liquidity runway of approximately 3.5 months.
2. Production of DSR-Plus readers was outsourced to Syrma Johari MedTech in India while retaining high-margin cartridge fabrication at its 11,500-sq-ft Cambridge facility (13.33% capacity utilization), lifting gross margin by 778 bps to 48.63%.
3. Institutional viability rests on navigating FDA 510(k) clearance for codeine opiate screening to tap the $2.47 billion U.S. employer testing market, while managing dilutive overhang from 6.12 million outstanding warrants.
Figure INBS Strategic Reconstruction: The Path to North American Commercialization
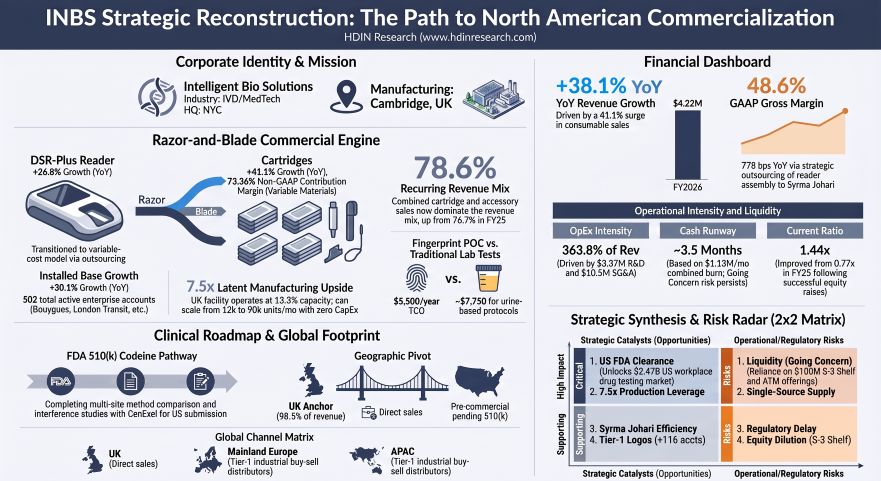 Revenue Breakdown, Operating Leverage, and Balance Sheet Reconstruction
Intelligent Bio Solutions Inc. [NASDAQ: INBS] recorded consolidated top-line revenue of $4,215,175 for the fiscal year ended June 30, 2026, representing a 38.10% increase over $3,052,532 in FY2025. The company's commercial architecture operates on a "razor-and-blades" diagnostic model. Consumables (cartridges) generated $2,485,563 (58.97% of mix), scaling 41.05% YoY. Hardware sales (DSR-Plus Readers) rose 26.77% to $902,263 (21.41% of mix), and accessories/services increased 42.98% to $827,349 (19.63% of mix).
Gross profit rose 64.41% to $2,049,994, with gross margin expanding 778 basis points to 48.63% (up from 40.85% in FY2025). Direct materials accounted for $1,123,081 (26.64% of revenue), direct labor was $950,369 (22.55% of revenue), and direct overhead reached $91,731 (2.18% of revenue). Non-GAAP contribution margin, isolating direct variable materials, reached 73.36% (a 361 bps expansion).
Operating expenses totaled $15,335,855 in FY2026, up 20.35% from $12,742,918. Research and development expanded 40.67% to $3,371,292 (80.00% of revenue) due to U.S. clinical trials. Selling, general, and administrative (SG&A) expenses stood at $10,502,161 (249.15% of revenue), with sales and marketing at $2,068,020 and corporate G&A at $8,434,141 (200.09% of revenue). Operating loss expanded 18.06% to -$12,608,085, and net loss attributable to the company reached -$12,430,975.
Table Audited Financial Performance and Revenue Composition Analysis (FY2025–FY2026)
Balance sheet liquidity shifted following capital market transactions:
* Operating Cash Flow: Outflows worsened 23.25% to -$11,927,222 in FY2026 (from -$9,677,313 in FY2025).
* Capital Expenditures: CapEx fell to $125,731 (from $231,838 in FY2025), yielding Free Cash Flow of -$12,052,953.
* Cash & Working Capital: Cash and equivalents closed FY2026 at $3,992,312 ($1,019,909 in FY2025). Current assets were $7,097,236 versus current liabilities of $4,928,924, yielding positive working capital of $2,168,312 (up from a deficit of -$1,212,419 in FY2025).
* Liquidity Ratios: Current ratio settled at 1.44x (0.77x in FY2025). Conservative quick ratio (cash plus trade receivables) was 0.98x (0.30x in FY2025), while standard quick ratio (incorporating $806,951 in refundable Australian and UK R&D tax incentives) stood at 1.15x.
* Contractual Liabilities: Short-term obligations include $1,252,842 due to the Australian Government from a grant acquittal audit on a terminated manufacturing project, payable in equal monthly installments over 9 months ($139,205 per month).
Operational Footprint, Global Supply Chain, and Market Concentration
Intelligent Bio Solutions Inc. maintains a tripartite infrastructure supported by specialized contract manufacturing partners:
* Cambridge, United Kingdom: The leased 11,500-sq-ft facility handles R&D and in-house lateral flow cartridge fabrication. The plant has an installed capacity of 90,000 cartridges per month and operates at 12,000 units per month (13.33% capacity utilization), leaving a 7.5x volume expansion buffer without incremental CapEx. It complies with ISO 13485, ISO 9001, and the FDA QMSR framework (21 CFR Part 820, effective February 2, 2026).
* Syrma Johari MedTech Partnership: Reader hardware manufacturing was shifted offsite under a December 31, 2025 agreement with Syrma Johari MedTech Ltd. in India, with commercial shipments beginning in February 2026. The facility holds ISO 13485, MDSAP, FDA, TUV SUD, and GMP certifications.
* Sydney, Australia & New York City, USA: Sydney operates a 2,080-sq-ft warehouse and regional office. The New York office manages executive operations and U.S. regulatory filings.
* Single-Source Vulnerability: Directly invoiced raw material purchases from the company's largest single supplier accounted for 20.2% of total direct material costs in FY2026 (19.4% in FY2025), centered on proprietary lateral flow assay strips, chemistry, and optical sensors. Customer concentration risk declined, with the largest customer representing 4.9% of total revenues (down from 8.9% in FY2025) across 502 active enterprise accounts (+30.05% YoY).
Table Geographic Revenue Distribution and Regional Growth Analysis (FY2025–FY2026)
Commercial adoption is concentrated in the UK (98.54% of sales), where a direct sales force of 5 representatives and a National Sales Manager placed units with key industrial accounts, including Bouygues UK, a 30,000-employee industrial services provider, and a London bus transit operator (4,400 employees across 14 depots). Americas revenue ($8,750) remains limited to "Forensic Use Only" channels via SMARTOX pending clinical clearances.
HDIN Institutional Verdict
Intelligent Bio Solutions Inc. presents a stark divergence between unit economics and corporate liquidity. While recurring consumable revenues rose to 78.59% of the revenue mix (cartridges plus accessories) and customer accounts expanded to 502, the financial foundation remains under pressure:
Independent auditor UHY LLP issued a going concern explanatory paragraph in the FY2026 Form 10-K. The combined monthly outflow of $1,133,140 ($993,935 monthly operating burn plus $139,205 in mandatory Australian government repayments) leaves the $3,992,312 cash balance with 3.52 months of operational runway from June 30, 2026. Subsequent ATM equity sales through August 18, 2026, generated $265,373 (121,867 shares), extending operations by approximately seven days.
To secure U.S. workplace testing clearance within the $2.47 billion employer drug testing sector, the company completed a 40-subject clinical Cut-off Study via Cliantha Research in April 2026 and initiated Method Comparison ($976,538 commitment) and Interference studies with CenExel Clinical Research in June 2026. These efforts follow the withdrawal of its initial December 2024 510(k) submission after the FDA issued a 70-item Additional Information request. Meanwhile, development of the Biosensor Platform Technology (BPT) for saliva glucose remains indefinitely suspended following the July 2023 liquidation of licensing partner Life Science Biosensor Diagnostics Pty Ltd.
Achieving cash flow self-sustainability requires an estimated $18.0 million to $22.0 million in additional capital to cover clinical obligations ($618,400 remaining), debt liabilities ($1.25 million), inventory scaling ($1.0 million to $2.0 million), U.S. commercial deployment ($2.0 million to $3.0 million), and bridging operating losses over an 18-month commercialization curve. Although management remediated prior material weaknesses in internal controls via NetSuite ERP deployment, near-term survival will depend on secondary offerings under its $100.0 million S-3 shelf registration (subject to the one-third Baby Shelf public float cap of ~$3.90 million) or private placements that will further dilute current equity holders.
Presentation Download & Video Access:
- Presentation Download: Click the PDF download link under 'Related Topics' to access the full institutional presentation of this report.
- Video Link: Click this link to watch the HDIN analyst briefing on YouTube.
About HDIN Research:
HDIN Research is a global market intelligence and strategic advisory firm specializing in institutional-grade financial analysis, supply chain audits, and macroeconomic forecasting. Our dedicated sector analysts deliver actionable, data-driven insights tailored for private equity, hedge funds, and corporate strategy teams. Visit us at http://www.hdinresearch.com.
2026 AI Transparency Footer:
"This intelligence report was authored by HDIN Research analysts following a rigorous audit of official corporate filings. AI was utilized for massive-scale data synthesis and structural drafting, ensuring 100% inclusion of reported data points. All strategic insights, financial modeling, and final verdicts were verified by our editorial board to ensure professional accuracy and compliance with 2026 Google Search E-E-A-T standards."
1. Intelligent Bio Solutions Inc. expanded FY2026 revenue by 38.1% to $4.22 million, driven by consumable cartridge pull-through (+41.1%), but faces structural cash burn of -$11.93 million against an adjusted liquidity runway of approximately 3.5 months.
2. Production of DSR-Plus readers was outsourced to Syrma Johari MedTech in India while retaining high-margin cartridge fabrication at its 11,500-sq-ft Cambridge facility (13.33% capacity utilization), lifting gross margin by 778 bps to 48.63%.
3. Institutional viability rests on navigating FDA 510(k) clearance for codeine opiate screening to tap the $2.47 billion U.S. employer testing market, while managing dilutive overhang from 6.12 million outstanding warrants.
Figure INBS Strategic Reconstruction: The Path to North American Commercialization
Revenue Breakdown, Operating Leverage, and Balance Sheet ReconstructionIntelligent Bio Solutions Inc. [NASDAQ: INBS] recorded consolidated top-line revenue of $4,215,175 for the fiscal year ended June 30, 2026, representing a 38.10% increase over $3,052,532 in FY2025. The company's commercial architecture operates on a "razor-and-blades" diagnostic model. Consumables (cartridges) generated $2,485,563 (58.97% of mix), scaling 41.05% YoY. Hardware sales (DSR-Plus Readers) rose 26.77% to $902,263 (21.41% of mix), and accessories/services increased 42.98% to $827,349 (19.63% of mix).
Gross profit rose 64.41% to $2,049,994, with gross margin expanding 778 basis points to 48.63% (up from 40.85% in FY2025). Direct materials accounted for $1,123,081 (26.64% of revenue), direct labor was $950,369 (22.55% of revenue), and direct overhead reached $91,731 (2.18% of revenue). Non-GAAP contribution margin, isolating direct variable materials, reached 73.36% (a 361 bps expansion).
Operating expenses totaled $15,335,855 in FY2026, up 20.35% from $12,742,918. Research and development expanded 40.67% to $3,371,292 (80.00% of revenue) due to U.S. clinical trials. Selling, general, and administrative (SG&A) expenses stood at $10,502,161 (249.15% of revenue), with sales and marketing at $2,068,020 and corporate G&A at $8,434,141 (200.09% of revenue). Operating loss expanded 18.06% to -$12,608,085, and net loss attributable to the company reached -$12,430,975.
Table Audited Financial Performance and Revenue Composition Analysis (FY2025–FY2026)
| Financial Metric (USD) | FY2025 (Audited) | FY2026 (Audited) | YoY Change (%) / (bps) | FY2026 Mix (%) |
| Total Revenue | $3,052,532 | $4,215,175 | +38.10% | 100.00% |
| — Cartridges (Consumables) | $1,762,153 | $2,485,563 | +41.05% | 58.97% |
| — Readers (Hardware) | $711,737 | $902,263 | +26.77% | 21.41% |
| — Accessories & Other | $578,642 | $827,349 | +42.98% | 19.63% |
| Cost of Goods Sold (COGS) | $1,805,673 | $2,165,181 | +19.91% | 51.37% |
| — Direct Materials | $923,251 | $1,123,081 | +21.64% | 26.64% |
| — Direct Labor | $834,231 | $950,369 | +13.92% | 22.55% |
| — Direct Overhead | $48,191 | $91,731 | +90.35% | 2.18% |
| Gross Profit | $1,246,859 | $2,049,994 | +64.41% | 48.63% |
| Government Support Income | $816,901 | $677,776 | -17.03% | 16.08% |
| Operating Expenses (OpEx) | $12,742,918 | $15,335,855 | +20.35% | 363.82% |
| — R&D / Regulatory | $2,396,513 | $3,371,292 | +40.67% | 80.00% |
| — Sales & Marketing | $1,554,773 | $2,068,020 | +33.01% | 49.06% |
| — General & Administrative | $7,363,695 | $8,434,141 | +14.54% | 200.09% |
| — Depreciation & Amortization | $1,207,875 | $1,163,847 | -3.65% | 27.61% |
| — Asset Impairments | $220,062 | $298,555 | +35.67% | 7.08% |
| Operating Loss | $(10,679,158) | $(12,608,085) | +18.06% | -299.11% |
| Net Loss | $(10,568,733) | $(12,430,975) | +17.62% | -294.91% |
Balance sheet liquidity shifted following capital market transactions:
* Operating Cash Flow: Outflows worsened 23.25% to -$11,927,222 in FY2026 (from -$9,677,313 in FY2025).
* Capital Expenditures: CapEx fell to $125,731 (from $231,838 in FY2025), yielding Free Cash Flow of -$12,052,953.
* Cash & Working Capital: Cash and equivalents closed FY2026 at $3,992,312 ($1,019,909 in FY2025). Current assets were $7,097,236 versus current liabilities of $4,928,924, yielding positive working capital of $2,168,312 (up from a deficit of -$1,212,419 in FY2025).
* Liquidity Ratios: Current ratio settled at 1.44x (0.77x in FY2025). Conservative quick ratio (cash plus trade receivables) was 0.98x (0.30x in FY2025), while standard quick ratio (incorporating $806,951 in refundable Australian and UK R&D tax incentives) stood at 1.15x.
* Contractual Liabilities: Short-term obligations include $1,252,842 due to the Australian Government from a grant acquittal audit on a terminated manufacturing project, payable in equal monthly installments over 9 months ($139,205 per month).
Operational Footprint, Global Supply Chain, and Market Concentration
Intelligent Bio Solutions Inc. maintains a tripartite infrastructure supported by specialized contract manufacturing partners:
* Cambridge, United Kingdom: The leased 11,500-sq-ft facility handles R&D and in-house lateral flow cartridge fabrication. The plant has an installed capacity of 90,000 cartridges per month and operates at 12,000 units per month (13.33% capacity utilization), leaving a 7.5x volume expansion buffer without incremental CapEx. It complies with ISO 13485, ISO 9001, and the FDA QMSR framework (21 CFR Part 820, effective February 2, 2026).
* Syrma Johari MedTech Partnership: Reader hardware manufacturing was shifted offsite under a December 31, 2025 agreement with Syrma Johari MedTech Ltd. in India, with commercial shipments beginning in February 2026. The facility holds ISO 13485, MDSAP, FDA, TUV SUD, and GMP certifications.
* Sydney, Australia & New York City, USA: Sydney operates a 2,080-sq-ft warehouse and regional office. The New York office manages executive operations and U.S. regulatory filings.
* Single-Source Vulnerability: Directly invoiced raw material purchases from the company's largest single supplier accounted for 20.2% of total direct material costs in FY2026 (19.4% in FY2025), centered on proprietary lateral flow assay strips, chemistry, and optical sensors. Customer concentration risk declined, with the largest customer representing 4.9% of total revenues (down from 8.9% in FY2025) across 502 active enterprise accounts (+30.05% YoY).
Table Geographic Revenue Distribution and Regional Growth Analysis (FY2025–FY2026)
| Geographic Region (UN Taxonomy) | FY2025 Revenue (USD) | FY2025 Share (%) | FY2026 Revenue (USD) | FY2026 Share (%) | YoY Growth (%) |
| United Kingdom | $2,868,027 | 93.96% | $4,153,759 | 98.54% | +44.83% |
| Asia-Pacific (APAC) | $29,167 | 0.96% | $12,467 | 0.30% | -57.26% |
| Americas | $22,638 | 0.74% | $8,750 | 0.21% | -61.35% |
| Rest of the World | $132,700 | 4.35% | $40,199 | 0.95% | -69.71% |
| Total Global Revenue | $3,052,532 | 100.00% | $4,215,175 | 100.00% | +38.10% |
Commercial adoption is concentrated in the UK (98.54% of sales), where a direct sales force of 5 representatives and a National Sales Manager placed units with key industrial accounts, including Bouygues UK, a 30,000-employee industrial services provider, and a London bus transit operator (4,400 employees across 14 depots). Americas revenue ($8,750) remains limited to "Forensic Use Only" channels via SMARTOX pending clinical clearances.
HDIN Institutional Verdict
Intelligent Bio Solutions Inc. presents a stark divergence between unit economics and corporate liquidity. While recurring consumable revenues rose to 78.59% of the revenue mix (cartridges plus accessories) and customer accounts expanded to 502, the financial foundation remains under pressure:
Independent auditor UHY LLP issued a going concern explanatory paragraph in the FY2026 Form 10-K. The combined monthly outflow of $1,133,140 ($993,935 monthly operating burn plus $139,205 in mandatory Australian government repayments) leaves the $3,992,312 cash balance with 3.52 months of operational runway from June 30, 2026. Subsequent ATM equity sales through August 18, 2026, generated $265,373 (121,867 shares), extending operations by approximately seven days.
To secure U.S. workplace testing clearance within the $2.47 billion employer drug testing sector, the company completed a 40-subject clinical Cut-off Study via Cliantha Research in April 2026 and initiated Method Comparison ($976,538 commitment) and Interference studies with CenExel Clinical Research in June 2026. These efforts follow the withdrawal of its initial December 2024 510(k) submission after the FDA issued a 70-item Additional Information request. Meanwhile, development of the Biosensor Platform Technology (BPT) for saliva glucose remains indefinitely suspended following the July 2023 liquidation of licensing partner Life Science Biosensor Diagnostics Pty Ltd.
Achieving cash flow self-sustainability requires an estimated $18.0 million to $22.0 million in additional capital to cover clinical obligations ($618,400 remaining), debt liabilities ($1.25 million), inventory scaling ($1.0 million to $2.0 million), U.S. commercial deployment ($2.0 million to $3.0 million), and bridging operating losses over an 18-month commercialization curve. Although management remediated prior material weaknesses in internal controls via NetSuite ERP deployment, near-term survival will depend on secondary offerings under its $100.0 million S-3 shelf registration (subject to the one-third Baby Shelf public float cap of ~$3.90 million) or private placements that will further dilute current equity holders.
Presentation Download & Video Access:
- Presentation Download: Click the PDF download link under 'Related Topics' to access the full institutional presentation of this report.
- Video Link: Click this link to watch the HDIN analyst briefing on YouTube.
About HDIN Research:
HDIN Research is a global market intelligence and strategic advisory firm specializing in institutional-grade financial analysis, supply chain audits, and macroeconomic forecasting. Our dedicated sector analysts deliver actionable, data-driven insights tailored for private equity, hedge funds, and corporate strategy teams. Visit us at http://www.hdinresearch.com.
2026 AI Transparency Footer:
"This intelligence report was authored by HDIN Research analysts following a rigorous audit of official corporate filings. AI was utilized for massive-scale data synthesis and structural drafting, ensuring 100% inclusion of reported data points. All strategic insights, financial modeling, and final verdicts were verified by our editorial board to ensure professional accuracy and compliance with 2026 Google Search E-E-A-T standards."