The Estée Lauder Companies Inc.: PRGP Restructuring Secures $1.2 Billion Target Savings as $530 Million FY2027 Cash Drain and Brand Impairment Cushions Challenge Margin Recovery
Date : 2026-08-25
Reading : 140
HDIN Executive Takeaways
1. The Estée Lauder Companies Inc. expanded gross margin by 150 bps to 75.50% in FY2026, driven by an 80 bps reduction in inventory obsolescence and 55 bps in supply chain efficiencies under its Profit Recovery and Growth Plan (PRGP).
2. The company finalized restructuring approvals to unlock $1.20 billion in annual gross savings via 10,000 net position cuts, facing a $530 million cash restructuring drain and a $500 million debt maturity in FY2027.
3. Operating margins remain structurally fragile due to thin trademark valuation cushions—Dr.Jart+ at 4% and Too Faced at 13%—alongside elevated counterparty credit risk with its primary China travel retail customer.
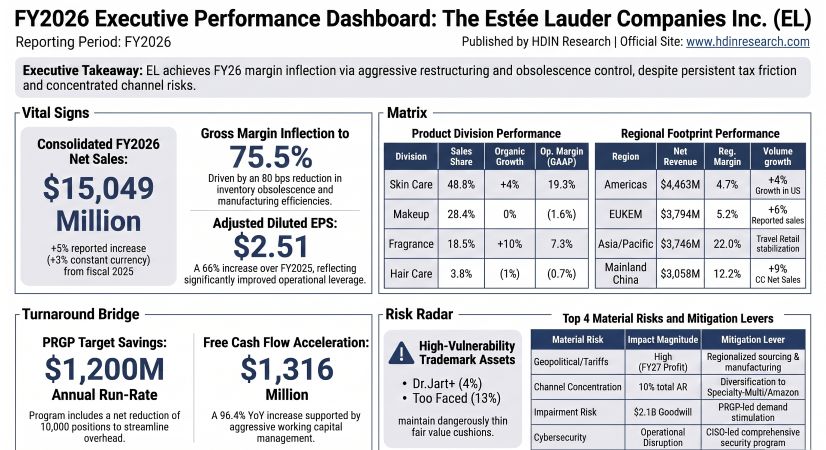
Figure FY2026 Executive Performance Dashboard: The Estée Lauder Companies Inc (EL)
 Segmental Realities and Margin Compression
The Estée Lauder Companies Inc. [NYSE: EL] reported consolidated Net Sales of $15,049 million for Fiscal Year 2026 (ended June 30, 2026), representing a 5.04% reported increase (3.00% in constant currency) from $14,326 million in FY2025. Gross profit reached $11,362 million, lifting Gross Margin by 150 basis points (bps) to 75.50%.
The gross margin expansion was driven by:
* Inventory obsolescence control (+80 bps) via PRGP zero-waste forecasting.
* Manufacturing costs and supply chain efficiencies (+55 bps), offsetting a 15 bps headwind from material cost inflation and global tariffs.
* Favorable business category mix (+30 bps).
* Negative foreign exchange transaction hedging drag (-15 bps).
Operating performance shifted to a GAAP Operating Income of $780 million (5.18% operating margin), compared to a GAAP operating loss of $(785) million (-5.48% margin) in FY2025. On a Non-GAAP adjusted basis—excluding $823 million in restructuring charges and an $84 million securities class-action litigation settlement—Operating Income stood at $1,687 million (11.20% adjusted operating margin), a 47.21% increase from $1,146 million (8.00% adjusted margin) in FY2025. GAAP Net Earnings attributable to the enterprise recovered to $182 million ($0.50 diluted EPS), compared to a net loss of $(1,133) million ($(3.15) diluted EPS) in FY2025, while adjusted diluted EPS rose 66.23% to $2.51.
Table Product Segment Revenue Growth and Operating Performance Analysis (FY2025–FY2026)
Category and pricing mix diagnostics highlight divergence across product portfolios:
* Skin Care generated 48.76% of net sales and $1,416 million in GAAP operating profit (19.30% operating margin), supported by pricing/mix growth of 3.00% led by La Mer's The Treatment Lotion franchise and Estée Lauder hero lines.
* Fragrance delivered 11.56% reported growth to $2,779 million, driven by 7.00% volume growth and 3.00% pricing realization across Le Labo, TOM FORD Private Blend, and KILIAN PARIS.
* Makeup grew 1.69% reported (flat organic) as a 3.00% volume increase from M·A·C lip lines was offset by a 4.00% pricing/mix contraction from heavy promotional discounting, driving adjusted operating margins down 140 bps to -0.82% ($(35) million loss).
* Hair Care generated flat reported sales of $565 million (-1.00% constant currency) as Aveda physical retail door closures were counterbalanced by expansion onto Amazon's U.S. Premium Beauty store.
The company's GAAP effective tax rate was 64.80% in FY2026, driven by a $52 million tax charge resulting from the One Big Beautiful Bill Act (interest expense deduction limits generating excess foreign tax credits) and a total deferred tax asset valuation allowance of $525 million.
Working capital audits show a contraction in the Cash Conversion Cycle (CCC) by 22.06 days to 86.36 days (Average Balance Method) or 78.50 days (Ending Balance Method). Days Sales Outstanding (DSO) declined by 4.95 days to 36.96 days, Days Inventory Outstanding (DIO) fell by 10.40 days to 201.61 days ($1,999 million ending inventory), and Days Payables Outstanding (DPO) expanded by 6.71 days to 152.21 days ($1,578 million ending balance), supported by $87 million in confirmed obligations within the Supplier Finance Program. Accrued Sales Incentives climbed 5.30% to $338 million, while non-credit Customer Deductions reached $14 million.
Operating Cash Flow reached $1,773 million (up 39.39%), while Capital Expenditures were reduced by 24.09% to $457 million (down from $919 million in FY2024), generating Free Cash Flow (FCF) of $1,316 million (96.42% year-over-year increase). Dividends paid were curtailed to $1.40 per share ($508 million total) against $1.71 in FY2025 and $2.64 in FY2024. Share repurchases remained suspended.
Infrastructure Layout and Regional Moats
Effective July 1, 2025, The Estée Lauder Companies Inc. recast its geographic reporting structure into four operational divisions, decoupling Mainland China and Travel Retail:
Table Geographic Revenue Performance and Regional Profitability Analysis (FY2025–FY2026)
On a physical shipping destination basis, Mainland China accounted for $3,930 million (26.11% of consolidated net sales), exceeding the United States at $3,749 million (24.91%). Domestic Mainland China operating profit grew 92.27% to $373 million, heavily supported by the timing of local government subsidies. Travel retail stabilized across South Korea and Hainan, though airport concession transitions in Beijing and Shanghai created operational friction. Concentration risk intensified: the company's largest wholesale customer (operating in China travel retail) represented 10.61% ($161 million) of total accounts receivable ($1,518 million), up from 6.77% ($97 million) in FY2025.
The global production and real estate architecture comprises dedicated internal facilities and regional centers:
* Manufacturing Plants: Internal manufacturing is concentrated across owned facilities in Belgium (4 plants), Canada, Japan (1 plant), Switzerland, the United Kingdom, and the United States (2 owned, 2 leased). Four facilities are specialized for skin care and makeup, three for skin care, two for makeup, two for skin care and fragrance, and one for hair care.
* Research & Development: Research spend dropped 12.03% to $278 million (1.85% of net sales) with headcount rationalized to 1,000 personnel. Physical hubs include leased facilities at Estée Lauder Companies Innovation R&D (China) Co. Ltd. in Shanghai, regional laboratories in Japan and the United Kingdom, and central headquarters laboratories in New York.
* Logistics Footprint: Dedicated travel retail distribution is operated from an owned hub in Asia/Pacific, complemented by leased distribution networks across The Americas (6 facilities), EUKEM (3 facilities), and Mainland China (1 facility). Total undiscounted operating lease liabilities stand at $2,181 million ($1,940 million present value: $399 million current, $1,541 million noncurrent). Unconditional purchase commitments total $3,974 million, including $2,224 million due in FY2027.
Corporate governance remains controlled by the Lauder family via dual-class equity: 247,291,223 Class A shares (1 vote) and 114,507,344 Class B shares (10 votes), conferring approximately 82.00% voting power to family holders and utilizing NYSE "controlled company" exemptions.
HDIN Institutional Verdict
The Estée Lauder Companies Inc.'s operating recovery is driven primarily by internal cost containment rather than broad demand acceleration. Approvals under the PRGP concluded on June 30, 2026, lifting cumulative approved program costs to $1,748 million ($1,434 million recognized through FY2026, leaving $314 million to be recorded in FY2027) to secure $1,200 million in annual run-rate gross savings through 10,000 net headcount reductions.
Execution risks remain concentrated across four financial constraints:
1. Cash Liquidity Drain: Settling PRGP accrued severance liabilities ($608 million of the $632 million accrued restructuring balance) requires $530 million in cash outflows in FY2027, coinciding with the maturity of $500 million in 3.150% Senior Notes on March 15, 2027, within an aggregate debt load of $7,306 million (Net Debt: $3,808 million; Adjusted Leverage: 1.53x).
2. Balance Sheet Impairment Sensitivity: Following $1,286 million in FY2025 write-downs ($773 million TOM FORD trademark, $138 million Too Faced goodwill/trademark, $375 million Dr.Jart+ intangibles), valuation cushions are thin. Dr.Jart+ ($37 million carrying value) carries a 4.00% fair value cushion (vulnerable to a 30 bps WACC increase or 4.00% sales decline); Too Faced ($62 million carrying value) maintains a 13.00% cushion (vulnerable to a 130 bps WACC increase or 11.00% sales drop); TOM FORD ($1,805 million carrying value) has a 19.00% cushion, which would be eliminated by a 140 bps increase in WACC.
3. R&D De-leveraging: Reducing research investment to 1.85% of revenue (down from 2.31% in FY2024) presents formulation pipeline risks against agile, digital-first competitors.
4. Supply Chain Tariffs: Projected tariff escalations in FY2027 threaten to compress gross margins if regional production shifting cannot fully offset cross-border duties.
Presentation Download & Video Access:
Presentation Download: Click the PDF download link under 'Related Topics' to access the full institutional presentation of this report.
Video Link: Click this link to watch the HDIN analyst briefing on YouTube.
About HDIN Research:
HDIN Research is a premier global market intelligence and strategic advisory firm specializing in institutional-grade financial analysis, supply chain audits, and macroeconomic forecasting. Our dedicated sector analysts deliver actionable, data-driven insights tailored for private equity, hedge funds, and corporate strategy teams. Visit us at http://www.hdinresearch.com.
2026 AI Transparency Footer:
"This intelligence report was authored by HDIN Research analysts following a rigorous audit of official corporate filings. AI was utilized for massive-scale data synthesis and structural drafting, ensuring 100% inclusion of reported data points. All strategic insights, financial modeling, and final verdicts were verified by our editorial board to ensure professional accuracy and compliance with 2026 Google Search E-E-A-T standards."
1. The Estée Lauder Companies Inc. expanded gross margin by 150 bps to 75.50% in FY2026, driven by an 80 bps reduction in inventory obsolescence and 55 bps in supply chain efficiencies under its Profit Recovery and Growth Plan (PRGP).
2. The company finalized restructuring approvals to unlock $1.20 billion in annual gross savings via 10,000 net position cuts, facing a $530 million cash restructuring drain and a $500 million debt maturity in FY2027.
3. Operating margins remain structurally fragile due to thin trademark valuation cushions—Dr.Jart+ at 4% and Too Faced at 13%—alongside elevated counterparty credit risk with its primary China travel retail customer.
Figure FY2026 Executive Performance Dashboard: The Estée Lauder Companies Inc (EL)
Segmental Realities and Margin CompressionThe Estée Lauder Companies Inc. [NYSE: EL] reported consolidated Net Sales of $15,049 million for Fiscal Year 2026 (ended June 30, 2026), representing a 5.04% reported increase (3.00% in constant currency) from $14,326 million in FY2025. Gross profit reached $11,362 million, lifting Gross Margin by 150 basis points (bps) to 75.50%.
The gross margin expansion was driven by:
* Inventory obsolescence control (+80 bps) via PRGP zero-waste forecasting.
* Manufacturing costs and supply chain efficiencies (+55 bps), offsetting a 15 bps headwind from material cost inflation and global tariffs.
* Favorable business category mix (+30 bps).
* Negative foreign exchange transaction hedging drag (-15 bps).
Operating performance shifted to a GAAP Operating Income of $780 million (5.18% operating margin), compared to a GAAP operating loss of $(785) million (-5.48% margin) in FY2025. On a Non-GAAP adjusted basis—excluding $823 million in restructuring charges and an $84 million securities class-action litigation settlement—Operating Income stood at $1,687 million (11.20% adjusted operating margin), a 47.21% increase from $1,146 million (8.00% adjusted margin) in FY2025. GAAP Net Earnings attributable to the enterprise recovered to $182 million ($0.50 diluted EPS), compared to a net loss of $(1,133) million ($(3.15) diluted EPS) in FY2025, while adjusted diluted EPS rose 66.23% to $2.51.
Table Product Segment Revenue Growth and Operating Performance Analysis (FY2025–FY2026)
| Product Segment | FY2026 Net Sales ($M) | FY2025 Net Sales ($M) | Reported YoY (%) | Organic (CC) YoY (%) | FY2026 GAAP Operating Income (Loss) ($M) | FY2025 GAAP Operating Income (Loss) ($M) | FY2026 Non-GAAP Adjusted Op. Income ($M) | FY2025 Non-GAAP Adjusted Op. Income ($M) |
| Skin Care | $7,338 | $6,962 | +5.40% | +4.00% | $1,416 | $574 | $1,443 | $949 |
| Makeup | $4,276 | $4,205 | +1.69% | 0.00% | $(70) | $(441) | $(35) | $26 |
| Fragrance | $2,779 | $2,491 | +11.56% | +10.00% | $204 | $(378) | $217 | $171 |
| Hair Care | $565 | $565 | 0.00% | -1.00% | $(4) | $(41) | $5 | $(41) |
| Other | $103 | $100 | +3.00% | +3.00% | $57 | $(13) | $57 | $41 |
| Restructuring Adjustments | $(12) | $3 | — | — | $(823) | $(486) | — | — |
| Consolidated Total | $15,049 | $14,326 | +5.04% | +3.00% | $780 | $(785) | $1,687 | $1,146 |
Category and pricing mix diagnostics highlight divergence across product portfolios:
* Skin Care generated 48.76% of net sales and $1,416 million in GAAP operating profit (19.30% operating margin), supported by pricing/mix growth of 3.00% led by La Mer's The Treatment Lotion franchise and Estée Lauder hero lines.
* Fragrance delivered 11.56% reported growth to $2,779 million, driven by 7.00% volume growth and 3.00% pricing realization across Le Labo, TOM FORD Private Blend, and KILIAN PARIS.
* Makeup grew 1.69% reported (flat organic) as a 3.00% volume increase from M·A·C lip lines was offset by a 4.00% pricing/mix contraction from heavy promotional discounting, driving adjusted operating margins down 140 bps to -0.82% ($(35) million loss).
* Hair Care generated flat reported sales of $565 million (-1.00% constant currency) as Aveda physical retail door closures were counterbalanced by expansion onto Amazon's U.S. Premium Beauty store.
The company's GAAP effective tax rate was 64.80% in FY2026, driven by a $52 million tax charge resulting from the One Big Beautiful Bill Act (interest expense deduction limits generating excess foreign tax credits) and a total deferred tax asset valuation allowance of $525 million.
Working capital audits show a contraction in the Cash Conversion Cycle (CCC) by 22.06 days to 86.36 days (Average Balance Method) or 78.50 days (Ending Balance Method). Days Sales Outstanding (DSO) declined by 4.95 days to 36.96 days, Days Inventory Outstanding (DIO) fell by 10.40 days to 201.61 days ($1,999 million ending inventory), and Days Payables Outstanding (DPO) expanded by 6.71 days to 152.21 days ($1,578 million ending balance), supported by $87 million in confirmed obligations within the Supplier Finance Program. Accrued Sales Incentives climbed 5.30% to $338 million, while non-credit Customer Deductions reached $14 million.
Operating Cash Flow reached $1,773 million (up 39.39%), while Capital Expenditures were reduced by 24.09% to $457 million (down from $919 million in FY2024), generating Free Cash Flow (FCF) of $1,316 million (96.42% year-over-year increase). Dividends paid were curtailed to $1.40 per share ($508 million total) against $1.71 in FY2025 and $2.64 in FY2024. Share repurchases remained suspended.
Infrastructure Layout and Regional Moats
Effective July 1, 2025, The Estée Lauder Companies Inc. recast its geographic reporting structure into four operational divisions, decoupling Mainland China and Travel Retail:
Table Geographic Revenue Performance and Regional Profitability Analysis (FY2025–FY2026)
| FY2026 Net Sales ($M) | FY2025 Net Sales ($M) | Reported YoY (%) | Constant Currency YoY (%) | FY2026 GAAP Operating Income (Loss) ($M) | FY2025 GAAP Operating Income (Loss) ($M) | Non-GAAP Adjusted Op. Income ($M) FY26 / FY25 | |
| The Americas | $4,463 | $4,410 | +1.20% | +1.00% | $211 | $(818) | $295 / $252 |
| EUKEM (ex-Travel Retail) | $3,794 | $3,566 | +6.39% | +1.00% | $196 | $145 | $196 / $145 |
| Asia/Pacific (incl. Travel Retail) | $3,746 | $3,606 | +3.88% | +4.00% | $823 | $180 | $823 / $555 |
| Mainland China (Domestic) | $3,058 | $2,741 | +11.57% | +9.00% | $373 | $194 | $373 / $194 |
| Restructuring Adjustments | $(12) | $3 | — | — | $(823) | $(486) | — |
| Consolidated Total | $15,049 | $14,326 | +5.04% | +3.00% | $780 | $(785) | $1,687 / $1,146 |
On a physical shipping destination basis, Mainland China accounted for $3,930 million (26.11% of consolidated net sales), exceeding the United States at $3,749 million (24.91%). Domestic Mainland China operating profit grew 92.27% to $373 million, heavily supported by the timing of local government subsidies. Travel retail stabilized across South Korea and Hainan, though airport concession transitions in Beijing and Shanghai created operational friction. Concentration risk intensified: the company's largest wholesale customer (operating in China travel retail) represented 10.61% ($161 million) of total accounts receivable ($1,518 million), up from 6.77% ($97 million) in FY2025.
The global production and real estate architecture comprises dedicated internal facilities and regional centers:
* Manufacturing Plants: Internal manufacturing is concentrated across owned facilities in Belgium (4 plants), Canada, Japan (1 plant), Switzerland, the United Kingdom, and the United States (2 owned, 2 leased). Four facilities are specialized for skin care and makeup, three for skin care, two for makeup, two for skin care and fragrance, and one for hair care.
* Research & Development: Research spend dropped 12.03% to $278 million (1.85% of net sales) with headcount rationalized to 1,000 personnel. Physical hubs include leased facilities at Estée Lauder Companies Innovation R&D (China) Co. Ltd. in Shanghai, regional laboratories in Japan and the United Kingdom, and central headquarters laboratories in New York.
* Logistics Footprint: Dedicated travel retail distribution is operated from an owned hub in Asia/Pacific, complemented by leased distribution networks across The Americas (6 facilities), EUKEM (3 facilities), and Mainland China (1 facility). Total undiscounted operating lease liabilities stand at $2,181 million ($1,940 million present value: $399 million current, $1,541 million noncurrent). Unconditional purchase commitments total $3,974 million, including $2,224 million due in FY2027.
Corporate governance remains controlled by the Lauder family via dual-class equity: 247,291,223 Class A shares (1 vote) and 114,507,344 Class B shares (10 votes), conferring approximately 82.00% voting power to family holders and utilizing NYSE "controlled company" exemptions.
HDIN Institutional Verdict
The Estée Lauder Companies Inc.'s operating recovery is driven primarily by internal cost containment rather than broad demand acceleration. Approvals under the PRGP concluded on June 30, 2026, lifting cumulative approved program costs to $1,748 million ($1,434 million recognized through FY2026, leaving $314 million to be recorded in FY2027) to secure $1,200 million in annual run-rate gross savings through 10,000 net headcount reductions.
Execution risks remain concentrated across four financial constraints:
1. Cash Liquidity Drain: Settling PRGP accrued severance liabilities ($608 million of the $632 million accrued restructuring balance) requires $530 million in cash outflows in FY2027, coinciding with the maturity of $500 million in 3.150% Senior Notes on March 15, 2027, within an aggregate debt load of $7,306 million (Net Debt: $3,808 million; Adjusted Leverage: 1.53x).
2. Balance Sheet Impairment Sensitivity: Following $1,286 million in FY2025 write-downs ($773 million TOM FORD trademark, $138 million Too Faced goodwill/trademark, $375 million Dr.Jart+ intangibles), valuation cushions are thin. Dr.Jart+ ($37 million carrying value) carries a 4.00% fair value cushion (vulnerable to a 30 bps WACC increase or 4.00% sales decline); Too Faced ($62 million carrying value) maintains a 13.00% cushion (vulnerable to a 130 bps WACC increase or 11.00% sales drop); TOM FORD ($1,805 million carrying value) has a 19.00% cushion, which would be eliminated by a 140 bps increase in WACC.
3. R&D De-leveraging: Reducing research investment to 1.85% of revenue (down from 2.31% in FY2024) presents formulation pipeline risks against agile, digital-first competitors.
4. Supply Chain Tariffs: Projected tariff escalations in FY2027 threaten to compress gross margins if regional production shifting cannot fully offset cross-border duties.
Presentation Download & Video Access:
Presentation Download: Click the PDF download link under 'Related Topics' to access the full institutional presentation of this report.
Video Link: Click this link to watch the HDIN analyst briefing on YouTube.
About HDIN Research:
HDIN Research is a premier global market intelligence and strategic advisory firm specializing in institutional-grade financial analysis, supply chain audits, and macroeconomic forecasting. Our dedicated sector analysts deliver actionable, data-driven insights tailored for private equity, hedge funds, and corporate strategy teams. Visit us at http://www.hdinresearch.com.
2026 AI Transparency Footer:
"This intelligence report was authored by HDIN Research analysts following a rigorous audit of official corporate filings. AI was utilized for massive-scale data synthesis and structural drafting, ensuring 100% inclusion of reported data points. All strategic insights, financial modeling, and final verdicts were verified by our editorial board to ensure professional accuracy and compliance with 2026 Google Search E-E-A-T standards."