Direct Drive Tech Limited: Gearless Actuator Dominance Confronts Client Monopsony and Chapter 18C Valuation Squeeze
Date : 2026-08-27
Reading : 170
HDIN Executive Takeaways
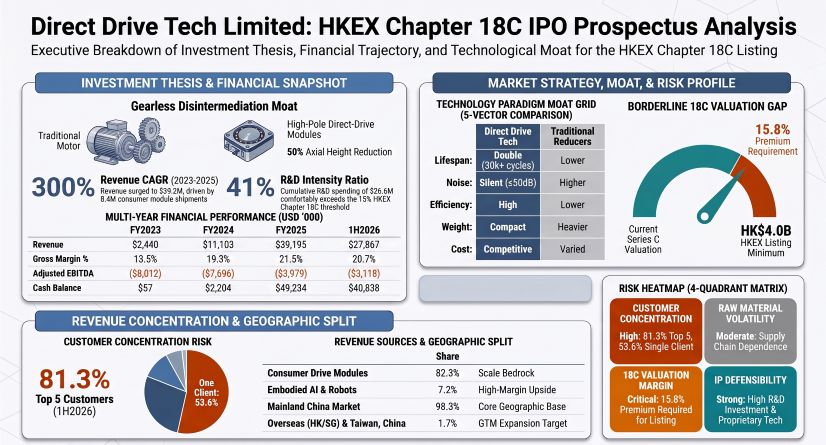
1. Direct Drive Tech Limited captured 61.1% of China's consumer direct-drive power module market in 2025, generating RMB 281.72M ($39.20M) in FY2025 revenue (+253.0% YoY) and narrowing Adjusted EBITDA margins from -328.34% in FY2023 to -10.15% in FY2025.
2. Downstream concentration represents a primary operational risk, with Customer C generating 53.6% of 1H2026 revenue and the top 5 accounts controlling 81.3%, while procurement remains concentrated across critical rare-earth neodymium and copper suppliers (top-5 procurement share at 38.4% in 1H2026).
3. Under HKEX Chapter 18C Commercialised criteria, the company comfortably meets revenue (HK$305.55M vs HK$250.00M minimum) and R&D intensity requirements (42.8% vs 15.0% minimum), but faces a 13.6% valuation gap against the statutory HK$4.00B listing market capitalization hurdle based on its Series C post-money baseline of RMB 3.185B ($443.19M / HK$3.455B).
Figure Direct Drive Tech Limited: HKEX Chapter 18C lPO Prospectus Analysis
 Segmental Realities, Unit Economics, and Margin Compression
Direct Drive Tech Limited's revenue model has undergone a complete structural rotation away from bespoke industrial automation toward high-volume consumer robotics drive modules. The consumer vertical expanded from 18.28% of top-line revenue in FY2023 to 87.95% in FY2025 and 82.34% in 1H2026. Top-line revenue increased from RMB 17.54M ($2.44M) in FY2023 to RMB 79.80M ($11.10M) in FY2024, RMB 281.72M ($39.20M) in FY2025, and reached RMB 200.30M ($27.87M) in 1H2026.
Table Consolidated Financial Statement and Adjusted Metric Reconciliations
*Monetary amounts in thousands, except per-share and percentage data; FX baseline: 1 USD = 7.1875 RMB
The widening of reported net losses to RMB 880.98M ($122.57M) in FY2025 is driven by non-cash IFRS accounting items, specifically RMB 770.07M in fair value adjustments on financial instruments with preferred redemption rights issued to private investors.
Multi-Year Product Segment Performance and Unit Trajectories
* Consumer Robotics Drive Modules: Sales volume grew from 115,237 units in FY2023 (ASP: RMB 28 / $3.90) to 2,104,298 units in FY2024 (ASP: RMB 30 / $4.17), 8,424,819 units in FY2025 (ASP: RMB 29 / $4.03), and 5,660,254 units in 1H2026 (ASP: RMB 29 / $4.03). Segment gross margin expanded from 3.43% in FY2023 (gross profit: RMB 110k / $15.30k) to 12.84% in FY2024 (gross profit: RMB 8,213k / $1,142.68k), 19.21% in FY2025 (gross profit: RMB 47,582k / $6,620.10k), before moderating to 17.24% in 1H2026 (gross profit: RMB 28,428k / $3,955.20k).
* Commercial & Industrial Applications: Industrial AGV/AMR module volume reached 15,248 units in FY2023 (ASP: RMB 65), 9,833 units in FY2024 (ASP: RMB 235), 19,596 units in FY2025 (ASP: RMB 146), and 70,584 units in 1H2026 (ASP: RMB 97), generating RMB 6.87M ($955.13k) in 1H2026. Commercial service modules delivered 55,106 units in FY2023 (ASP: RMB 182), 28,899 units in FY2024 (ASP: RMB 214), 53,468 units in FY2025 (ASP: RMB 318), and 27,202 units in 1H2026 (ASP: RMB 520 / $72.35), generating RMB 14.13M ($1.97M) in 1H2026. Segment gross margin moved from 9.75% in FY2023 to 36.36% in FY2024, 29.64% in FY2025, and 27.46% in 1H2026.
* Embodied AI Joint Modules: Unit shipments scaled from 58 units in FY2023 (ASP: RMB 259) to 10,278 units in FY2024 (ASP: RMB 261), 12,276 units in FY2025 (ASP: RMB 554), and 12,878 units in 1H2026 (ASP: RMB 257). Revenue generated was RMB 15k ($2.09k) in FY2023, RMB 2.68M ($373.01k) in FY2024, RMB 6.80M ($945.81k) in FY2025, and RMB 3.31M ($459.83k) in 1H2026. Gross margins tracked at 33.33%, 53.60%, 35.64%, and 29.17% across the respective periods.
* Wheeled-Legged Robots: Complete system deliveries totaled 257 units in FY2023 (ASP: RMB 12,922 / $1,797.84), 125 units in FY2024 (ASP: RMB 37,120 / $5,164.52), 240 units in FY2025 (ASP: RMB 30,446 / $4,235.97), and 230 units in 1H2026 (ASP: RMB 48,117 / $6,694.54). System gross margins reached 35.38% in FY2023, 57.26% in FY2024, 64.25% in FY2025, and 56.47% in 1H2026, delivering RMB 11.07M ($1.54M) in 1H2026 revenue.
* Second-Generation IPM Fitness/Damper Motors: Currently under development with mass production slated for late 2026; generated RMB 0 in commercial revenue during the Track Record Period.
The consolidated Cost of Sales structure for FY2025 totaled RMB 221.13M ($30.77M): raw materials represented 67.97% (RMB 150.30M / $20.91M), outsourced EMS processing fees accounted for 15.51% (RMB 34.30M / $4.77M), direct labor comprised 10.59% (RMB 23.42M), manufacturing overhead was 4.18% (RMB 9.24M), and shipping/write-downs totaled 1.75% (RMB 3.87M).
Within the RMB 150.30M raw materials envelope for FY2025, enameled copper wire constituted 27.0% (RMB 40.58M), PCBA electronic components represented 20.0% (RMB 30.06M), neodymium permanent magnets accounted for 18.0% (RMB 27.05M), iron cores represented 9.0% (RMB 13.53M), machined structural parts comprised 4.0% (RMB 6.01M), and packaging/auxiliary materials totaled 22.0% (RMB 33.07M). In 1H2026, raw material procurement costs stood at RMB 110.20M ($15.33M), representing 69.35% of total Cost of Sales.
Inventories increased by 157.07% during 1H2026 to RMB 82.57M ($11.49M), up from RMB 32.12M ($4.47M) in FY2025, RMB 26.22M ($3.65M) in FY2024, and RMB 13.83M ($1.92M) in FY2023. The 1H2026 gross inventory composition comprises raw materials of RMB 52.60M ($7.32M), work-in-progress of RMB 5.50M ($765.50k), finished goods of RMB 21.36M ($2.97M), and goods in transit of RMB 3.11M ($432.83k), less accumulated inventory provisions of RMB 2.26M ($314.02k).
Gross trade receivables expanded from RMB 10.15M in FY2023 to RMB 44.70M in FY2024, RMB 81.63M in FY2025, and RMB 174.99M ($24.35M) in 1H2026, alongside bills receivable of RMB 2.62M ($364.24k) and expected credit loss allowances of RMB 6.87M ($956.24k). Operating cash outflows tracked at RMB 52.96M ($7.37M) in FY2023, RMB 66.69M ($9.28M) in FY2024, RMB 69.56M ($9.68M) in FY2025, and RMB 64.80M ($9.01M) in 1H2026.
Capital expenditures stood at RMB 8.22M ($1.14M) in FY2023, RMB 5.03M ($700.24k) in FY2024, RMB 16.39M ($2.28M) in FY2025, and RMB 12.97M ($1.80M) in 1H2026. Free cash outflow was RMB 61.18M in FY2023, RMB 71.72M in FY2024, RMB 85.95M in FY2025, and RMB 77.76M ($10.82M) in 1H2026. Supported by RMB 293.52M ($40.84M) in cash and cash equivalents and an average monthly burn rate of RMB 13.20M ($1.84M) in 1H2026, the company's operating liquidity runway is 22.24 months.
Infrastructure Layout, Supply Chain Architecture, and Pre-IPO Cap Table
The company operates an R&D headquarters in Beijing alongside two manufacturing and assembly facilities located in Dongguan, Guangdong Province, comprising a combined Gross Floor Area (GFA) of 24,287.2 sq.m.
In the consumer power module segment, design capacity rose from 790,000 units in FY2023 (actual production: 300,000 units; utilization: 38.0%) to 4,082,000 units in FY2024 (actual production: 2,249,000 units; utilization: 55.1%), 15,730,000 units in FY2025 (actual production: 8,510,000 units; utilization: 54.1%), and 10,500,000 units annualized in 1H2026 (actual production: 7,424,000 units; utilization: 70.7%). For wheeled-legged robots, design capacity moved from 335 units in FY2023 (production: 267; utilization: 79.7%) to 419 units in FY2024 (production: 210; utilization: 50.1%), 501 units in FY2025 (production: 240; utilization: 47.9%), and 501 units in 1H2026 (production: 294; utilization: 58.7%).
To eliminate a daily assembly deficit where peak client demand of 90,000 sets per day exceeded internal nameplate assembly capacity of 50,000 sets per day, the company executed a physical factory relocation in Dongguan during July and August 2026. The deployment of 4 automated assembly lines in late 2026 is modeled to elevate the overall automation threshold above 50%, with operational targets to reduce unit assembly labor costs by 10% to 15% by 2027.
R&D operations are supported by 192 researchers as of June 30, 2026 (representing 34.91% of total corporate headcount of 550), with 94.27% holding bachelor's degrees or higher. R&D expenditure expensed through the P&L totaled RMB 39.04M ($5.43M) in FY2023, RMB 42.92M ($5.97M) in FY2024, RMB 55.44M ($7.71M) in FY2025, and RMB 53.59M ($7.46M) in 1H2026 (representing 26.75% of 1H2026 revenue), yielding cumulative R&D spending of RMB 190.99M ($26.57M) at a 0% capitalization rate under IAS 38.
The IP portfolio consists of 345 granted domestic patents (46 invention patents, 228 utility models, and 71 industrial designs) and 136 pending applications. Two non-core motor simulation patents co-owned with academic partners were fully open-sourced, and the company maintains zero third-party licensing dependencies across its core commercial product lines.
The supply chain relies on a network of 21 third-party EMS partners in 1H2026 (22 in FY2025, 17 in FY2024, 11 in FY2023). Total procurement climbed from RMB 27.39M in FY2023 to RMB 72.80M in FY2024, RMB 197.25M in FY2025, and RMB 193.75M ($26.96M) in 1H2026. Top-5 supplier concentration stood at 35.8% in FY2023, 36.4% in FY2024, 40.1% in FY2025, and 38.4% in 1H2026.
The single largest supplier represented 14.0% (Supplier A - Iron Cores) in FY2023, 9.6% (Supplier C - Electronic Components) in FY2024, 10.6% (Supplier H - Enameled Copper Wire) in FY2025, and 11.3% (Supplier I - Neodymium Magnets) in 1H2026. In 1H2026, rare-earth magnet sourcing was controlled by Supplier I (RMB 21.83M / 11.3%) and Supplier K (RMB 8.84M / 4.6%), while copper wire procurement was dominated by Supplier H (RMB 21.71M / 11.2%).
Across 12 financing rounds, the equity capital base expanded from a Seed valuation of RMB 5.00M ($695.60k) in April 2020 to RMB 3.185B ($443.19M) in the Series C round in December 2025. Per-share purchase prices adjusted for the post-split capital base of 319,588,080 shares increased from RMB 1.22 in Series Pre-A to RMB 2.68 in Series A, RMB 3.15 in Series Pre-B, RMB 3.48 in Series B, RMB 4.03 in Series B++, and RMB 9.97 ($1.39) in Series C.
The shareholder registry includes Lenovo Capital, Legend Star, Legend Capital, Shunxi Fund Phase III, Beijing National Capital (via Advanced Manufacturing Fund, committing RMB 140.0M in Series B), SenseTime (via Beijing Chenkun), Rockets Capital (XPeng Inc. [NYSE: XPEV / 9868.HK]), and Songshan Lake Robotics Institute / Yunhe Investment (Prof. Li Zexiang entities holding 3.39% combined). An InnoVen Capital venture loan of RMB 13.0M was fully settled in December 2025 with 98,736 shares issued under net warrants.
HDIN Institutional Verdict
Direct Drive Tech Limited has established a defensible technical moat in direct-drive actuator design, achieving a 61.1% domestic market share in consumer direct-drive modules by delivering 15–20 Nm/kg torque densities, sub-±0.1% torque ripple via harmonic injection algorithms, and a 50% reduction in axial package dimensions compared to traditional planetary/spur geared assemblies.
However, forensic examination of filing disclosures confirms that management's operational leverage is constrained by downstream buyer monopsony:
Customer C accounted for 53.58% of 1H2026 revenue, and the top 5 accounts generated 81.35%, while receivables turnover lengthened by 35 days in 1H2026 to 112 days. The consumer drive module line, while providing manufacturing scale (surpassing 5.0 million cumulative units shipped), operates at a compressed gross margin of 17.24% in 1H2026. This limits the company's internal cash-generation capabilities ahead of its planned global expansion across Japan, South Korea, Canada, and Germany.
From an HKEX Chapter 18C regulatory standpoint, the company satisfies the commercialisation track record criteria with audited FY2025 revenues of HK$305.55M ($39.20M / RMB 281.72M) against the HK$250.00M statutory floor, alongside a three-year aggregate R&D expenditure intensity of 42.8% against the 15.0% statutory minimum.
Nonetheless, a compliance barrier remains: the last private post-money valuation of RMB 3.185B ($443.19M) translates to HK$3.455B, creating a HK$545.0M ($69.93M) deficit against the mandatory HK$4.00B expected market capitalization threshold. Institutional clearance of the listing requires the offering to price at an implied minimum step-up of 15.77% over its Series C valuation baseline.
Presentation Download & Video Access:
- Presentation Download: Click the PDF download link under 'Related Topics' to access the full institutional presentation of this report.
- Video Link: Click this link to watch the HDIN analyst briefing on YouTube.
About HDIN Research:
HDIN Research is a premier global market intelligence and strategic advisory firm specializing in institutional-grade financial analysis, supply chain audits, and macroeconomic forecasting. Our dedicated sector analysts deliver actionable, data-driven insights tailored for private equity, hedge funds, and corporate strategy teams. Visit us at http://www.hdinresearch.com.
2026 AI Transparency Footer:
"This intelligence report was authored by HDIN Research analysts following a rigorous audit of official corporate filings. AI was utilized for massive-scale data synthesis and structural drafting, ensuring 100% inclusion of reported data points. All strategic insights, financial modeling, and final verdicts were verified by our editorial board to ensure professional accuracy and compliance with 2026 Google Search E-E-A-T standards."
1. Direct Drive Tech Limited captured 61.1% of China's consumer direct-drive power module market in 2025, generating RMB 281.72M ($39.20M) in FY2025 revenue (+253.0% YoY) and narrowing Adjusted EBITDA margins from -328.34% in FY2023 to -10.15% in FY2025.
2. Downstream concentration represents a primary operational risk, with Customer C generating 53.6% of 1H2026 revenue and the top 5 accounts controlling 81.3%, while procurement remains concentrated across critical rare-earth neodymium and copper suppliers (top-5 procurement share at 38.4% in 1H2026).
3. Under HKEX Chapter 18C Commercialised criteria, the company comfortably meets revenue (HK$305.55M vs HK$250.00M minimum) and R&D intensity requirements (42.8% vs 15.0% minimum), but faces a 13.6% valuation gap against the statutory HK$4.00B listing market capitalization hurdle based on its Series C post-money baseline of RMB 3.185B ($443.19M / HK$3.455B).
Figure Direct Drive Tech Limited: HKEX Chapter 18C lPO Prospectus Analysis
Segmental Realities, Unit Economics, and Margin CompressionDirect Drive Tech Limited's revenue model has undergone a complete structural rotation away from bespoke industrial automation toward high-volume consumer robotics drive modules. The consumer vertical expanded from 18.28% of top-line revenue in FY2023 to 87.95% in FY2025 and 82.34% in 1H2026. Top-line revenue increased from RMB 17.54M ($2.44M) in FY2023 to RMB 79.80M ($11.10M) in FY2024, RMB 281.72M ($39.20M) in FY2025, and reached RMB 200.30M ($27.87M) in 1H2026.
Table Consolidated Financial Statement and Adjusted Metric Reconciliations
| Financial Line Item | FY2023 (RMB) | FY2023 (USD) | FY2024 (RMB) | FY2024 (USD) | FY2025 (RMB) | FY2025 (USD) | 1H2026 (RMB) | 1H2026 (USD) |
| Total Revenue | 17,538 | $2,440.07 | 79,802 | $11,102.89 | 281,715 | $39,195.13 | 200,295 | $27,867.13 |
| Cost of Sales (COGS) | (15,176) | $(2,111.44) | (64,406) | $(8,960.83) | (221,130) | $(30,765.91) | (158,888) | $(22,106.16) |
| Gross Profit | 2,362 | $328.63 | 15,396 | $2,142.05 | 60,585 | $8,429.22 | 41,407 | $5,760.97 |
| Gross Margin (%) | 13.47% | 13.47% | 19.29% | 19.29% | 21.51% | 21.51% | 20.67% | 20.67% |
| Reported Net Loss | (75,585) | $(10,516.17) | (93,735) | $(13,041.39) | (880,977) | $(122,570.71) | (390,732) | $(54,362.71) |
| Share-Based Payments | 2,050 | $285.22 | 15,350 | $2,135.65 | 58,760 | $8,175.30 | 62,700 | $8,723.48 |
| Redemption Liabilities Value Shift | 12,312 | $1,713.00 | 16,791 | $2,336.14 | 770,070 | $107,140.17 | 284,632 | $39,601.00 |
| Listing Expenses | — | — | — | — | 8,900 | $1,238.26 | 15,900 | $2,212.17 |
| Adjusted Net Loss | (61,223) | $(8,517.98) | (61,594) | $(8,569.60) | (43,247) | $(6,016.97) | (27,500) | $(3,826.09) |
| Adjusted Net Margin (%) | -349.09% | -349.09% | -77.18% | -77.18% | -15.35% | -15.35% | -13.73% | -13.73% |
| Adjusted EBITDA | (57,585) | $(8,011.83) | (55,317) | $(7,696.28) | (28,598) | $(3,978.85) | (22,412) | $(3,118.19) |
| Adjusted EBITDA Margin (%) | -328.34% | -328.34% | -69.32% | -69.32% | -10.15% | -10.15% | -11.19% | -11.19% |
The widening of reported net losses to RMB 880.98M ($122.57M) in FY2025 is driven by non-cash IFRS accounting items, specifically RMB 770.07M in fair value adjustments on financial instruments with preferred redemption rights issued to private investors.
Multi-Year Product Segment Performance and Unit Trajectories
* Consumer Robotics Drive Modules: Sales volume grew from 115,237 units in FY2023 (ASP: RMB 28 / $3.90) to 2,104,298 units in FY2024 (ASP: RMB 30 / $4.17), 8,424,819 units in FY2025 (ASP: RMB 29 / $4.03), and 5,660,254 units in 1H2026 (ASP: RMB 29 / $4.03). Segment gross margin expanded from 3.43% in FY2023 (gross profit: RMB 110k / $15.30k) to 12.84% in FY2024 (gross profit: RMB 8,213k / $1,142.68k), 19.21% in FY2025 (gross profit: RMB 47,582k / $6,620.10k), before moderating to 17.24% in 1H2026 (gross profit: RMB 28,428k / $3,955.20k).
* Commercial & Industrial Applications: Industrial AGV/AMR module volume reached 15,248 units in FY2023 (ASP: RMB 65), 9,833 units in FY2024 (ASP: RMB 235), 19,596 units in FY2025 (ASP: RMB 146), and 70,584 units in 1H2026 (ASP: RMB 97), generating RMB 6.87M ($955.13k) in 1H2026. Commercial service modules delivered 55,106 units in FY2023 (ASP: RMB 182), 28,899 units in FY2024 (ASP: RMB 214), 53,468 units in FY2025 (ASP: RMB 318), and 27,202 units in 1H2026 (ASP: RMB 520 / $72.35), generating RMB 14.13M ($1.97M) in 1H2026. Segment gross margin moved from 9.75% in FY2023 to 36.36% in FY2024, 29.64% in FY2025, and 27.46% in 1H2026.
* Embodied AI Joint Modules: Unit shipments scaled from 58 units in FY2023 (ASP: RMB 259) to 10,278 units in FY2024 (ASP: RMB 261), 12,276 units in FY2025 (ASP: RMB 554), and 12,878 units in 1H2026 (ASP: RMB 257). Revenue generated was RMB 15k ($2.09k) in FY2023, RMB 2.68M ($373.01k) in FY2024, RMB 6.80M ($945.81k) in FY2025, and RMB 3.31M ($459.83k) in 1H2026. Gross margins tracked at 33.33%, 53.60%, 35.64%, and 29.17% across the respective periods.
* Wheeled-Legged Robots: Complete system deliveries totaled 257 units in FY2023 (ASP: RMB 12,922 / $1,797.84), 125 units in FY2024 (ASP: RMB 37,120 / $5,164.52), 240 units in FY2025 (ASP: RMB 30,446 / $4,235.97), and 230 units in 1H2026 (ASP: RMB 48,117 / $6,694.54). System gross margins reached 35.38% in FY2023, 57.26% in FY2024, 64.25% in FY2025, and 56.47% in 1H2026, delivering RMB 11.07M ($1.54M) in 1H2026 revenue.
* Second-Generation IPM Fitness/Damper Motors: Currently under development with mass production slated for late 2026; generated RMB 0 in commercial revenue during the Track Record Period.
The consolidated Cost of Sales structure for FY2025 totaled RMB 221.13M ($30.77M): raw materials represented 67.97% (RMB 150.30M / $20.91M), outsourced EMS processing fees accounted for 15.51% (RMB 34.30M / $4.77M), direct labor comprised 10.59% (RMB 23.42M), manufacturing overhead was 4.18% (RMB 9.24M), and shipping/write-downs totaled 1.75% (RMB 3.87M).
Within the RMB 150.30M raw materials envelope for FY2025, enameled copper wire constituted 27.0% (RMB 40.58M), PCBA electronic components represented 20.0% (RMB 30.06M), neodymium permanent magnets accounted for 18.0% (RMB 27.05M), iron cores represented 9.0% (RMB 13.53M), machined structural parts comprised 4.0% (RMB 6.01M), and packaging/auxiliary materials totaled 22.0% (RMB 33.07M). In 1H2026, raw material procurement costs stood at RMB 110.20M ($15.33M), representing 69.35% of total Cost of Sales.
Inventories increased by 157.07% during 1H2026 to RMB 82.57M ($11.49M), up from RMB 32.12M ($4.47M) in FY2025, RMB 26.22M ($3.65M) in FY2024, and RMB 13.83M ($1.92M) in FY2023. The 1H2026 gross inventory composition comprises raw materials of RMB 52.60M ($7.32M), work-in-progress of RMB 5.50M ($765.50k), finished goods of RMB 21.36M ($2.97M), and goods in transit of RMB 3.11M ($432.83k), less accumulated inventory provisions of RMB 2.26M ($314.02k).
Gross trade receivables expanded from RMB 10.15M in FY2023 to RMB 44.70M in FY2024, RMB 81.63M in FY2025, and RMB 174.99M ($24.35M) in 1H2026, alongside bills receivable of RMB 2.62M ($364.24k) and expected credit loss allowances of RMB 6.87M ($956.24k). Operating cash outflows tracked at RMB 52.96M ($7.37M) in FY2023, RMB 66.69M ($9.28M) in FY2024, RMB 69.56M ($9.68M) in FY2025, and RMB 64.80M ($9.01M) in 1H2026.
Capital expenditures stood at RMB 8.22M ($1.14M) in FY2023, RMB 5.03M ($700.24k) in FY2024, RMB 16.39M ($2.28M) in FY2025, and RMB 12.97M ($1.80M) in 1H2026. Free cash outflow was RMB 61.18M in FY2023, RMB 71.72M in FY2024, RMB 85.95M in FY2025, and RMB 77.76M ($10.82M) in 1H2026. Supported by RMB 293.52M ($40.84M) in cash and cash equivalents and an average monthly burn rate of RMB 13.20M ($1.84M) in 1H2026, the company's operating liquidity runway is 22.24 months.
Infrastructure Layout, Supply Chain Architecture, and Pre-IPO Cap Table
The company operates an R&D headquarters in Beijing alongside two manufacturing and assembly facilities located in Dongguan, Guangdong Province, comprising a combined Gross Floor Area (GFA) of 24,287.2 sq.m.
In the consumer power module segment, design capacity rose from 790,000 units in FY2023 (actual production: 300,000 units; utilization: 38.0%) to 4,082,000 units in FY2024 (actual production: 2,249,000 units; utilization: 55.1%), 15,730,000 units in FY2025 (actual production: 8,510,000 units; utilization: 54.1%), and 10,500,000 units annualized in 1H2026 (actual production: 7,424,000 units; utilization: 70.7%). For wheeled-legged robots, design capacity moved from 335 units in FY2023 (production: 267; utilization: 79.7%) to 419 units in FY2024 (production: 210; utilization: 50.1%), 501 units in FY2025 (production: 240; utilization: 47.9%), and 501 units in 1H2026 (production: 294; utilization: 58.7%).
To eliminate a daily assembly deficit where peak client demand of 90,000 sets per day exceeded internal nameplate assembly capacity of 50,000 sets per day, the company executed a physical factory relocation in Dongguan during July and August 2026. The deployment of 4 automated assembly lines in late 2026 is modeled to elevate the overall automation threshold above 50%, with operational targets to reduce unit assembly labor costs by 10% to 15% by 2027.
R&D operations are supported by 192 researchers as of June 30, 2026 (representing 34.91% of total corporate headcount of 550), with 94.27% holding bachelor's degrees or higher. R&D expenditure expensed through the P&L totaled RMB 39.04M ($5.43M) in FY2023, RMB 42.92M ($5.97M) in FY2024, RMB 55.44M ($7.71M) in FY2025, and RMB 53.59M ($7.46M) in 1H2026 (representing 26.75% of 1H2026 revenue), yielding cumulative R&D spending of RMB 190.99M ($26.57M) at a 0% capitalization rate under IAS 38.
The IP portfolio consists of 345 granted domestic patents (46 invention patents, 228 utility models, and 71 industrial designs) and 136 pending applications. Two non-core motor simulation patents co-owned with academic partners were fully open-sourced, and the company maintains zero third-party licensing dependencies across its core commercial product lines.
The supply chain relies on a network of 21 third-party EMS partners in 1H2026 (22 in FY2025, 17 in FY2024, 11 in FY2023). Total procurement climbed from RMB 27.39M in FY2023 to RMB 72.80M in FY2024, RMB 197.25M in FY2025, and RMB 193.75M ($26.96M) in 1H2026. Top-5 supplier concentration stood at 35.8% in FY2023, 36.4% in FY2024, 40.1% in FY2025, and 38.4% in 1H2026.
The single largest supplier represented 14.0% (Supplier A - Iron Cores) in FY2023, 9.6% (Supplier C - Electronic Components) in FY2024, 10.6% (Supplier H - Enameled Copper Wire) in FY2025, and 11.3% (Supplier I - Neodymium Magnets) in 1H2026. In 1H2026, rare-earth magnet sourcing was controlled by Supplier I (RMB 21.83M / 11.3%) and Supplier K (RMB 8.84M / 4.6%), while copper wire procurement was dominated by Supplier H (RMB 21.71M / 11.2%).
Across 12 financing rounds, the equity capital base expanded from a Seed valuation of RMB 5.00M ($695.60k) in April 2020 to RMB 3.185B ($443.19M) in the Series C round in December 2025. Per-share purchase prices adjusted for the post-split capital base of 319,588,080 shares increased from RMB 1.22 in Series Pre-A to RMB 2.68 in Series A, RMB 3.15 in Series Pre-B, RMB 3.48 in Series B, RMB 4.03 in Series B++, and RMB 9.97 ($1.39) in Series C.
The shareholder registry includes Lenovo Capital, Legend Star, Legend Capital, Shunxi Fund Phase III, Beijing National Capital (via Advanced Manufacturing Fund, committing RMB 140.0M in Series B), SenseTime (via Beijing Chenkun), Rockets Capital (XPeng Inc. [NYSE: XPEV / 9868.HK]), and Songshan Lake Robotics Institute / Yunhe Investment (Prof. Li Zexiang entities holding 3.39% combined). An InnoVen Capital venture loan of RMB 13.0M was fully settled in December 2025 with 98,736 shares issued under net warrants.
HDIN Institutional Verdict
Direct Drive Tech Limited has established a defensible technical moat in direct-drive actuator design, achieving a 61.1% domestic market share in consumer direct-drive modules by delivering 15–20 Nm/kg torque densities, sub-±0.1% torque ripple via harmonic injection algorithms, and a 50% reduction in axial package dimensions compared to traditional planetary/spur geared assemblies.
However, forensic examination of filing disclosures confirms that management's operational leverage is constrained by downstream buyer monopsony:
Customer C accounted for 53.58% of 1H2026 revenue, and the top 5 accounts generated 81.35%, while receivables turnover lengthened by 35 days in 1H2026 to 112 days. The consumer drive module line, while providing manufacturing scale (surpassing 5.0 million cumulative units shipped), operates at a compressed gross margin of 17.24% in 1H2026. This limits the company's internal cash-generation capabilities ahead of its planned global expansion across Japan, South Korea, Canada, and Germany.
From an HKEX Chapter 18C regulatory standpoint, the company satisfies the commercialisation track record criteria with audited FY2025 revenues of HK$305.55M ($39.20M / RMB 281.72M) against the HK$250.00M statutory floor, alongside a three-year aggregate R&D expenditure intensity of 42.8% against the 15.0% statutory minimum.
Nonetheless, a compliance barrier remains: the last private post-money valuation of RMB 3.185B ($443.19M) translates to HK$3.455B, creating a HK$545.0M ($69.93M) deficit against the mandatory HK$4.00B expected market capitalization threshold. Institutional clearance of the listing requires the offering to price at an implied minimum step-up of 15.77% over its Series C valuation baseline.
Presentation Download & Video Access:
- Presentation Download: Click the PDF download link under 'Related Topics' to access the full institutional presentation of this report.
- Video Link: Click this link to watch the HDIN analyst briefing on YouTube.
About HDIN Research:
HDIN Research is a premier global market intelligence and strategic advisory firm specializing in institutional-grade financial analysis, supply chain audits, and macroeconomic forecasting. Our dedicated sector analysts deliver actionable, data-driven insights tailored for private equity, hedge funds, and corporate strategy teams. Visit us at http://www.hdinresearch.com.
2026 AI Transparency Footer:
"This intelligence report was authored by HDIN Research analysts following a rigorous audit of official corporate filings. AI was utilized for massive-scale data synthesis and structural drafting, ensuring 100% inclusion of reported data points. All strategic insights, financial modeling, and final verdicts were verified by our editorial board to ensure professional accuracy and compliance with 2026 Google Search E-E-A-T standards."