Tianjin Chenxing Technology Co., Ltd.: Capitalization Discipline and Component Self-Sufficiency Shield Margins Amid 35.7% ASP Compression
Date : 2026-08-27
Reading : 101
HDIN Executive Takeaways
1. Tianjin Chenxing Technology Co., Ltd. expanded revenue at a 64.39% CAGR from RMB 93.49 million in 2023 to RMB 252.65 million in 2025, posting an adjusted net profit of RMB 10.23 million in 2025 alongside a 0% R&D capitalization policy.
2. In-house servo motor and drive integration expanded consolidated gross margin from 16.98% in 2023 to 30.45% in 2025, offsetting a 35.7% delta robot average selling price reduction from RMB 83,514 to RMB 53,661 by the first half of 2026.
3. Liquidity reserves of RMB 194.70 million and RMB 33.00 million in unutilized banking lines provide 27.8x coverage over RMB 8.18 million in short-term debt, providing 36.1 to 54.1 months of cash runway across peak burn rates.
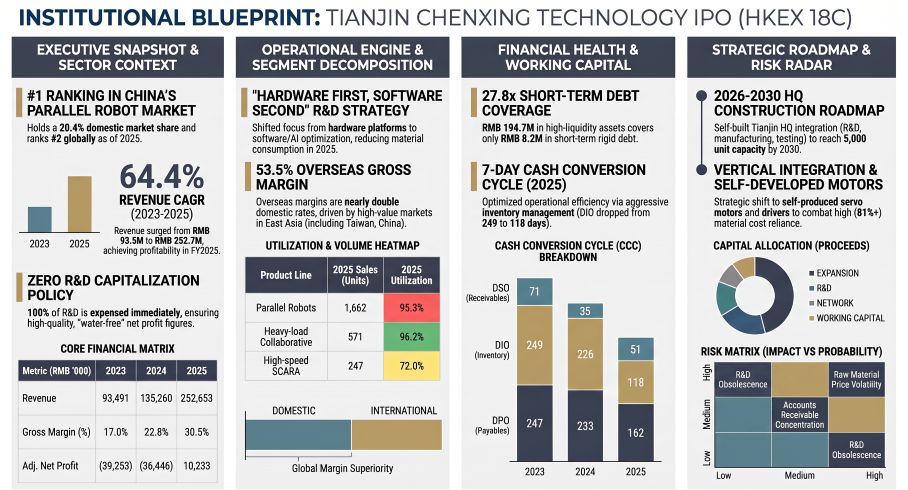
Figure TIANJIN CHENXING TECHNOLOGY IPO Institutional Blueprint
 Segmental Realities, Unit Economics, and Balance Sheet Dynamics
Tianjin Chenxing Technology Co., Ltd. (operating commercially as AtomRobot) reported top-line expansion across its audited track record period, driven by high-speed industrial robotics and bespoke automation solutions across food, beverage, new energy, and pharmaceutical end-markets.
Table CONSOLIDATED FINANCIAL PERFORMANCE (2023 – 1H2026) |
Table SEGMENTAL REVENUE, MARGINS, AND VOLUME BREAKDOWN |
Table WORKING CAPITAL, CASH CONVERSION CYCLE (CCC), AND BALANCE SHEET EFFICIENCY
Non-IFRS adjustments isolate core operational trends. In 2024, RMB 10.62 million in share-based compensation was added back to a reported net loss of RMB 47.07 million, yielding an adjusted net loss of RMB 36.45 million. In 2025, adjustments included RMB 4.44 million in share-based compensation and RMB 5.05 million in deemed listing expenses, converting a reported net profit of RMB 0.74 million to an adjusted net profit of RMB 10.23 million.
In the first half of 2026, reported net loss expanded 506.3% year-over-year to RMB 28.80 million, primarily driven by RMB 15.40 million in listing expenses and RMB 2.87 million in share-based payments. Adjusted net loss for 1H2026 stood at RMB 10.53 million compared to an adjusted net loss of RMB 2.76 million in 1H2025.
Direct material inputs represented 83.0% of cost of sales in 2023 (RMB 64.44 million), 80.7% in 2024, 81.9% in 2025 (RMB 143.91 million), and 81.4% in 1H2026. Government subsidies received totaled RMB 5.3 million in 2023, RMB 5.0 million in 2024, RMB 8.9 million in 2025, and RMB 0.4 million in 1H2026.
Industrial Footprint, Supply Chain Architecture, and Intellectual Property Moats
Tianjin Chenxing Technology Co., Ltd. operates five leased production facilities across China while advancing construction of an integrated, owned corporate headquarters in Tianjin.
Table MANUFACTURING INFRASTRUCTURE AND EXPANSION TARGETS
Annual production capacity targets post-upgrade specify 5,000 units across standard robotics lines in Tianjin, Wuxi, and Kunshan, alongside an annual output value of RMB 300.00 million at the Wujiang solution base, with consolidated capacity utilization targeted above 80%.
Table HISTORICAL PRODUCTION UTILIZATION RATES (2023 – 1H2026)
Geographic revenue execution shows international sales expansion from RMB 3.35 million in 2023 (3.6% mix) to RMB 26.50 million in 2025 (10.5% mix), registering a 181.19% CAGR. Overseas gross margin reached 53.5% in 2025 (compared to 27.8% domestically) and 49.4% in 1H2026 (versus 25.6% domestically). Regional breakdown includes East Asia (RMB 3.53 million in 2025), Southeast Asia (RMB 4.21 million), Middle East (RMB 11.12 million), Europe (RMB 2.71 million), North America (RMB 0.47 million), and other regions (RMB 4.47 million).
Table COUNTERPARTY CONCENTRATION AND REVENUE MIX (FY2023 – 1H2026)
Counterparty overlap analysis confirms four dual-role trading entities operating on arm's-length commercial terms:
- Client I (Packaging Integrator): Sales of RMB 0.9M (2023), RMB 4.4M (2024), RMB 5.7M (2025), RMB 3.1M (1H2026); material handling equipment purchases of RMB 0M, RMB 0.5M, RMB 0.6M, and RMB 0.9M.
- Client O (Packaging Machinery): Sales of RMB 2.5M, RMB 2.0M, RMB 1.7M, and RMB 0.4M; workstation procurement of RMB 1.2M, RMB 0.5M, RMB 0.2M, and RMB 0.1M.
- Supplier C (Inspection Tech): Purchases of RMB 0M, RMB 0.1M, RMB 5.6M, and RMB 4.5M; robot body sales of RMB 0M, RMB 0.1M, RMB 2.2M, and RMB 0.7M.
- Supplier D (Machining / Conveyors): Purchases of RMB 5.2M, RMB 3.5M, RMB 6.6M, and RMB 5.2M; robot body sales of RMB 0M, RMB 0M, RMB 0.3M, and RMB 0.5M.
The research division comprises 99 engineers (25.4% of 390 total personnel) with zero R&D capitalization across all periods. The patent estate encompasses 175 authorized patents globally (51 invention, 97 utility models, 23 design patents, alongside 4 overseas patents and 29 pending applications), 31 software copyrights, and 27 trademarks. Core patents include 4-DOF parallel kinematics (ZL2014105707432), multi-threaded real-time robot controllers (ZL2021115843132 / US12434385B2), and ZYNQ-based drive-control integration (ZL2023100922234). Peripheral harness assembly outsourcing costs remained modest at RMB 0.2M (2023), RMB 0.4M (2024), RMB 0.6M (2025), and RMB 0.7M (1H2026).
Table PRE-IPO FINANCING EVOLUTION AND CAPITAL BASE EXPANSION
Total cumulative net cash funding reached RMB 307.0 million. The single largest shareholder group controls 33.99% voting rights via a concert party agreement involving CTO Liu Songtao (11.11%), General Manager Song Tao (9.20%), Yang Junwen (3.94%), Chenxing Haoyou ESOP (3.82%), Chenxing Xiongdi ESOP (3.25%), and Chenxing Huoban (2.66%).
ESOP units totaling 1,435,361 shares (7.08% equity) are managed via General Partner Song Tao, with a 12-month post-listing lockup and a 3-year vesting schedule (40%/30%/30%). Major Pre-IPO institutional holdings include Yang Haoyong (8.90%), Guozhong PE (8.06%), Ningbo Haida (7.55%), TEDA Haihe (6.37%), Saitian (6.02%), Yari Funds (5.18%), SCGC/Hongtu (5.21%), Lenovo Fund (4.99%), Wuxi Huicui (4.57%), Qingdao Haichuang (3.32%), TEDA Venture (2.90%), and Siasun/Xinsong (2.37%).
HDIN Institutional Verdict and Risk-Adjusted Forensic Audit
Forensic audit of historical balance sheets reveals a substantial accounting vulnerability associated with Pre-IPO special redemption rights. Prior to their formal and irrevocable termination *ab initio* on September 9, 2025, recognition of redemption rights as financial liabilities under IFRS would have altered historical equity metrics:
Table FORENSIC RE-AUDIT: IMPACT OF PRE-IPO REDEMPTION LIABILITIES
The definitive derecognition of these redemption features eliminated net deficit overhangs, lifting net assets to RMB 257.54 million by year-end 2025 and RMB 231.61 million as of June 30, 2026.
Operational working capital dynamics continue to require monitoring. Operating cash flows diverged from reporting profitability in 2025 (CFO of negative RMB 23.16 million versus reported net profit of RMB 0.74 million), driven by trade receivable expansion of RMB 52.40 million and contract liability revenue conversions of RMB 25.55 million.
DSO expanded from 35 days in 2024 to 87 days in 1H2026 as distributor networks extended to 25 partners with 30-to-90-day credit windows, alongside strategic accounts receiving up to 180 days. Nevertheless, risk mitigation is supported by cumulative ECL provisions of RMB 15.03 million (18.5% coverage of RMB 81.17 million gross AR) and zero customer concentration exceeding 9.9% in 1H2026.
Table LIQUIDITY STRESS TEST AND CASH RUNWAY ANALYSIS (AS OF JUNE 30, 2026)
Personal guarantees extended by founders Liu Songtao and Song Tao across bank borrowings (peaking at RMB 10.00 million) and leases (RMB 0.27 million) were released in January 2026, establishing financial operational autonomy. Backlog in the solutions division stood at 21 ongoing projects valued at RMB 52.66 million as of June 30, 2026, supported by historical project tender win rates between 40% and 50%.
Coupled with a 50% repeat purchase rate in delta robots and a 49% cross-selling rate into heavy-load cobots, Tianjin Chenxing Technology Co., Ltd. presents an operational foundation underpinned by self-funded capital reserves, full R&D expense absorption, and vertically integrated drive architectures.
Presentation Download & Video Access:
- Presentation Download: Click the PDF download link under 'Related Topics' to access the full institutional presentation of this report.
- Video Link: Click this link to watch the HDIN analyst briefing on YouTube.
About HDIN Research:
HDIN Research is a global market intelligence and strategic advisory firm specializing in institutional-grade financial analysis, supply chain audits, and macroeconomic forecasting. Our sector analysts deliver data-driven insights tailored for private equity, hedge funds, and corporate strategy teams. Visit us at http://www.hdinresearch.com.
2026 AI Transparency Footer:
"This intelligence report was authored by HDIN Research analysts following an audit of official corporate filings. AI was utilized for scale data synthesis and structural drafting, ensuring inclusion of reported data points. All strategic insights, financial modeling, and final verdicts were verified by our editorial board to ensure professional accuracy and compliance with 2026 Google Search E-E-A-T standards."
1. Tianjin Chenxing Technology Co., Ltd. expanded revenue at a 64.39% CAGR from RMB 93.49 million in 2023 to RMB 252.65 million in 2025, posting an adjusted net profit of RMB 10.23 million in 2025 alongside a 0% R&D capitalization policy.
2. In-house servo motor and drive integration expanded consolidated gross margin from 16.98% in 2023 to 30.45% in 2025, offsetting a 35.7% delta robot average selling price reduction from RMB 83,514 to RMB 53,661 by the first half of 2026.
3. Liquidity reserves of RMB 194.70 million and RMB 33.00 million in unutilized banking lines provide 27.8x coverage over RMB 8.18 million in short-term debt, providing 36.1 to 54.1 months of cash runway across peak burn rates.
Figure TIANJIN CHENXING TECHNOLOGY IPO Institutional Blueprint
Segmental Realities, Unit Economics, and Balance Sheet DynamicsTianjin Chenxing Technology Co., Ltd. (operating commercially as AtomRobot) reported top-line expansion across its audited track record period, driven by high-speed industrial robotics and bespoke automation solutions across food, beverage, new energy, and pharmaceutical end-markets.
Table CONSOLIDATED FINANCIAL PERFORMANCE (2023 – 1H2026) |
| Financial Metric (RMB '000, except percentages and operating metrics) | FY2023 | FY2024 | FY2025 | FY2023–FY2025 CAGR (%) | 1H2025 | 1H2026 |
|---|---|---|---|---|---|---|
| Revenue | 93,491 | 135,260 | 252,653 | +64.39% | 94,607 | 135,086 |
| Cost of Sales | (77,612) | (104,399) | (175,720) | +50.56% | (71,054) | (98,430) |
| Gross Profit | 15,879 | 30,861 | 76,933 | +119.98% | 23,553 | 36,656 |
| Gross Margin (%) | 16.98% | 22.82% | 30.45% | +1,347 bps | 24.90% | 27.14% |
| Other Income & Gains | 8,314 | 8,964 | 12,542 | +22.84% | 5,094 | 1,798 |
| Selling & Marketing Expenses | (24,749) | (34,465) | (34,368) | +17.83% | (10,895) | (12,518) |
| Administrative Expenses | (16,631) | (20,752) | (25,499) | +23.82% | (7,709) | (25,816) |
| Research & Development (R&D) | (19,364) | (29,799) | (21,387) | +5.09% | (9,746) | (24,015) |
| Impairment & Other Expenses | (2,322) | (869) | (6,653) | +69.10% | (4,610) | (4,592) |
| Finance Costs | (380) | (1,008) | (829) | +47.70% | (437) | (315) |
| Operating Profit / EBIT | (38,873) | (46,060) | 1,568 | N/A | (4,313) | (28,487) |
| Depreciation & Amortization | 7,191 | 9,785 | 11,350 | +25.64% | 5,956 | 6,127 |
| EBITDA | (31,682) | (36,275) | 12,918 | N/A | 1,643 | (22,360) |
| IFRS Net Profit / (Loss) | (39,253) | (47,068) | 739 | N/A | (4,750) | (28,802) |
| Non-IFRS Adjusted Net Profit | (39,253) | (36,446) | 10,233 | N/A | (2,763) | (10,530) |
| Operating Cash Flow (CFO) | (14,862) | (6,592) | (23,156) | N/A | (20,241) | (28,564) |
| Capital Expenditures (CapEx) | 7,497 | 25,698 | 9,561 | +12.95% | 2,880 | 713 |
| Free Cash Flow (FCF) | (22,359) | (32,290) | (32,717) | N/A | (23,121) | (29,277) |
Table SEGMENTAL REVENUE, MARGINS, AND VOLUME BREAKDOWN |
| Segment | FY2023 Revenue | FY2024 Revenue | FY2025 Revenue | 1H2026 Revenue | FY2025 Gross Margin (%) | 1H2026 Gross Margin (%) |
|---|---|---|---|---|---|---|
| Delta Robots | RMB 60.05M | RMB 70.48M | RMB 119.00M | RMB 58.06M | 34.7% | 27.1% |
| └ Volume (Units Sold) | 719 units | 934 units | 1,662 units | 1,082 units | — | — |
| └ Average Selling Price (ASP) | RMB 83,514 | RMB 75,457 | RMB 71,615 | RMB 53,661 | — | — |
| Robot Solutions | RMB 27.83M | RMB 44.42M | RMB 86.72M | RMB 46.94M | 34.6% | 30.4% |
| Heavy-load Cobots | RMB 1.38M | RMB 13.07M | RMB 28.14M | RMB 13.64M | 9.1% | 16.5% |
| └ Volume (Units Sold) | 9 units | 158 units | 571 units | 246 units | — | — |
| └ Average Selling Price (ASP) | RMB 153,609 | RMB 82,702 | RMB 49,281 | RMB 55,439 | — | — |
| Components | RMB 3.54M | RMB 5.03M | RMB 9.74M | RMB 8.42M | 21.1% | 26.7% |
| High-speed SCARA | RMB 0.00M | RMB 0.81M | RMB 6.07M | RMB 2.11M | -18.3% | -23.1% |
| └ Volume (Units Sold) | — | 33 units | 247 units | 95 units | — | — |
| └ Average Selling Price (ASP) | — | RMB 24,398 | RMB 24,553 | RMB 22,200 | — | — |
| Embodied AI Robots | RMB 0.00M | RMB 0.00M | RMB 0.35M | RMB 4.69M | 67.8% | 33.3% |
| └ Volume (Units Sold) | — | — | 1 unit | 4 units | — | — |
| └ Average Selling Price (ASP) | — | — | RMB 350,974 | RMB 1,172,250 | — | — |
| Independent Services | RMB 0.69M | RMB 1.46M | RMB 2.62M | RMB 1.23M | 72.7% | 88.3% |
Table WORKING CAPITAL, CASH CONVERSION CYCLE (CCC), AND BALANCE SHEET EFFICIENCY
| Financial Metric | FY2023 | FY2024 | FY2025 | 1H2026 |
|---|---|---|---|---|
| Days Sales Outstanding (DSO) | 71 days | 35 days | 51 days | 87 days |
| Days Inventory Outstanding (DIO) | 249 days | 226 days | 118 days | 88 days |
| Days Payable Outstanding (DPO) | 247 days | 233 days | 162 days | 142 days |
| Cash Conversion Cycle (CCC) | 73 days | 28 days | 7 days | 33 days |
| Trade Receivables & Notes (Net) | RMB 12.31M | RMB 13.38M | RMB 58.74M | RMB 71.71M |
| Allowance for Expected Credit Losses (Trade AR) | RMB 2.32M | RMB 0.87M | RMB 6.65M | RMB 15.03M |
| ECL Provision Coverage Ratio (%) | 3.7% | 5.0% | 9.0% | 18.5% |
| Inventories (Gross / Net) | RMB 59.31M | RMB 72.81M | RMB 43.60M | RMB 55.45M / RMB 54.07M |
| Inventory Provision | RMB 0.93M | RMB 2.01M | RMB 1.04M | RMB 1.38M |
| Current Ratio / Quick Ratio | 1.92x / 1.43x | 1.70x / 1.25x | 2.51x / 2.21x | 2.28x / 1.92x |
| Debt-to-Asset Ratio | 49.97% | 52.66% | 36.35% | 39.97% |
Non-IFRS adjustments isolate core operational trends. In 2024, RMB 10.62 million in share-based compensation was added back to a reported net loss of RMB 47.07 million, yielding an adjusted net loss of RMB 36.45 million. In 2025, adjustments included RMB 4.44 million in share-based compensation and RMB 5.05 million in deemed listing expenses, converting a reported net profit of RMB 0.74 million to an adjusted net profit of RMB 10.23 million.
In the first half of 2026, reported net loss expanded 506.3% year-over-year to RMB 28.80 million, primarily driven by RMB 15.40 million in listing expenses and RMB 2.87 million in share-based payments. Adjusted net loss for 1H2026 stood at RMB 10.53 million compared to an adjusted net loss of RMB 2.76 million in 1H2025.
Direct material inputs represented 83.0% of cost of sales in 2023 (RMB 64.44 million), 80.7% in 2024, 81.9% in 2025 (RMB 143.91 million), and 81.4% in 1H2026. Government subsidies received totaled RMB 5.3 million in 2023, RMB 5.0 million in 2024, RMB 8.9 million in 2025, and RMB 0.4 million in 1H2026.
Industrial Footprint, Supply Chain Architecture, and Intellectual Property Moats
Tianjin Chenxing Technology Co., Ltd. operates five leased production facilities across China while advancing construction of an integrated, owned corporate headquarters in Tianjin.
Table MANUFACTURING INFRASTRUCTURE AND EXPANSION TARGETS
| Facility Base | Location | Area (sqm) | Primary Function | Operational Status |
|---|---|---|---|---|
| Tianjin Base | Tianjin TEDA | 5,808 | Delta Robot Assembly | Leased (Operational) |
| Wuxi Base | Wuxi, Jiangsu | 9,676 | Heavy-load Cobot Assembly | Leased (Unregistered Lease) |
| Kunshan Base | Suzhou, Jiangsu | 3,653 | SCARA Robot Manufacturing | Leased (Operational) |
| Wujiang Base | Suzhou, Jiangsu | 4,089 | Robotics Solutions Assembly | Leased (Operational) |
| Xinxiang Facility | Xinxiang, Henan | 1,355 | Component Machining | Leased (Unregistered Lease) |
| Future Tianjin Headquarters | Tianjin TEDA | 23,500 (Land Area) | Integrated Headquarters and Manufacturing Plant | Under Planning (2026–2030) |
Annual production capacity targets post-upgrade specify 5,000 units across standard robotics lines in Tianjin, Wuxi, and Kunshan, alongside an annual output value of RMB 300.00 million at the Wujiang solution base, with consolidated capacity utilization targeted above 80%.
Table HISTORICAL PRODUCTION UTILIZATION RATES (2023 – 1H2026)
| Product Line | FY2023 | FY2024 | FY2025 | 1H2025 | 1H2026 |
|---|---|---|---|---|---|
| Delta Robot (Capacity / Production Units) | 800 / 754 | 1,200 / 1,107 | 1,500 / 1,429 | 650 / 621 | 1,300 / 1,244 |
| └ Utilization Rate (%) | 94.3% | 92.3% | 95.3% | 95.5% | 95.7% |
| Heavy-load Cobot (Capacity / Production Units) | — | 200 / 184 | 600 / 577 | 150 / 113 | 300 / 269 |
| └ Utilization Rate (%) | — | 92.0% | 96.2% | 75.3% | 89.7% |
| SCARA Robot (Capacity / Production Units) | — | 200 / 161 | 250 / 180 | 100 / 78 | 150 / 118 |
| └ Utilization Rate (%) | — | 80.5% | 72.0% | 78.0% | 78.7% |
Geographic revenue execution shows international sales expansion from RMB 3.35 million in 2023 (3.6% mix) to RMB 26.50 million in 2025 (10.5% mix), registering a 181.19% CAGR. Overseas gross margin reached 53.5% in 2025 (compared to 27.8% domestically) and 49.4% in 1H2026 (versus 25.6% domestically). Regional breakdown includes East Asia (RMB 3.53 million in 2025), Southeast Asia (RMB 4.21 million), Middle East (RMB 11.12 million), Europe (RMB 2.71 million), North America (RMB 0.47 million), and other regions (RMB 4.47 million).
Table COUNTERPARTY CONCENTRATION AND REVENUE MIX (FY2023 – 1H2026)
| Period | Top 5 Customers Revenue Mix | Largest Single Customer Contribution | Top 5 Suppliers Purchase Mix |
|---|---|---|---|
| FY2023 | 20.5% (RMB 19.14M) | 5.8% (RMB 5.47M, Food Industry) | 24.4% (RMB 23.59M; Maximum Supplier Share: 6.7%) |
| FY2024 | 21.9% (RMB 29.61M) | 6.1% (RMB 8.23M, Machinery Industry) | 22.0% (RMB 30.08M; Maximum Supplier Share: 5.9%) |
| FY2025 | 14.4% (RMB 36.47M) | 4.0% (RMB 10.14M, Food Industry) | 23.3% (RMB 28.48M; Maximum Supplier Share: 5.4%) |
| 1H2026 | 25.5% (RMB 34.42M) | 9.9% (RMB 13.35M, Battery Industry) | 28.2% (RMB 29.19M; Maximum Supplier Share: 11.6%) |
Counterparty overlap analysis confirms four dual-role trading entities operating on arm's-length commercial terms:
- Client I (Packaging Integrator): Sales of RMB 0.9M (2023), RMB 4.4M (2024), RMB 5.7M (2025), RMB 3.1M (1H2026); material handling equipment purchases of RMB 0M, RMB 0.5M, RMB 0.6M, and RMB 0.9M.
- Client O (Packaging Machinery): Sales of RMB 2.5M, RMB 2.0M, RMB 1.7M, and RMB 0.4M; workstation procurement of RMB 1.2M, RMB 0.5M, RMB 0.2M, and RMB 0.1M.
- Supplier C (Inspection Tech): Purchases of RMB 0M, RMB 0.1M, RMB 5.6M, and RMB 4.5M; robot body sales of RMB 0M, RMB 0.1M, RMB 2.2M, and RMB 0.7M.
- Supplier D (Machining / Conveyors): Purchases of RMB 5.2M, RMB 3.5M, RMB 6.6M, and RMB 5.2M; robot body sales of RMB 0M, RMB 0M, RMB 0.3M, and RMB 0.5M.
The research division comprises 99 engineers (25.4% of 390 total personnel) with zero R&D capitalization across all periods. The patent estate encompasses 175 authorized patents globally (51 invention, 97 utility models, 23 design patents, alongside 4 overseas patents and 29 pending applications), 31 software copyrights, and 27 trademarks. Core patents include 4-DOF parallel kinematics (ZL2014105707432), multi-threaded real-time robot controllers (ZL2021115843132 / US12434385B2), and ZYNQ-based drive-control integration (ZL2023100922234). Peripheral harness assembly outsourcing costs remained modest at RMB 0.2M (2023), RMB 0.4M (2024), RMB 0.6M (2025), and RMB 0.7M (1H2026).
Table PRE-IPO FINANCING EVOLUTION AND CAPITAL BASE EXPANSION
| Financing Round | Date / Settlement Period | Capital Raised (RMB M) | Post-Split Cost per Share (RMB) | Implied Post-Money Valuation (RMB M) |
|---|---|---|---|---|
| Angel Round | Jun 2015 – Aug 2017 | 8.0 | 0.28 | 27.0 |
| Pre-A Round | Oct 2016 – Aug 2017 | 20.0 | 1.05 | 120.0 |
| Series A | Jan 2019 – Jan 2021 | 24.0 | 1.70 | 218.0 |
| Series B | Apr 2021 – Oct 2021 | 60.0 | 3.12 | 460.0 |
| Series B+ | Aug 2022 – Feb 2023 | 135.0 | 4.45 | 825.0 |
| Series C | Aug 2024 – Aug 2024 | 60.0 | 6.47 | 1,260.0 |
| Series D | Oct 2025 – Oct 2025 | 100.0 | 12.33 | 2,500.0 |
Total cumulative net cash funding reached RMB 307.0 million. The single largest shareholder group controls 33.99% voting rights via a concert party agreement involving CTO Liu Songtao (11.11%), General Manager Song Tao (9.20%), Yang Junwen (3.94%), Chenxing Haoyou ESOP (3.82%), Chenxing Xiongdi ESOP (3.25%), and Chenxing Huoban (2.66%).
ESOP units totaling 1,435,361 shares (7.08% equity) are managed via General Partner Song Tao, with a 12-month post-listing lockup and a 3-year vesting schedule (40%/30%/30%). Major Pre-IPO institutional holdings include Yang Haoyong (8.90%), Guozhong PE (8.06%), Ningbo Haida (7.55%), TEDA Haihe (6.37%), Saitian (6.02%), Yari Funds (5.18%), SCGC/Hongtu (5.21%), Lenovo Fund (4.99%), Wuxi Huicui (4.57%), Qingdao Haichuang (3.32%), TEDA Venture (2.90%), and Siasun/Xinsong (2.37%).
HDIN Institutional Verdict and Risk-Adjusted Forensic Audit
Forensic audit of historical balance sheets reveals a substantial accounting vulnerability associated with Pre-IPO special redemption rights. Prior to their formal and irrevocable termination *ab initio* on September 9, 2025, recognition of redemption rights as financial liabilities under IFRS would have altered historical equity metrics:
Table FORENSIC RE-AUDIT: IMPACT OF PRE-IPO REDEMPTION LIABILITIES
| Balance Sheet Metric (RMB '000) | FY2023 | FY2024 | FY2025 | 1H2026 |
|---|---|---|---|---|
| Reported Current Liabilities | 119,417 | 160,678 | 142,880 | 149,481 |
| Restated Current Liabilities | 422,034 | 549,990 | 142,880 | 149,481 |
| Reported Net Current Assets / (Liabilities) | 109,594 | 111,672 | 216,096 | 191,994 |
| Restated Net Current (Liabilities) | (193,023) | (277,640) | 216,096 | 191,994 |
| Reported Total Net Assets (Equity) | 128,024 | 151,578 | 257,535 | 231,606 |
| Restated Total Net (Deficit) | (174,593) | (237,734) | 257,535 | 231,606 |
| Financial Liability Accretion Costs | 24,252 | 26,695 | 18,270 | — |
| Restated Total Comprehensive Loss | (63,505) | (73,763) | (17,531) | (28,802) |
The definitive derecognition of these redemption features eliminated net deficit overhangs, lifting net assets to RMB 257.54 million by year-end 2025 and RMB 231.61 million as of June 30, 2026.
Operational working capital dynamics continue to require monitoring. Operating cash flows diverged from reporting profitability in 2025 (CFO of negative RMB 23.16 million versus reported net profit of RMB 0.74 million), driven by trade receivable expansion of RMB 52.40 million and contract liability revenue conversions of RMB 25.55 million.
DSO expanded from 35 days in 2024 to 87 days in 1H2026 as distributor networks extended to 25 partners with 30-to-90-day credit windows, alongside strategic accounts receiving up to 180 days. Nevertheless, risk mitigation is supported by cumulative ECL provisions of RMB 15.03 million (18.5% coverage of RMB 81.17 million gross AR) and zero customer concentration exceeding 9.9% in 1H2026.
Table LIQUIDITY STRESS TEST AND CASH RUNWAY ANALYSIS (AS OF JUNE 30, 2026)
| Liquidity Metric | Amount / Indicator |
|---|---|
| Cash and Cash Equivalents | RMB 99.94M |
| Restricted Cash | RMB 0.40M |
| Wealth Management Products / Structured Deposits | RMB 94.36M |
| Total High-Liquidity Reserves | RMB 194.70M |
| Committed Unutilized Bank Facilities | RMB 33.00M |
| Total Liquidity Backstop | RMB 227.70M |
| Short-term Interest-Bearing Debt & Bill Discounting | RMB 3.17M |
| Current Lease Liabilities | RMB 5.01M |
| Total Rigid Short-Term Debt Obligations | RMB 8.18M |
| Liquidity Coverage Ratio over Short-term Debt | 27.8x |
| Baseline Runway @ FY2023–FY2025 Average Burn (RMB 3.6M/month) | 54.1 months (4.5 years) |
| Stressed Runway @ Peak 1H2026 Burn Rate (RMB 5.4M/month) | 36.1 months (3.0 years) |
Personal guarantees extended by founders Liu Songtao and Song Tao across bank borrowings (peaking at RMB 10.00 million) and leases (RMB 0.27 million) were released in January 2026, establishing financial operational autonomy. Backlog in the solutions division stood at 21 ongoing projects valued at RMB 52.66 million as of June 30, 2026, supported by historical project tender win rates between 40% and 50%.
Coupled with a 50% repeat purchase rate in delta robots and a 49% cross-selling rate into heavy-load cobots, Tianjin Chenxing Technology Co., Ltd. presents an operational foundation underpinned by self-funded capital reserves, full R&D expense absorption, and vertically integrated drive architectures.
Presentation Download & Video Access:
- Presentation Download: Click the PDF download link under 'Related Topics' to access the full institutional presentation of this report.
- Video Link: Click this link to watch the HDIN analyst briefing on YouTube.
About HDIN Research:
HDIN Research is a global market intelligence and strategic advisory firm specializing in institutional-grade financial analysis, supply chain audits, and macroeconomic forecasting. Our sector analysts deliver data-driven insights tailored for private equity, hedge funds, and corporate strategy teams. Visit us at http://www.hdinresearch.com.
2026 AI Transparency Footer:
"This intelligence report was authored by HDIN Research analysts following an audit of official corporate filings. AI was utilized for scale data synthesis and structural drafting, ensuring inclusion of reported data points. All strategic insights, financial modeling, and final verdicts were verified by our editorial board to ensure professional accuracy and compliance with 2026 Google Search E-E-A-T standards."