BHP Group Limited: Capital Reallocation and Base Metal Pivot Near Minerals Americas as Copper EBITDA Margin Surges to 70%
Date : 2026-08-25
Reading : 230
HDIN Executive Takeaways
1. BHP Group Limited [ASX: BHP; LSE: BHPA; NYSE: BHP] generated US$32,947 million in Underlying EBITDA in FY2026 (+26.8% YoY), driven by a 35.1% increase in realized copper prices to US$5.74/lb, allowing Copper segment EBITDA (US$18,187 million) to surpass Iron Ore (US$14,529 million) for the first time.
2. The Group completed US$6,300 million in structural capital recycling—including a US$4,300 million Antamina silver streaming agreement with Wheaton Precious Metals and a US$2,000 million WAIO power infrastructure deal with Global Infrastructure Partners—counterbalancing a US$2,300 million non-cash impairment from Jansen Potash project cost escalations in Saskatchewan, Canada.
3. Balance sheet Net Debt contracted 32.7% to US$8,694 million, driving gearing to an institutional low of 13.4% and establishing a US$24,032 million liquidity cushion to fund a US$12,300 million five-year copper expansion wave.
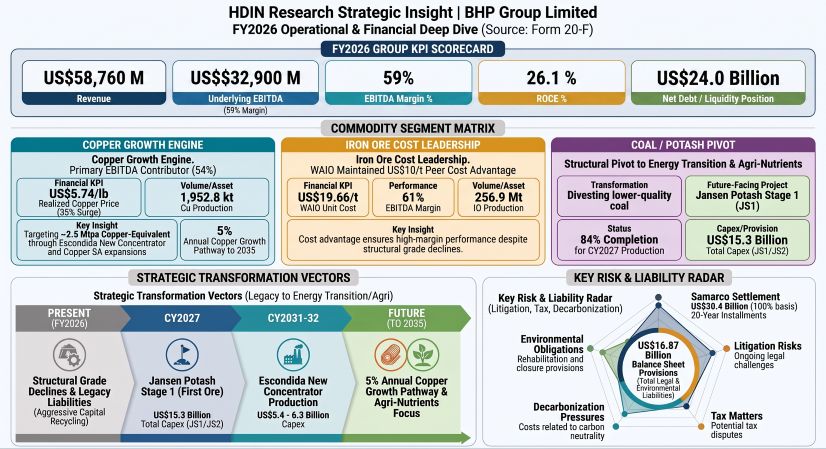
Figure BHP Group Limited FY2026 Operational & Financial Deep Dive
 Segmental Realities and Margin Compression
BHP Group Limited delivered US$58,760 million in consolidated revenue for FY2026 (+14.6% YoY), driven by commodity price tailwinds. Group Underlying EBITDA increased 26.8% YoY to US$32,947 million, expanding the Underlying EBITDA margin for Group production by 600 basis points to 59.0%. Statutory attributable net profit rose 9.0% to US$9,833 million, impacted by non-cash impairment charges, while core operational performance drove Underlying Attributable Profit up 30.0% to US$13,204 million.
The Group's EBITDA waterfall reveals that operational expansion was primarily price-led. Net pricing generated a positive variance of +US$7,311 million (+US$7,710 million in gross price adjustments offset by -US$399 million in price-linked royalties and costs). Volume variations created a -US$1,167 million drag, reflecting planned grade declines at Escondida and ore variability at Spence. Controllable cash costs improved by +US$1,191 million, aided by inventory build-ups and the operational suspension of Western Australia Nickel, which helped offset inflation (-US$675 million) and foreign exchange headwinds (-US$798 million).
Title Financial Performance and Capital Allocation Overview (FY2025–FY2026)
Title Business Segment Financial Performance and Operating Metrics (FY2025–FY2026)
BHP's revenue distribution highlights shifts across key consumer geographies. China accounted for US$34,206 million, or 58.21% of total Group revenue in FY2026, contracting by 4.38 percentage points from 62.59% in FY2025. Conversely, Indian sales increased 37.5% YoY to US$3,660 million (6.23% share), driven by seaborne demand. Japanese revenue rose 39.1% to US$5,810 million (9.89% share), European revenue expanded 94.7% to US$2,183 million (3.72% share), South Korea generated US$3,218 million (5.48% share, +20.8% YoY), North America contributed US$2,707 million (4.61% share, +20.3% YoY), domestic Australia accounted for US$2,855 million (4.86% share, +12.2% YoY), South America contributed US$489 million (0.83% share, +14.0% YoY), and the Rest of Asia generated US$3,632 million (6.18% share, +9.0% YoY).
Table BHP Group Regional Revenue Contribution (FY2026)
Infrastructure Layout and Regional Moats
BHP's production network is anchored by concentrated Tier 1 resource basins with integrated logistics infrastructure.
* Minerals Americas — Escondida (Chile): Operated by Minera Escondida Limitada (BHP 57.5%, Rio Tinto 30.0%, JECO Corporation 10.0%, JECO 2 Ltd 2.5%), Escondida produced 1,261.2 kt of copper on a 100% basis. Operations combine two open-cut pits, three concentrators, and leaching facilities powered entirely by renewable energy contracts. To manage concentrator feed grade declines (dropping from 1.02% in FY2025 to 0.90% in FY2026, and an estimated ~0.70% in FY2027), BHP is advancing the Escondida New Concentrator to replace the Los Colorados unit. The project has an estimated capital intensity of US$5.4 billion to US$6.3 billion, targeting 230 to 270 ktpa capacity with first production between CY2031 and CY2032 following an Environmental Impact Declaration submitted in March 2026. Escondida deployed Full SaL chlorine-assisted leaching technology on sulphidic dump leach pads, achieving a 76% metallurgical recovery rate versus 42% for standard biological leaching. Attributable mineral reserves declined 4% to 3,290 Mt at 0.55% Cu, generating an S-K 1300 calculated Reserve Life of 27.4 years with an attributable Reserve Replacement Ratio (RRR) of 0.0% due to 120 Mt of operational depletion.
* Minerals Australia — Western Australia Iron Ore (WAIO): An integrated network comprising four processing hubs and five open-cut mines connected by over 1,000 kilometers of heavy-haul rail to dedicated berths at Port Hedland (Nelson Point and Finucane Island). Supported by the 190 MW Yarnima natural gas-fired power station, WAIO produced a record 256.9 Mt (attributable equity basis) at an average cash cost of US$19.66/t. Operations absorbed a 4.3 Mt volume drag during the rebuild of Car Dumper 3 (CD3), with Car Dumper 4 (CD4) scheduled for renewal in H1 FY2027. Attributable mineral reserves stand at 3,370 Mt at 61.2% Fe, representing 13.1 years of Reserve Life. Attributable reserve additions of 106.9 Mt yielded an RRR of 41.6%, supported by the approval of the Ministers North deposit (US$0.9 billion joint venture on a 100% basis with Global Infrastructure Partners) to deliver 20 Mtpa of direct shipping ore via Yandi infrastructure starting in FY2029.
* Minerals Australia — Copper South Australia: A wholly owned base metal complex comprising Olympic Dam, Prominent Hill, Carrapateena, and Oak Dam. The province delivered 320.7 kt of copper and an Underlying EBITDA of US$3,203 million. Gross cash operating costs of US$2,808 million were offset by US$2,316 million in polymetallic by-product credits (primarily gold and uranium), bringing the net cash unit cost to US$0.32/lb. Olympic Dam holds 597 Mt of mineral reserves at 1.81% Cu and 0.57 kg/t U₃O₈, with a calculated Reserve Life of 54.3 years at 11 Mtpa milling capacity. Phase 1 development targets ~500 ktpa copper production (~770 ktpa CuEq), supported by the Prominent Hill underground shaft expansion (PHOX) commissioning (first production in H2 FY2027), Carrapateena block cave decline completion (ramp-up to 12 Mtpa in FY2030), Olympic Dam Southern Mining Area decline development (2.5 Mtpa additional capacity by H2 FY2028), and downstream smelter engineering contracted to China Nerin Engineering.
* Canadian Potash — Jansen Project (Saskatchewan): A fully owned underground potash development. Jansen Stage 1 (JS1) was 84% complete at year-end, with first production scheduled for mid-CY2027 at a nameplate capacity of 4.15 Mtpa. Capital estimates were revised upward to US$8.4 billion from the prior US$7.0–US$7.4 billion range. Jansen Stage 2 (JS2) stood at 16% completion, with expected first production in late-FY2031 at 4.36 Mtpa, against a revised capital cost of US$6.9 billion (+US$2.0 billion above the original FY2024 baseline).
Table BHP Major Capital Execution Roadmap
* Centralized Commercial Architecture: Global physical trade flows and commodity risk exposures are managed via three wholly owned commercial subsidiaries: BHP Billiton Marketing AG (Switzerland) for commodity marketing, sales, and provisional price derivative risk management; BHP Billiton Marketing Asia Pte Ltd (Singapore) for regional marketing execution; and BHP Billiton Freight Singapore Pte Limited for maritime freight, Continuous Voyage Charters (CVCs), and Baltic C5 index fuel optimization.
Legal, Environmental, and Operational Liabilities
BHP carries US$16,866 million in total balance sheet provisions for legal exposures, environmental remediation, and decarbonization mandates.
Table BHP Provisions, Contingent Liabilities and Legal Exposure Assessment
Operational sensitivity analysis highlights structural cost exposures across key inputs:
Table Underlying EBITDA Annual Sensitivity Exposure
Labor relations represent an operational challenge following regulatory shifts. In Australia, the High Court refused special leave to appeal Fair Work Commission Regulated Labour Hire Arrangement Orders, mandating immediate pay parity for Operations Services contractors at BMA's Goonyella Riverside, Peak Downs, and Saraji mines, contributing to a 5.1% increase in unit costs to US$134.05/t. At Port Hedland, protected industrial action (strikes) organized by the AMWU, ETU, and AWU commenced following the close of FY2026. In Chile, the consolidation of the FESIN-BHP Union Federation and a pending lawsuit seeking a "single employer" declaration could enable multi-operation collective bargaining across Escondida and Spence.
HDIN Institutional Verdict
BHP's performance in FY2026 was underpinned by cyclical price realizations rather than underlying volume expansion. The Copper division's record 70.0% Underlying EBITDA margin generated sufficient liquidity to offset volume contractions at Spence (-21.3%) and a 0.0% Reserve Replacement Ratio at Escondida.
Management's capital discipline is demonstrated by its structural capital recycling program. Monetizing non-core silver streams at Antamina (US$4,300 million) and selling a 49% stake in WAIO power assets (US$2,000 million) provided US$6,300 million in liquidity, absorbing a US$3,400 million capital cost escalation across Jansen Stages 1 and 2 and maintaining a 13.4% gearing ratio.
However, long-term operational challenges remain:
* The Potash Dilution Drag: Capital cost escalations to US$8.4 billion for JS1 and US$6.9 billion for JS2 triggered a US$2,300 million statutory impairment, extending payback periods despite a projected >60% operating EBITDA margin.
* The Approaching Grade Wall: Concentrator feed grades at Escondida are projected to drop to ~0.70% Cu in FY2027. This transition requires multi-billion dollar concentrator investments to sustain annual copper output above 1.2 Mt.
* Structural Labor Realignment: Regulatory pay alignments in Australia and workforce centralization under FESIN-BHP in Chile are increasing baseline fixed costs across key extraction hubs.
BHP's liquidity position (US$24,032 million) provides balance sheet capacity to fund its mid-term copper capex program (averaging US$3.0 billion annually across FY2029–2031). However, future capital efficiency will depend on managing execution costs across Jansen and navigating labor negotiations at Port Hedland.
Presentation Download & Video Access:
Presentation Download: Click the PDF download link under 'Related Topics' to access the full institutional presentation of this report.
Video Link: Click this link to watch the HDIN analyst briefing on YouTube.
About HDIN Research:
HDIN Research is a premier global market intelligence and strategic advisory firm specializing in institutional-grade financial analysis, supply chain audits, and macroeconomic forecasting. Our dedicated sector analysts deliver actionable, data-driven insights tailored for private equity, hedge funds, and corporate strategy teams. Visit us at http://www.hdinresearch.com.
2026 AI Transparency Footer:
"This intelligence report was authored by HDIN Research analysts following a rigorous audit of official corporate filings. AI was utilized for massive-scale data synthesis and structural drafting, ensuring 100% inclusion of reported data points. All strategic insights, financial modeling, and final verdicts were verified by our editorial board to ensure professional accuracy and compliance with 2026 Google Search E-E-A-T standards."
1. BHP Group Limited [ASX: BHP; LSE: BHPA; NYSE: BHP] generated US$32,947 million in Underlying EBITDA in FY2026 (+26.8% YoY), driven by a 35.1% increase in realized copper prices to US$5.74/lb, allowing Copper segment EBITDA (US$18,187 million) to surpass Iron Ore (US$14,529 million) for the first time.
2. The Group completed US$6,300 million in structural capital recycling—including a US$4,300 million Antamina silver streaming agreement with Wheaton Precious Metals and a US$2,000 million WAIO power infrastructure deal with Global Infrastructure Partners—counterbalancing a US$2,300 million non-cash impairment from Jansen Potash project cost escalations in Saskatchewan, Canada.
3. Balance sheet Net Debt contracted 32.7% to US$8,694 million, driving gearing to an institutional low of 13.4% and establishing a US$24,032 million liquidity cushion to fund a US$12,300 million five-year copper expansion wave.
Figure BHP Group Limited FY2026 Operational & Financial Deep Dive
Segmental Realities and Margin CompressionBHP Group Limited delivered US$58,760 million in consolidated revenue for FY2026 (+14.6% YoY), driven by commodity price tailwinds. Group Underlying EBITDA increased 26.8% YoY to US$32,947 million, expanding the Underlying EBITDA margin for Group production by 600 basis points to 59.0%. Statutory attributable net profit rose 9.0% to US$9,833 million, impacted by non-cash impairment charges, while core operational performance drove Underlying Attributable Profit up 30.0% to US$13,204 million.
The Group's EBITDA waterfall reveals that operational expansion was primarily price-led. Net pricing generated a positive variance of +US$7,311 million (+US$7,710 million in gross price adjustments offset by -US$399 million in price-linked royalties and costs). Volume variations created a -US$1,167 million drag, reflecting planned grade declines at Escondida and ore variability at Spence. Controllable cash costs improved by +US$1,191 million, aided by inventory build-ups and the operational suspension of Western Australia Nickel, which helped offset inflation (-US$675 million) and foreign exchange headwinds (-US$798 million).
Title Financial Performance and Capital Allocation Overview (FY2025–FY2026)
| Financial & Capital Allocation Metric | FY2025 | FY2026 | YoY Change (%) / Delta |
| Consolidated Revenue | US$51,262 M | US$58,760 M | +14.6% |
| Underlying EBITDA | US$25,978 M | US$32,947 M | +26.8% |
| Underlying EBITDA Margin (Group production) | 53.0% | 59.0% | +6.0 pp |
| Statutory Attributable Net Profit | US$9,019 M | US$9,833 M | +9.0% |
| Underlying Attributable Profit | US$10,157 M | US$13,204 M | +30.0% |
| Net Operating Cash Flow | US$18,692 M | US$21,778 M | +16.5% |
| Free Cash Flow | US$5,342 M | US$9,767 M | +82.8% |
| Capital & Exploration Expenditure (Cash Basis) | US$9,794 M | US$10,257 M | +4.7% |
| — Purchases of Property, Plant & Equipment | US$9,398 M | US$9,849 M | +4.8% |
| — Exploration & Evaluation (Expensed & Gross) | US$396 M | US$408 M | +3.0% |
| Determined Dividends per Share | 110 US cents | 172 US cents | +56.4% |
| Total Determined Dividends | US$5,580 M | US$8,734 M | +56.5% |
| Dividend Payout Ratio (Underlying EPS Basis) | 54.9% | 66.2% | +11.3 pp |
| Cash Dividends Paid (BHP Shareholders) | US$6,403 M | US$6,756 M | +5.5% |
| Cash Dividends Paid to Non-Controlling Interests | US$1,873 M | US$2,355 M | +25.7% |
| Return on Capital Employed (ROCE) | 20.6% | 26.1% | +5.5 pp |
| Net Debt | US$12,924 M | US$8,694 M | -32.7% |
| Gearing Ratio (Net Debt / Net Debt + Equity) | 19.8% | 13.4% | -6.4 pp |
| Cash and Cash Equivalents | US$11,894 M | US$18,532 M | +55.8% |
| Undrawn Committed Credit Facilities | US$5,500 M | US$5,500 M | 0.0% |
| Total Available Liquidity | US$17,394 M | US$24,032 M | +38.2% |
Title Business Segment Financial Performance and Operating Metrics (FY2025–FY2026)
| Business Segment Financial & Operating Breakdown | FY2025 Revenue (US$ M) | FY2026 Revenue (US$ M) | FY2025 EBITDA (US$ M) | FY2026 EBITDA (US$ M) | FY2026 EBITDA Margin (%) | FY2026 Realized Price / Production Metrics |
| Copper Segment | US$22,530 M | US$29,031 M | US$12,326 M | US$18,187 M | 70.0% (+11.0 pp) | US$5.74/lb (+35.1%); 1,952.8 kt (-3.2% YoY) |
| — Escondida (100% basis) | — | — | — | US$12,440 M | — | 1,261.2 kt; Net Unit Cost: US$1.07/lb (-10.1%) |
| — Spence / Pampa Norte (100% basis) | — | — | — | — | — | 212.6 kt; Net Unit Cost: US$2.15/lb (+3.9%) |
| — Copper South Australia (100% basis) | US$4,655 M | US$6,011 M | US$1,936 M | US$3,203 M | — | 320.7 kt; Net Unit Cost: US$0.32/lb (-72.9%) |
| — Antamina (BHP 33.75% equity share) | — | — | — | US$1,762 M | — | 151.5 kt Cu (+27%); 96.1 kt Zn (-11%) |
| Iron Ore Segment | US$22,919 M | US$23,883 M | US$14,396 M | US$14,529 M | 61.0% (-2.0 pp) | US$84.56/wmt (+3.0%); 264.7 Mt (+0.7% YoY) |
| — WAIO (100% basis) | — | — | — | — | — | 256.9 Mt; Cash Cost: US$19.66/t (+5.9%) |
| — Samarco (BHP 50% share) | — | — | — | — | — | 7.8 Mt Pellets (+25.0% YoY) |
| Coal Segment | US$5,046 M | US$5,590 M | US$573 M | US$832 M | 15.0% (+4.0 pp) | 35.0 Mt total; Segment ROCE: 0.0% |
| — BMA Steelmaking Coal (50% basis) | — | — | — | — | — | US
134.05/t |
| — NSWEC Energy Coal (100% basis) | — | — | — | — | — | US$104.28/t (-3.3%); 16.4 Mt (Exceeded target) |
| Potash Segment (Development) | US$0 M | US$0 M | (US$284 M) | (US$326 M) | N/A | Capex: US$1,814 M; JS1 (84%); JS2 (16%) |
BHP's revenue distribution highlights shifts across key consumer geographies. China accounted for US$34,206 million, or 58.21% of total Group revenue in FY2026, contracting by 4.38 percentage points from 62.59% in FY2025. Conversely, Indian sales increased 37.5% YoY to US$3,660 million (6.23% share), driven by seaborne demand. Japanese revenue rose 39.1% to US$5,810 million (9.89% share), European revenue expanded 94.7% to US$2,183 million (3.72% share), South Korea generated US$3,218 million (5.48% share, +20.8% YoY), North America contributed US$2,707 million (4.61% share, +20.3% YoY), domestic Australia accounted for US$2,855 million (4.86% share, +12.2% YoY), South America contributed US$489 million (0.83% share, +14.0% YoY), and the Rest of Asia generated US$3,632 million (6.18% share, +9.0% YoY).
Table BHP Group Regional Revenue Contribution (FY2026)
| Geographic Market | FY2026 Revenue Contribution | FY2026 Revenue (US$M) |
|---|---|---|
| China | 58.21% | US$34,206M |
| Japan | 9.89% | US$5,810M |
| India | 6.23% | US$3,660M |
| Rest of Asia | 6.18% | US$3,632M |
| South Korea | 5.48% | US$3,218M |
| Australia | 4.86% | US$2,858M |
| North America | 4.61% | US$2,707M |
| Europe | 3.72% | US$2,183M |
| South America | 0.83% | Not Disclosed |
Infrastructure Layout and Regional Moats
BHP's production network is anchored by concentrated Tier 1 resource basins with integrated logistics infrastructure.
* Minerals Americas — Escondida (Chile): Operated by Minera Escondida Limitada (BHP 57.5%, Rio Tinto 30.0%, JECO Corporation 10.0%, JECO 2 Ltd 2.5%), Escondida produced 1,261.2 kt of copper on a 100% basis. Operations combine two open-cut pits, three concentrators, and leaching facilities powered entirely by renewable energy contracts. To manage concentrator feed grade declines (dropping from 1.02% in FY2025 to 0.90% in FY2026, and an estimated ~0.70% in FY2027), BHP is advancing the Escondida New Concentrator to replace the Los Colorados unit. The project has an estimated capital intensity of US$5.4 billion to US$6.3 billion, targeting 230 to 270 ktpa capacity with first production between CY2031 and CY2032 following an Environmental Impact Declaration submitted in March 2026. Escondida deployed Full SaL chlorine-assisted leaching technology on sulphidic dump leach pads, achieving a 76% metallurgical recovery rate versus 42% for standard biological leaching. Attributable mineral reserves declined 4% to 3,290 Mt at 0.55% Cu, generating an S-K 1300 calculated Reserve Life of 27.4 years with an attributable Reserve Replacement Ratio (RRR) of 0.0% due to 120 Mt of operational depletion.
* Minerals Australia — Western Australia Iron Ore (WAIO): An integrated network comprising four processing hubs and five open-cut mines connected by over 1,000 kilometers of heavy-haul rail to dedicated berths at Port Hedland (Nelson Point and Finucane Island). Supported by the 190 MW Yarnima natural gas-fired power station, WAIO produced a record 256.9 Mt (attributable equity basis) at an average cash cost of US$19.66/t. Operations absorbed a 4.3 Mt volume drag during the rebuild of Car Dumper 3 (CD3), with Car Dumper 4 (CD4) scheduled for renewal in H1 FY2027. Attributable mineral reserves stand at 3,370 Mt at 61.2% Fe, representing 13.1 years of Reserve Life. Attributable reserve additions of 106.9 Mt yielded an RRR of 41.6%, supported by the approval of the Ministers North deposit (US$0.9 billion joint venture on a 100% basis with Global Infrastructure Partners) to deliver 20 Mtpa of direct shipping ore via Yandi infrastructure starting in FY2029.
* Minerals Australia — Copper South Australia: A wholly owned base metal complex comprising Olympic Dam, Prominent Hill, Carrapateena, and Oak Dam. The province delivered 320.7 kt of copper and an Underlying EBITDA of US$3,203 million. Gross cash operating costs of US$2,808 million were offset by US$2,316 million in polymetallic by-product credits (primarily gold and uranium), bringing the net cash unit cost to US$0.32/lb. Olympic Dam holds 597 Mt of mineral reserves at 1.81% Cu and 0.57 kg/t U₃O₈, with a calculated Reserve Life of 54.3 years at 11 Mtpa milling capacity. Phase 1 development targets ~500 ktpa copper production (~770 ktpa CuEq), supported by the Prominent Hill underground shaft expansion (PHOX) commissioning (first production in H2 FY2027), Carrapateena block cave decline completion (ramp-up to 12 Mtpa in FY2030), Olympic Dam Southern Mining Area decline development (2.5 Mtpa additional capacity by H2 FY2028), and downstream smelter engineering contracted to China Nerin Engineering.
* Canadian Potash — Jansen Project (Saskatchewan): A fully owned underground potash development. Jansen Stage 1 (JS1) was 84% complete at year-end, with first production scheduled for mid-CY2027 at a nameplate capacity of 4.15 Mtpa. Capital estimates were revised upward to US$8.4 billion from the prior US$7.0–US$7.4 billion range. Jansen Stage 2 (JS2) stood at 16% completion, with expected first production in late-FY2031 at 4.36 Mtpa, against a revised capital cost of US$6.9 billion (+US$2.0 billion above the original FY2024 baseline).
Table BHP Major Capital Execution Roadmap
| Asset / Project Hub | Estimated Capital Expenditure | Target Completion Date | Planned Capacity / Operational Impact |
|---|---|---|---|
| Jansen Potash Stage 1 (JS1) | US$8.4 Billion | Mid-CY2027 | 4.15 Mtpa production capacity |
| Jansen Potash Stage 2 (JS2) | US$6.9 Billion | Late-FY2031 | 4.36 Mtpa additional production capacity |
| Escondida New Concentrator | US$5.4–6.3 Billion | CY2031–2032 | 230–270 ktpa incremental copper capacity |
| Ministers North Iron Ore Project | Approximately US$0.9 Billion | FY2029 | 20.0 Mtpa production capacity |
| Spence SAL 2 Hypogene Leach Project | Combined US$1.8 Billion* | CY2028 | Latent electrowinning (EW) capacity expansion |
| Spence Concentrator Upgrade | Included within SAL 2 investment | FY2028 | Flotation capacity extension and processing improvement |
* Centralized Commercial Architecture: Global physical trade flows and commodity risk exposures are managed via three wholly owned commercial subsidiaries: BHP Billiton Marketing AG (Switzerland) for commodity marketing, sales, and provisional price derivative risk management; BHP Billiton Marketing Asia Pte Ltd (Singapore) for regional marketing execution; and BHP Billiton Freight Singapore Pte Limited for maritime freight, Continuous Voyage Charters (CVCs), and Baltic C5 index fuel optimization.
Legal, Environmental, and Operational Liabilities
BHP carries US$16,866 million in total balance sheet provisions for legal exposures, environmental remediation, and decarbonization mandates.
Table BHP Provisions, Contingent Liabilities and Legal Exposure Assessment
| Provision / Contingent Liability Category | Total Balance Sheet Value | Current Liability | Non-Current Liability | Operational Context & Legal Scope |
| Samarco Dam Failure (Fundão) | US$5,197 M | US$1,653 M | US$3,544 M | Definitive Brazilian Settlement ratified May 2025: R
30,416.35 M at mandatory rate 5.5891 BRL/USD). |
| — Historical Spend (to Sept 2024) | — | — | — | R
6,799.13 M). |
| — Obligation to Pay (20 Years) | — | — | — | R
17,891.97 M); 50/50 secondary liability with Vale. |
| — Obligations to Perform (15 Years) | — | — | — | R
5,725.43 M); includes R
8B Indigenous. |
| — FY2026 Cash Funding Outflow | — | — | — | US$2,030 M actual parent cash outflow for Samarco funding. |
| Closure & Site Rehabilitation | US$11,598 M | US$645 M | US$10,953 M | 64% of undiscounted cash flows occur beyond 10 years. Operating sites: US
3,645M. |
| — Discount Rate Sensitivity | — | — | — | +0.5% discount rate reduces provision by US
532M). |
| — Temporal Cash Flow Sensitivity | — | — | — | 1-year acceleration in remediation schedule increases provision by US$326M. |
| Australian Safeguard Mechanism | US$23 M | US$23 M | US$0 M | Current Scope 1 liability. Compliance hedged by US
22M intangibles, US$49M prepayments). |
| PPA Contract Liabilities | US$92 M | — | — | US
49M in PPA financial derivatives. |
| Litigation Contingencies | Settled / Active | — | — | Australian Shareholder Class Action settled at A
70.95M at 0.645 AUD/USD). UK Group Action trial Stage 2 scheduled for 2027–2028. |
Operational sensitivity analysis highlights structural cost exposures across key inputs:
Table Underlying EBITDA Annual Sensitivity Exposure
| Operational Sensitivity Vector | Annual EBITDA Impact |
|---|---|
| 10% AUD/USD Appreciation Against USD (Baseline ~0.68) | -US$1,100M to -US$1,200M |
| 10% CLP/USD Appreciation Against USD (Baseline ~920) | -US$350M to -US$450M |
| 10% Increase in Gasoil Price (Singapore 10ppm Benchmark) | -US$59M |
| 10% Increase in Baseline Labor Costs (Group Payroll) | -US$450M to -US$500M |
| 10% Increase in PPA Electricity Pricing | -US$80M to -US$100M |
| 10% Decline in Realized Copper Price (~US¢57/lb Reduction) | -US$2,223M |
| 10% Decline in Realized Iron Ore Price (~US$8.45/wmt Reduction) | -US$1,944M |
| 10% Decline in Realized Coal Price (~US$21.0/t Reduction) | -US$252M |
Labor relations represent an operational challenge following regulatory shifts. In Australia, the High Court refused special leave to appeal Fair Work Commission Regulated Labour Hire Arrangement Orders, mandating immediate pay parity for Operations Services contractors at BMA's Goonyella Riverside, Peak Downs, and Saraji mines, contributing to a 5.1% increase in unit costs to US$134.05/t. At Port Hedland, protected industrial action (strikes) organized by the AMWU, ETU, and AWU commenced following the close of FY2026. In Chile, the consolidation of the FESIN-BHP Union Federation and a pending lawsuit seeking a "single employer" declaration could enable multi-operation collective bargaining across Escondida and Spence.
HDIN Institutional Verdict
BHP's performance in FY2026 was underpinned by cyclical price realizations rather than underlying volume expansion. The Copper division's record 70.0% Underlying EBITDA margin generated sufficient liquidity to offset volume contractions at Spence (-21.3%) and a 0.0% Reserve Replacement Ratio at Escondida.
Management's capital discipline is demonstrated by its structural capital recycling program. Monetizing non-core silver streams at Antamina (US$4,300 million) and selling a 49% stake in WAIO power assets (US$2,000 million) provided US$6,300 million in liquidity, absorbing a US$3,400 million capital cost escalation across Jansen Stages 1 and 2 and maintaining a 13.4% gearing ratio.
However, long-term operational challenges remain:
* The Potash Dilution Drag: Capital cost escalations to US$8.4 billion for JS1 and US$6.9 billion for JS2 triggered a US$2,300 million statutory impairment, extending payback periods despite a projected >60% operating EBITDA margin.
* The Approaching Grade Wall: Concentrator feed grades at Escondida are projected to drop to ~0.70% Cu in FY2027. This transition requires multi-billion dollar concentrator investments to sustain annual copper output above 1.2 Mt.
* Structural Labor Realignment: Regulatory pay alignments in Australia and workforce centralization under FESIN-BHP in Chile are increasing baseline fixed costs across key extraction hubs.
BHP's liquidity position (US$24,032 million) provides balance sheet capacity to fund its mid-term copper capex program (averaging US$3.0 billion annually across FY2029–2031). However, future capital efficiency will depend on managing execution costs across Jansen and navigating labor negotiations at Port Hedland.
Presentation Download & Video Access:
Presentation Download: Click the PDF download link under 'Related Topics' to access the full institutional presentation of this report.
Video Link: Click this link to watch the HDIN analyst briefing on YouTube.
About HDIN Research:
HDIN Research is a premier global market intelligence and strategic advisory firm specializing in institutional-grade financial analysis, supply chain audits, and macroeconomic forecasting. Our dedicated sector analysts deliver actionable, data-driven insights tailored for private equity, hedge funds, and corporate strategy teams. Visit us at http://www.hdinresearch.com.
2026 AI Transparency Footer:
"This intelligence report was authored by HDIN Research analysts following a rigorous audit of official corporate filings. AI was utilized for massive-scale data synthesis and structural drafting, ensuring 100% inclusion of reported data points. All strategic insights, financial modeling, and final verdicts were verified by our editorial board to ensure professional accuracy and compliance with 2026 Google Search E-E-A-T standards."