Fabrinet: Strategic Capacity Additions in Chonburi Counterbalance 75.8% Inventory Influx as Data Center Optical Demand Escalates
Date : 2026-08-28
Reading : 131
HDIN Executive Takeaways
1. Top-line revenue accelerated 35.73% year-over-year in FY2026 to $4.64 billion, catalyzed by a 40.83% expansion in the Data Center segment ($2.23 billion).
2. Physical footprint scaled via an ongoing $132.5 million construction of Building 9 (2.0 million sq. ft.) in Chonburi, alongside the acquisition of an 8-acre campus in Navanakorn, Thailand, and a post-period $76.9 million facility purchase in California.
3. Balance-sheet inventory expanded 75.77% to $1.02 billion, led by a 158.23% surge in raw materials ($374.8 million) that absorbed operational cash flow and reduced Free Cash Flow to $4.22 million.
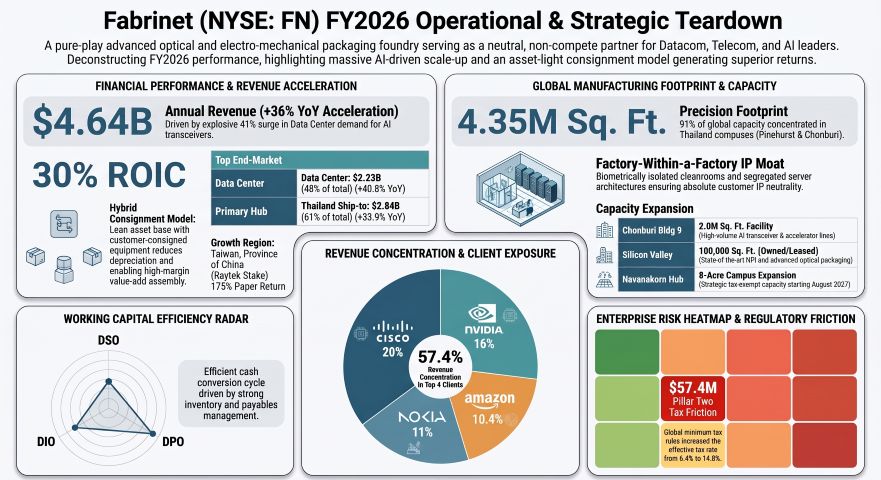
Figure Fabrinet FY2026 Operational & Strategic Teardown
 Financial Analysis and Multi-Market Segmental Performance
Fabrinet [NYSE: FN] reorganized its operational segments in Q4 FY2026, transitioning from its legacy binary disclosure structure into three distinct reporting categories: Data Center, Communications Infrastructure, and Automotive, Industrial and Other Markets.
For the fiscal year ended June 26, 2026, consolidated total revenue scaled to $4.64 billion, reflecting a 35.73% increase compared to $3.42 billion in FY2025. Gross margin contracted by 10 basis points to 11.99%, influenced by raw material cost pass-through mix and foreign exchange shifts. Operating income expanded 42.7% to $462.9 million, yielding an operating margin of 9.97% (+48 bps year-over-year), assisted by general and administrative expense leverage.
Net income stood at $473.0 million, surpassing operating income due to a non-operating unrealized gain of $56.7 million under ASC 321 from the revaluation of a 13.8% equity interest in Raytek Semiconductor, Inc. (listed on the Taipei Exchange Emerging Stock Board in May 2026). This offset a $57.4 million tax charge driven by OECD Pillar Two Undertaxed Profits Rule (UTPR) legislation, which increased the effective tax rate from 6.40% in FY2025 to 14.79% in FY2026.
Working capital metrics showed shifts across the cycle:
* Days Sales Outstanding (DSO) closed at 80.06 days (ending basis) compared to 81.01 days in FY2025.
* Days Inventory Outstanding (DIO) expanded by 20.71 days to 91.26 days (ending basis), matching a 75.77% balance-sheet inventory advance to $1.02 billion.
* Raw materials inventory increased 158.23% to $374.77 million; Work-in-Process (WIP) expanded 50.45% to $568.30 million; Finished Goods contracted 6.21% to $30.97 million.
* Days Payables Outstanding (DPO) rose by 12.48 days to 89.88 days (ending basis), bringing trade payables to $1.01 billion.
* The Cash Conversion Cycle (CCC) on an ending basis lengthened to 81.44 days versus 74.16 days in FY2025.
* Operating Cash Flow (OCF) conversion dropped to 54.27% of net income, generating $256.7 million due to a $442.9 million operating cash drain from inventory accumulation.
* Capital expenditures totaled $252.5 million (5.44% CapEx-to-revenue intensity), leaving Free Cash Flow at $4.22 million (0.09% of revenue).
Customer concentration increased in FY2026, with four customers accounting for 57.4% of total revenues: Cisco Systems, Inc. [NASDAQ: CSCO] at 19.9% ($923.6 million), NVIDIA Corporation [NASDAQ: NVDA] at 16.3% ($756.5 million), Nokia Corporation [NYSE: NOK] at 10.7% ($496.6 million), and Amazon.com, Inc. [NASDAQ: AMZN] at 10.5% ($487.3 million). Accounts receivable exposure to Cisco Systems, Nokia, and Amazon totaled 41.8% ($425.5 million) of aggregate net trade receivables ($1.02 billion).
Supply Chain Architecture and Regional Infrastructure Footprint
Fabrinet operates 4,351,280 square feet of manufacturing, advanced packaging, and New Product Introduction (NPI) space across five operating regions.
Table Global Manufacturing Footprint and Strategic Facility Network Overview
Geographic ship-to revenue disclosures, recast in FY2026, allocate destination demand across global supply networks:
Table Geographic Revenue Distribution and Market Exposure Analysis (FY2024–FY2026)
*UN Nomenclature Standard Compliance: Fabrinet holds a 13.8% equity interest ($32.4 million cash acquisition) in Raytek Semiconductor, Inc., which trades on the Emerging Stock Board in Taiwan, Province of China.
Treasury hedging instruments include 272 USD/THB forward exchange contracts with an aggregate notional value of $280.0 million to offset local currency payroll and factory operating liabilities ($178.2 million net balance-sheet THB liability). Chinese Renminbi (RMB) exposures ($7.8 million net liability) remain fully unhedged.
HDIN Institutional Verdict
Fabrinet's financial disclosures confirm an intensifying operational pivot toward hyperscale optical transceivers and active optical cables. The reduction of non-optical end markets to 18.74% of revenue—coupled with top-four customer concentration rising to 57.4%—reinforces the company's profile as a dedicated optical hardware foundry.
Operational safety valves embedded in Master Supply Agreements insulate gross margins against the $1.02 billion inventory surge:
1. Tooling Consignment Architecture: Customers consign proprietary production tooling directly to Fabrinet lines, eliminating capital depreciation on specialized assets.
2. Mandatory Buyback Protection: Contractual terms mandate that customer-directed raw materials ($374.8 million) unconsumed past specified rolling periods, or stranded due to design transitions, are repurchased by OEMs at cost as a direct offset against Cost of Revenues.
3. Flexible Procurement Adjustments: While holding $3.15 billion in short-term supplier purchase obligations, Fabrinet retains structural rights to adjust or reschedule PO allocations based on revised rolling customer projections prior to delivery.
The allocation of $252.5 million into physical infrastructure and machinery, coupled with share repurchase reductions from $125.7 million in FY2025 to $5.2 million in FY2026, reflects capital prioritization toward Building 9 and advanced Photonic Integrated Circuit (PIC) cleanroom capacity. While near-term Free Cash Flow conversion remains constrained at 0.09% of top-line, the frontloading of raw materials alongside an Average ROIC of 20.85% (excluding cash) indicates that working capital expansion is directly aligned with next-cycle high-speed transceiver build schedules.
Presentation Download & Video Access:
- Presentation Download: Click the PDF download link under 'Related Topics' to access the full institutional presentation of this report.
- Video Link: Click this link to watch the HDIN analyst briefing on YouTube.
About HDIN Research:
HDIN Research is a premier global market intelligence and strategic advisory firm specializing in institutional-grade financial analysis, supply chain audits, and macroeconomic forecasting. Our dedicated sector analysts deliver actionable, data-driven insights tailored for private equity, hedge funds, and corporate strategy teams. Visit us at http://www.hdinresearch.com.
2026 AI Transparency Footer:
This intelligence report was authored by HDIN Research analysts following a rigorous audit of official corporate filings. AI was utilized for massive-scale data synthesis and structural drafting, ensuring 100% inclusion of reported data points. All strategic insights, financial modeling, and final verdicts were verified by our editorial board to ensure professional accuracy and compliance with 2026 Google Search E-E-A-T standards.
1. Top-line revenue accelerated 35.73% year-over-year in FY2026 to $4.64 billion, catalyzed by a 40.83% expansion in the Data Center segment ($2.23 billion).
2. Physical footprint scaled via an ongoing $132.5 million construction of Building 9 (2.0 million sq. ft.) in Chonburi, alongside the acquisition of an 8-acre campus in Navanakorn, Thailand, and a post-period $76.9 million facility purchase in California.
3. Balance-sheet inventory expanded 75.77% to $1.02 billion, led by a 158.23% surge in raw materials ($374.8 million) that absorbed operational cash flow and reduced Free Cash Flow to $4.22 million.
Figure Fabrinet FY2026 Operational & Strategic Teardown
Financial Analysis and Multi-Market Segmental PerformanceFabrinet [NYSE: FN] reorganized its operational segments in Q4 FY2026, transitioning from its legacy binary disclosure structure into three distinct reporting categories: Data Center, Communications Infrastructure, and Automotive, Industrial and Other Markets.
For the fiscal year ended June 26, 2026, consolidated total revenue scaled to $4.64 billion, reflecting a 35.73% increase compared to $3.42 billion in FY2025. Gross margin contracted by 10 basis points to 11.99%, influenced by raw material cost pass-through mix and foreign exchange shifts. Operating income expanded 42.7% to $462.9 million, yielding an operating margin of 9.97% (+48 bps year-over-year), assisted by general and administrative expense leverage.
Table Revenue by End Market and Segment Growth Analysis (FY2024–FY2026)
| End-Market / Segment | FY2024 Revenue ($ in 000s) | FY2024 % of Total | FY2025 Revenue ($ in 000s) | FY2025 % of Total | FY2026 Revenue ($ in 000s) | FY2026 % of Total | YoY Change (FY25→FY26) |
| Data Center | $1,529,693 | 53.06% | $1,579,915 | 46.21% | $2,225,081 | 47.94% | +40.83% |
| Communications Infrastructure | $767,368 | 26.62% | $1,049,397 | 30.69% | $1,546,403 | 33.32% | +47.36% |
| Automotive, Industrial and Others | $585,906 | 20.32% | $790,015 | 23.10% | $869,613 | 18.74% | +10.08% |
| Total Revenue | $2,882,967 | 100.00% | $3,419,327 | 100.00% | $4,641,097 | 100.00% | +35.73% |
Net income stood at $473.0 million, surpassing operating income due to a non-operating unrealized gain of $56.7 million under ASC 321 from the revaluation of a 13.8% equity interest in Raytek Semiconductor, Inc. (listed on the Taipei Exchange Emerging Stock Board in May 2026). This offset a $57.4 million tax charge driven by OECD Pillar Two Undertaxed Profits Rule (UTPR) legislation, which increased the effective tax rate from 6.40% in FY2025 to 14.79% in FY2026.
Working capital metrics showed shifts across the cycle:
* Days Sales Outstanding (DSO) closed at 80.06 days (ending basis) compared to 81.01 days in FY2025.
* Days Inventory Outstanding (DIO) expanded by 20.71 days to 91.26 days (ending basis), matching a 75.77% balance-sheet inventory advance to $1.02 billion.
* Raw materials inventory increased 158.23% to $374.77 million; Work-in-Process (WIP) expanded 50.45% to $568.30 million; Finished Goods contracted 6.21% to $30.97 million.
* Days Payables Outstanding (DPO) rose by 12.48 days to 89.88 days (ending basis), bringing trade payables to $1.01 billion.
* The Cash Conversion Cycle (CCC) on an ending basis lengthened to 81.44 days versus 74.16 days in FY2025.
* Operating Cash Flow (OCF) conversion dropped to 54.27% of net income, generating $256.7 million due to a $442.9 million operating cash drain from inventory accumulation.
* Capital expenditures totaled $252.5 million (5.44% CapEx-to-revenue intensity), leaving Free Cash Flow at $4.22 million (0.09% of revenue).
Customer concentration increased in FY2026, with four customers accounting for 57.4% of total revenues: Cisco Systems, Inc. [NASDAQ: CSCO] at 19.9% ($923.6 million), NVIDIA Corporation [NASDAQ: NVDA] at 16.3% ($756.5 million), Nokia Corporation [NYSE: NOK] at 10.7% ($496.6 million), and Amazon.com, Inc. [NASDAQ: AMZN] at 10.5% ($487.3 million). Accounts receivable exposure to Cisco Systems, Nokia, and Amazon totaled 41.8% ($425.5 million) of aggregate net trade receivables ($1.02 billion).
Supply Chain Architecture and Regional Infrastructure Footprint
Fabrinet operates 4,351,280 square feet of manufacturing, advanced packaging, and New Product Introduction (NPI) space across five operating regions.
Table Global Manufacturing Footprint and Strategic Facility Network Overview
| Geographic Node / Facility | Approximate Square Footage | Ownership Status | Primary Operational Focus | Expansion Status & Regulatory Tax Regimes |
| Thailand (Pinehurst, Chonburi, Pathum Thani, Navanakorn) | 3,875,000 | Owned | High-volume precision optical, electro-mechanical, and advanced sub-micron assembly lines. | • Building 9 at Chonburi under construction ($132.5M total cost; $39.7M remaining commitment); 100% tax exemption through 2031.<br>• Acquired 8-acre Navanakorn site in May 2026; 8-year tax holiday starting August 2027.<br>• Pathum Thani site acquired and undergoing active renovations. |
| Fuzhou, China | 348,000 | Leased | Upstream vertical integration: crystal growth (Nd:YVO4, BBO), glass drawing, optical coatings, and polishing. | Supplies internal optical sub-assemblies directly to high-volume assembly infrastructure in Thailand. |
| United States (Santa Clara, CA & New Jersey) | 100,000 | Owned / Leased | Fabrinet West: NPI prototyping, automated SMT, process calibration, and specialized optics fabrication. | Acquired a manufacturing facility in California on July 27, 2026, for $76.9 million to support domestic program scale. |
| Startup Village, Israel | 27,000 | Leased | Design for Manufacturability (DFM) and early-stage electro-optical engineering transfer. | Operates as an engineering bridge to qualify advanced client programs prior to Thailand volume production. |
| George Town, Cayman Islands | 1,280 | Leased | Domicile holding company headquarters. | Income and capital gains tax-exempt status guaranteed through March 6, 2039. |
Geographic ship-to revenue disclosures, recast in FY2026, allocate destination demand across global supply networks:
Table Geographic Revenue Distribution and Market Exposure Analysis (FY2024–FY2026)
| Ship-To Destination | FY2024 Revenue ($ in 000s) | FY2025 Revenue ($ in 000s) | FY2026 Revenue ($ in 000s) | FY2026 Revenue % | YoY Growth (FY25→FY26) |
| Thailand | $1,817,517 | $2,123,346 | $2,842,089 | 61.24% | +33.85% |
| United States | $481,664 | $679,546 | $965,419 | 20.80% | +42.07% |
| Singapore | $200,494 | $220,282 | $254,710 | 5.49% | +15.63% |
| Malaysia | $33,853 | $39,275 | $113,926 | 2.45% | +190.07% |
| China, PRC | $62,088 | $58,881 | $88,373 | 1.90% | +50.09% |
| Mexico | $34,958 | $45,514 | $70,565 | 1.52% | +55.04% |
| Israel | $15,626 | $34,802 | $54,832 | 1.18% | +57.55% |
| Germany | $42,542 | $45,015 | $49,289 | 1.06% | +9.50% |
| Japan | $21,586 | $34,419 | $38,040 | 0.82% | +10.52% |
| United Kingdom | $15,554 | $25,327 | $36,542 | 0.79% | +44.28% |
| Other Destinations | $157,085 | $112,920 | $127,312 | 2.74% | +12.75% |
| Consolidated Total | $2,882,967 | $3,419,327 | $4,641,097 | 100.00% | +35.73% |
Treasury hedging instruments include 272 USD/THB forward exchange contracts with an aggregate notional value of $280.0 million to offset local currency payroll and factory operating liabilities ($178.2 million net balance-sheet THB liability). Chinese Renminbi (RMB) exposures ($7.8 million net liability) remain fully unhedged.
HDIN Institutional Verdict
Fabrinet's financial disclosures confirm an intensifying operational pivot toward hyperscale optical transceivers and active optical cables. The reduction of non-optical end markets to 18.74% of revenue—coupled with top-four customer concentration rising to 57.4%—reinforces the company's profile as a dedicated optical hardware foundry.
Operational safety valves embedded in Master Supply Agreements insulate gross margins against the $1.02 billion inventory surge:
1. Tooling Consignment Architecture: Customers consign proprietary production tooling directly to Fabrinet lines, eliminating capital depreciation on specialized assets.
2. Mandatory Buyback Protection: Contractual terms mandate that customer-directed raw materials ($374.8 million) unconsumed past specified rolling periods, or stranded due to design transitions, are repurchased by OEMs at cost as a direct offset against Cost of Revenues.
3. Flexible Procurement Adjustments: While holding $3.15 billion in short-term supplier purchase obligations, Fabrinet retains structural rights to adjust or reschedule PO allocations based on revised rolling customer projections prior to delivery.
The allocation of $252.5 million into physical infrastructure and machinery, coupled with share repurchase reductions from $125.7 million in FY2025 to $5.2 million in FY2026, reflects capital prioritization toward Building 9 and advanced Photonic Integrated Circuit (PIC) cleanroom capacity. While near-term Free Cash Flow conversion remains constrained at 0.09% of top-line, the frontloading of raw materials alongside an Average ROIC of 20.85% (excluding cash) indicates that working capital expansion is directly aligned with next-cycle high-speed transceiver build schedules.
Presentation Download & Video Access:
- Presentation Download: Click the PDF download link under 'Related Topics' to access the full institutional presentation of this report.
- Video Link: Click this link to watch the HDIN analyst briefing on YouTube.
About HDIN Research:
HDIN Research is a premier global market intelligence and strategic advisory firm specializing in institutional-grade financial analysis, supply chain audits, and macroeconomic forecasting. Our dedicated sector analysts deliver actionable, data-driven insights tailored for private equity, hedge funds, and corporate strategy teams. Visit us at http://www.hdinresearch.com.
2026 AI Transparency Footer:
This intelligence report was authored by HDIN Research analysts following a rigorous audit of official corporate filings. AI was utilized for massive-scale data synthesis and structural drafting, ensuring 100% inclusion of reported data points. All strategic insights, financial modeling, and final verdicts were verified by our editorial board to ensure professional accuracy and compliance with 2026 Google Search E-E-A-T standards.