IREN Limited: AI Cloud Pivot Confronts $13.61B Near-Term Capital Deficit as Texas Grid Bottlenecks Threaten 5.71 GW Infrastructure Expansion
Date : 2026-09-01
Reading : 78
HDIN Executive Takeaways
1. Strategic Capital Mismatch: IREN Limited [NASDAQ: IREN] faces a $5.99 billion near-term liquidity deficit against $13.61 billion in FY2027 capital commitments, requiring aggressive capital-market reliance via its $6.0 billion At-The-Market equity facility and $2.40 billion Blue Owl SPV debt package.
2. Regulatory Grid Lock-in: Expansion across the 5,710 MW global development pipeline is bottlenecked by Texas ERCOT’s Batch Zero verification audit under Senate Bill 6 and Oklahoma's Senate Bill 259 groundwater restrictions at the 1,600 MW Kiowa site.
3. Institutional Equity Erosion: While gross megawatt capacity grew 61.54% between FY2024 and FY2026, share issuance (80.5% CAGR) compressed energized capacity per million shares by 43.88% on a fully diluted basis, shifting operational execution risk onto equity holders.
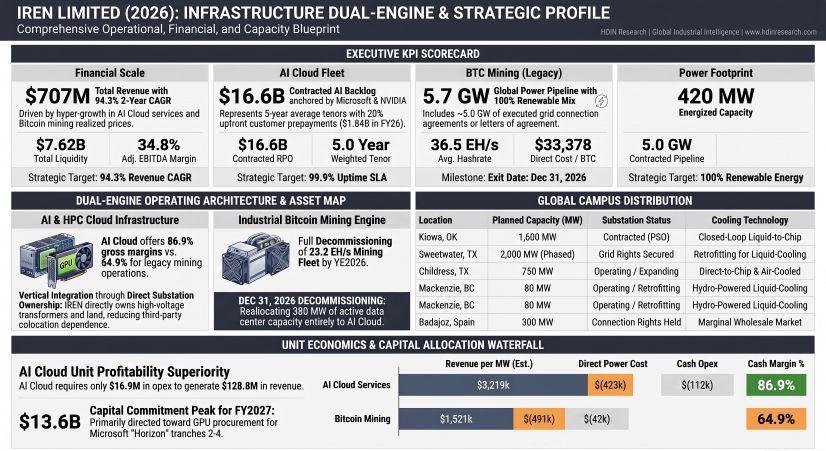
Figure IREN LIMITED (2026): INFRASTRUCTURE DUAL-ENGINE & STRATEGIC PROFILE
 Segment Operating Realities, Depreciation Drag, and the Cash Prepayment Distortion
IREN Limited’s consolidated Form 10-K filing for the fiscal year ended June 30, 2026, illustrates a capital-intensive restructuring. The enterprise is executing a structural transition, shifting from industrial digital asset mining to dedicated High-Performance Computing (HPC) and AI Cloud infrastructure. Consolidated top-line revenue expanded at a 2-year CAGR of 94.34%, rising from $187.19 million in FY2024 to $501.02 million in FY2025, and reaching $707.01 million in FY2026.
Despite top-line expansion, the company reported an operating loss of $(1,046.71) million and a GAAP net loss of $(702.62) million in FY2026, down from net income of $86.94 million in FY2025. This contraction was driven by:
* $(638.81) million in property, plant, and equipment (PPE) asset impairments tied to the early write-down of the ASIC mining hardware fleet.
* $(417.73) million in Depreciation and Amortization (D&A) expenses (a 187.62% 2-year CAGR from $50.47 million in FY2024).
* $(449.12) million in SG&A overhead, inclusive of $205.02 million in stock-based compensation (SBC).
The non-GAAP Adjusted EBITDA reconciliation reflects a $948.29 million variance relative to GAAP net loss, resulting in Adjusted EBITDA of $245.67 million (a 34.75% margin, down 1,907 bps YoY from 53.82% in FY2025). Reconciling items include $(558.54) million in unrealized derivative mark-to-market gains, $111.80 million in debt conversion inducement charges, $110.62 million in fair-value markdowns on assets held for sale, $59.25 million in finance expenses, and $(80.63) million in interest income.
Table Segment Operational Performance, Asset Utilization and ROIC Analysis
Operational cash flows totaled $2,100.42 million in FY2026. However, working capital variations contributed $1,824.70 million, predominantly composed of $1,841.66 million in customer advance payments under the Microsoft Corporation [NASDAQ: MSFT] Horizon agreement (recorded as deferred revenue under ASC 606/842).
Excluding these customer advances, baseline normalized Operating Cash Flow was $258.76 million. Against total capital expenditures of $4,333.09 million ($(2,998.01) million in PPE and data center construction plus $(1,335.08) million in hardware procurement), structural Free Cash Flow registered a deficit of $(2,232.67) million. Total investing cash outflows reached $(4,722.98) million, resulting in an all-in annualized cash burn of $(2,622.57) million ($218.55 million per month).
The legacy mining division mined 6,075 Bitcoins in FY2026 (+10.48% YoY) at an average realized price of $95,179 per BTC. Unit economics show a direct power cost of $30,712 per BTC ($186.58 million total segment power) and a direct cash operating cost of $33,378 per BTC. Allocating consolidated Cash SG&A ($244.09 million, 81.78% segment share) adds $32,860 per BTC, while mining hardware depreciation (7.79% asset share) adds $5,357 per BTC. Fully loaded unit production cost totaled $71,595 per BTC, generating a net operating margin of $23,584 per BTC prior to fleet decommissioning.
Infrastructure Pipeline Siting, ERCOT Regulatory Cliffs, and Power Hedging Architecture
IREN Limited maintains a vertically integrated site ownership structure, holding freehold land title across all development locations. Total power capacity across operating, retrofitting, and pipeline sites stands at 5,710 MW, backed by 5.0 GW in executed grid agreements.
Table Global Data Center Site Portfolio, Grid Capacity and Regulatory Risk Assessment
High-voltage infrastructure equipment procurement faces critical supply-chain constraints:
* High-voltage circuit breakers: Replacement lead times range from 15 to 113 weeks.
* High/low-voltage step-up transformers and switchgear: Lead times range from 16 to 72 weeks.
In Texas, the regulatory environment has tightened. Enacted in June 2025, Texas Senate Bill 6 mandates that loads exceeding 75 MW co-fund transmission interconnection infrastructure and maintain remote-disconnect load-shedding systems.
Following the Governor of Texas's August 3, 2026 directive, the Public Utility Commission of Texas (PUCT) granted ERCOT a Good Cause Exception on August 20, 2026. This exception froze Batch Zero interconnection application timelines to audit data center power draw profiles, delaying grid approvals across the Sweetwater (2.0 GW) and Childress (490 MW unenergized) sites.
Total group electricity costs reached $191.08 million in FY2026 ($186.58 million for Bitcoin Mining; $4.50 million for AI Cloud), representing 27.03% of revenue. Pre-tax earnings exhibit a $19.11 million sensitivity to every 10% movement in wholesale power tariffs.
While historical operations captured $11.7 million in demand response revenue at Childress in FY2026 (+28.7% YoY from $9.4 million), AI Cloud clusters require continuous uptime. To manage power costs under the Microsoft agreement, IREN executed fixed-price physical hedges referenced to ERCOT West Hub. However, the company retains financial exposure to local delivery basis spreads and transmission congestion charges between the West Hub and the Childress delivery node.
HDIN Institutional Verdict: Dilutive Capital Sourcing, Per-Share Asset Erosion, and SPV Recourse Traps
The primary financing mechanism for IREN’s expansion has been continuous equity issuance. Between FY2024 and FY2026, ending basic accounting shares grew from 64.75 million to 380.19 million, representing an 80.5% 2-year CAGR.
* The completed $1.0 billion At-The-Market (ATM) facility issued 66.71 million shares at an average gross price of $14.99.
* The subsequent $6.0 billion ATM program issued 47.17 million shares through August 14, 2026, raising $2,492.06 million gross at an average price of $52.84 per share (incurring $50.38 million in issuance costs).
This rate of share issuance exceeded physical infrastructure energization. Basic energized megawatt capacity per million shares fell 20.86% from 1.39 MW in FY2024 to 1.10 MW in FY2026. On a fully diluted basis (536.26 million shares at a $90.00 share price), energized capacity declines to 0.78 MW per million shares, representing a 43.88% dilution in underlying productive power assets per share.
Table Potentially Dilutive Securities and Equity Dilution Exposure Analysis
IREN’s commercial backlog stands at $16.6 billion, anchored by the 5-year, $9.7 billion Microsoft agreement and a 5-year, $3.4 billion agreement with NVIDIA Corporation [NASDAQ: NVDA], supplemented by $2.8 billion across Prometheus, Perplexity, Together AI, and a frontier AI research lab.
However, customer contracts contain rigid performance covenants. The Microsoft Horizon contract requires 20% advance milestone payments credited against invoices starting in Month 25. If IREN misses delivery grace periods (extending into early Q2 2027 for Horizons 2–4) or violates SLA uptime provisions, customers retain termination rights.
The underlying SPV project debt structures (such as IE US Hardware 3, LLC) include remarketing provisions. If an anchor customer contract is terminated, IREN must secure a replacement agreement with an approved counterparty (Amazon, Alphabet, Meta, or NVIDIA) maintaining a minimum 1.20x Debt Service Coverage Ratio (DSCR).
If an agreement is not executed within the specified remarketing period, the Parent entity guarantees the repayment of all allocated project debt within five business days. This mechanism links operating and grid-connection delays directly to corporate-level liquidity.
Corporate governance structures concentrate voting power. Co-Founders and Co-CEOs Daniel Roberts and William Roberts hold two B Class shares carrying a 15:1 voting multiplier (sunset date November 17, 2033).
On July 1, 2026, the Board granted the Co-CEOs 18.20 million RSUs (a 4.62% equity dilution) that vest purely on 4-year continuous service without operational metrics (e.g., energized MW, fleet efficiency, or ROIC), subject to a 2-year post-vesting holding restriction. Legacy $75 option hurdles were adjusted downward to $71.76 and $143.52 following ATM share issuances.
Additional balance sheet exposures include $127.60 million in unaccrued tax and tariff contingencies, comprising a $100.0 million U.S. Customs country-of-origin tariff dispute (25% import tariff on mining hardware) and a $27.6 million Canadian GST permanent establishment assessment.
Furthermore, IREN's accumulated $1,731.70 million in gross Net Operating Losses (NOLs) carries a $209.39 million valuation allowance due to historical GAAP losses. With $13.61 billion in contractual capital obligations falling due within FY2027 against $7.62 billion in total liquidity, execution of the AI Cloud transition depends on unhindered access to institutional capital markets and timely grid energizations across its core North American footprint.
Presentation Download & Video Access:
Presentation Download: Click the PDF download link under 'Related Topics' to access the full institutional presentation of this report.
Video Link: Click this link to watch the HDIN analyst briefing on YouTube.
About HDIN Research:
HDIN Research is a premier global market intelligence and strategic advisory firm specializing in institutional-grade financial analysis, supply chain audits, and macroeconomic forecasting. Our dedicated sector analysts deliver actionable, data-driven insights tailored for private equity, hedge funds, and corporate strategy teams. Visit us at http://www.hdinresearch.com.
2026 AI Transparency Footer:
"This intelligence report was authored by HDIN Research analysts following a rigorous audit of official corporate filings. AI was utilized for massive-scale data synthesis and structural drafting, ensuring 100% inclusion of reported data points. All strategic insights, financial modeling, and final verdicts were verified by our editorial board to ensure professional accuracy and compliance with 2026 Google Search E-E-A-T standards."
1. Strategic Capital Mismatch: IREN Limited [NASDAQ: IREN] faces a $5.99 billion near-term liquidity deficit against $13.61 billion in FY2027 capital commitments, requiring aggressive capital-market reliance via its $6.0 billion At-The-Market equity facility and $2.40 billion Blue Owl SPV debt package.
2. Regulatory Grid Lock-in: Expansion across the 5,710 MW global development pipeline is bottlenecked by Texas ERCOT’s Batch Zero verification audit under Senate Bill 6 and Oklahoma's Senate Bill 259 groundwater restrictions at the 1,600 MW Kiowa site.
3. Institutional Equity Erosion: While gross megawatt capacity grew 61.54% between FY2024 and FY2026, share issuance (80.5% CAGR) compressed energized capacity per million shares by 43.88% on a fully diluted basis, shifting operational execution risk onto equity holders.
Figure IREN LIMITED (2026): INFRASTRUCTURE DUAL-ENGINE & STRATEGIC PROFILE
Segment Operating Realities, Depreciation Drag, and the Cash Prepayment DistortionIREN Limited’s consolidated Form 10-K filing for the fiscal year ended June 30, 2026, illustrates a capital-intensive restructuring. The enterprise is executing a structural transition, shifting from industrial digital asset mining to dedicated High-Performance Computing (HPC) and AI Cloud infrastructure. Consolidated top-line revenue expanded at a 2-year CAGR of 94.34%, rising from $187.19 million in FY2024 to $501.02 million in FY2025, and reaching $707.01 million in FY2026.
Despite top-line expansion, the company reported an operating loss of $(1,046.71) million and a GAAP net loss of $(702.62) million in FY2026, down from net income of $86.94 million in FY2025. This contraction was driven by:
* $(638.81) million in property, plant, and equipment (PPE) asset impairments tied to the early write-down of the ASIC mining hardware fleet.
* $(417.73) million in Depreciation and Amortization (D&A) expenses (a 187.62% 2-year CAGR from $50.47 million in FY2024).
* $(449.12) million in SG&A overhead, inclusive of $205.02 million in stock-based compensation (SBC).
The non-GAAP Adjusted EBITDA reconciliation reflects a $948.29 million variance relative to GAAP net loss, resulting in Adjusted EBITDA of $245.67 million (a 34.75% margin, down 1,907 bps YoY from 53.82% in FY2025). Reconciling items include $(558.54) million in unrealized derivative mark-to-market gains, $111.80 million in debt conversion inducement charges, $110.62 million in fair-value markdowns on assets held for sale, $59.25 million in finance expenses, and $(80.63) million in interest income.
Table Segment Operational Performance, Asset Utilization and ROIC Analysis
| Segment Operational Breakdown | AI Cloud Services (HPC) | Bitcoin Mining (Legacy) | Consolidated Total |
| Segment Revenue | $128,795,000 | $578,212,000 | $707,007,000 |
| YoY Revenue Growth (%) | +685.6% | +19.3% | +41.1% |
| Direct Cost of Revenue | $(16,932,000) | $(202,774,000) | $(219,706,000) |
| Segment Gross Margin (excl. D&A) | 86.85% | 64.93% | 68.92% |
| Allocated Gross Asset Base | $2,034,811,000 | $596,988,000 | $2,631,799,000 |
| Asset Turnover Ratio | 0.06x | 0.97x | 0.27x |
| Allocated Economic D&A Schedule | 5 Years (20.0% p.a.) | 4 Years (25.0% p.a.) | Blended |
| Allocated Segment Operating Loss | $(355,154,000) | $(24,389,000) | $(1,046,714,000) |
| Segment ROIC (%) | -17.45% | -4.09% | -14.08% |
Operational cash flows totaled $2,100.42 million in FY2026. However, working capital variations contributed $1,824.70 million, predominantly composed of $1,841.66 million in customer advance payments under the Microsoft Corporation [NASDAQ: MSFT] Horizon agreement (recorded as deferred revenue under ASC 606/842).
Excluding these customer advances, baseline normalized Operating Cash Flow was $258.76 million. Against total capital expenditures of $4,333.09 million ($(2,998.01) million in PPE and data center construction plus $(1,335.08) million in hardware procurement), structural Free Cash Flow registered a deficit of $(2,232.67) million. Total investing cash outflows reached $(4,722.98) million, resulting in an all-in annualized cash burn of $(2,622.57) million ($218.55 million per month).
The legacy mining division mined 6,075 Bitcoins in FY2026 (+10.48% YoY) at an average realized price of $95,179 per BTC. Unit economics show a direct power cost of $30,712 per BTC ($186.58 million total segment power) and a direct cash operating cost of $33,378 per BTC. Allocating consolidated Cash SG&A ($244.09 million, 81.78% segment share) adds $32,860 per BTC, while mining hardware depreciation (7.79% asset share) adds $5,357 per BTC. Fully loaded unit production cost totaled $71,595 per BTC, generating a net operating margin of $23,584 per BTC prior to fleet decommissioning.
Infrastructure Pipeline Siting, ERCOT Regulatory Cliffs, and Power Hedging Architecture
IREN Limited maintains a vertically integrated site ownership structure, holding freehold land title across all development locations. Total power capacity across operating, retrofitting, and pipeline sites stands at 5,710 MW, backed by 5.0 GW in executed grid agreements.
Table Global Data Center Site Portfolio, Grid Capacity and Regulatory Risk Assessment
| Campus / Facility Siting | Grid Capacity (MW) | Land Title | Grid & Utility Interconnection Counterparty | Pricing Structure & Commodity Risk Profile | Regulatory Bottlenecks & Legislative Headwinds |
| Childress (Texas, USA) | 260 Operating / 750 Planned | Freehold | ERCOT; AEP Texas Inc.; Lone Star Transmission | Wholesale nodal spot pricing; May 2026 fixed physical power hedges at ERCOT West Hub | Texas SB 6 co-location rules; Gov. Abbott verification audit & Batch Zero Good Cause delays |
| Sweetwater 1 & 2 (Texas, USA) | 2,000 Planned | Freehold | ERCOT Transmission Network | Merchant wholesale; targeting 100% REC retirement offsets | Suspended under ERCOT PGRR 145 / NPRR 1325 Batch Zero transitional studies |
| Kiowa (Oklahoma, USA) | 1,600 Planned | Freehold | Public Service Company of Oklahoma (PSO) | Regulated large-load industrial rate tariff; SPP fuel recovery cost pass-throughs | OK Ratepayer Protection Act (mandatory 10-year term); SB 259 groundwater ban (Nov 2026) |
| Badajoz (Extremadura, Spain) | 300 Planned | Freehold | Spanish National Grid (REE); Nostrum Rights | Iberian marginal market pricing; evaluating shaped renewable PPAs | Royal Decree-Law 7/2026 disconnect mandates; EU carbon price pass-through risk |
| Bundey (South Australia) | 800 Planned | Freehold | National Electricity Market (NEM) | Market-based energy tariffs plus AER regulated network transmission charges | Proposed Australian transmission network cost-allocation amendments |
| British Columbia (3 Sites) | 160 Operating | Freehold | BC Hydro Transmission Network | BC Hydro regulated industrial rate schedule; ~98% clean hydro + 2% RECs | BC Hydro legislative caps on uncontracted expansions; competitive capacity queue |
High-voltage infrastructure equipment procurement faces critical supply-chain constraints:
* High-voltage circuit breakers: Replacement lead times range from 15 to 113 weeks.
* High/low-voltage step-up transformers and switchgear: Lead times range from 16 to 72 weeks.
In Texas, the regulatory environment has tightened. Enacted in June 2025, Texas Senate Bill 6 mandates that loads exceeding 75 MW co-fund transmission interconnection infrastructure and maintain remote-disconnect load-shedding systems.
Following the Governor of Texas's August 3, 2026 directive, the Public Utility Commission of Texas (PUCT) granted ERCOT a Good Cause Exception on August 20, 2026. This exception froze Batch Zero interconnection application timelines to audit data center power draw profiles, delaying grid approvals across the Sweetwater (2.0 GW) and Childress (490 MW unenergized) sites.
Total group electricity costs reached $191.08 million in FY2026 ($186.58 million for Bitcoin Mining; $4.50 million for AI Cloud), representing 27.03% of revenue. Pre-tax earnings exhibit a $19.11 million sensitivity to every 10% movement in wholesale power tariffs.
While historical operations captured $11.7 million in demand response revenue at Childress in FY2026 (+28.7% YoY from $9.4 million), AI Cloud clusters require continuous uptime. To manage power costs under the Microsoft agreement, IREN executed fixed-price physical hedges referenced to ERCOT West Hub. However, the company retains financial exposure to local delivery basis spreads and transmission congestion charges between the West Hub and the Childress delivery node.
HDIN Institutional Verdict: Dilutive Capital Sourcing, Per-Share Asset Erosion, and SPV Recourse Traps
The primary financing mechanism for IREN’s expansion has been continuous equity issuance. Between FY2024 and FY2026, ending basic accounting shares grew from 64.75 million to 380.19 million, representing an 80.5% 2-year CAGR.
* The completed $1.0 billion At-The-Market (ATM) facility issued 66.71 million shares at an average gross price of $14.99.
* The subsequent $6.0 billion ATM program issued 47.17 million shares through August 14, 2026, raising $2,492.06 million gross at an average price of $52.84 per share (incurring $50.38 million in issuance costs).
This rate of share issuance exceeded physical infrastructure energization. Basic energized megawatt capacity per million shares fell 20.86% from 1.39 MW in FY2024 to 1.10 MW in FY2026. On a fully diluted basis (536.26 million shares at a $90.00 share price), energized capacity declines to 0.78 MW per million shares, representing a 43.88% dilution in underlying productive power assets per share.
Table Potentially Dilutive Securities and Equity Dilution Exposure Analysis
| Potentially Dilutive Debt & Equity Instrument | Principal Outstanding | Conversion / Strike Price | Shares Issuable | Stated Coupon & Maturity |
| Convertible Senior Notes (2029) | $233,389,000 | $13.64 | 17,110,630 | 3.50% / Due Dec 15, 2029 |
| Convertible Senior Notes (2030) | $212,310,000 | $16.81 | 12,629,982 | 3.25% / Due June 15, 2030 |
| Convertible Senior Notes (2031) | $1,000,000,000 | $85.63 | 11,678,150 | 0.00% / Due July 1, 2031 |
| Convertible Senior Notes (2032) | $1,150,000,000 | $51.40 | 22,373,541 | 0.25% / Due June 1, 2032 |
| Convertible Senior Notes (2033 Jun) | $1,150,000,000 | $51.40 | 22,373,541 | 1.00% / Due June 1, 2033 |
| Convertible Senior Notes (2033 Dec) | $3,000,000,000 | $73.07 | 41,056,521 | 1.00% / Due Dec 1, 2033 |
| NVIDIA Strategic Investment Rights | N/A | $70.00 | 30,000,000 | Exp. May 7, 2031 ($793.4M FV) |
| Executive & Employee Options | N/A | $66.03 | 5,504,194 | Exp. Weighted 6.8 Years |
| Time-Based Service RSUs | N/A | N/A | 14,989,686 | Weighted Vesting 1.01 Years |
| Market-Based Performance RSUs | N/A | N/A | 5,726,040 | Russell 2000 Relative TSR |
IREN’s commercial backlog stands at $16.6 billion, anchored by the 5-year, $9.7 billion Microsoft agreement and a 5-year, $3.4 billion agreement with NVIDIA Corporation [NASDAQ: NVDA], supplemented by $2.8 billion across Prometheus, Perplexity, Together AI, and a frontier AI research lab.
However, customer contracts contain rigid performance covenants. The Microsoft Horizon contract requires 20% advance milestone payments credited against invoices starting in Month 25. If IREN misses delivery grace periods (extending into early Q2 2027 for Horizons 2–4) or violates SLA uptime provisions, customers retain termination rights.
The underlying SPV project debt structures (such as IE US Hardware 3, LLC) include remarketing provisions. If an anchor customer contract is terminated, IREN must secure a replacement agreement with an approved counterparty (Amazon, Alphabet, Meta, or NVIDIA) maintaining a minimum 1.20x Debt Service Coverage Ratio (DSCR).
If an agreement is not executed within the specified remarketing period, the Parent entity guarantees the repayment of all allocated project debt within five business days. This mechanism links operating and grid-connection delays directly to corporate-level liquidity.
Corporate governance structures concentrate voting power. Co-Founders and Co-CEOs Daniel Roberts and William Roberts hold two B Class shares carrying a 15:1 voting multiplier (sunset date November 17, 2033).
On July 1, 2026, the Board granted the Co-CEOs 18.20 million RSUs (a 4.62% equity dilution) that vest purely on 4-year continuous service without operational metrics (e.g., energized MW, fleet efficiency, or ROIC), subject to a 2-year post-vesting holding restriction. Legacy $75 option hurdles were adjusted downward to $71.76 and $143.52 following ATM share issuances.
Additional balance sheet exposures include $127.60 million in unaccrued tax and tariff contingencies, comprising a $100.0 million U.S. Customs country-of-origin tariff dispute (25% import tariff on mining hardware) and a $27.6 million Canadian GST permanent establishment assessment.
Furthermore, IREN's accumulated $1,731.70 million in gross Net Operating Losses (NOLs) carries a $209.39 million valuation allowance due to historical GAAP losses. With $13.61 billion in contractual capital obligations falling due within FY2027 against $7.62 billion in total liquidity, execution of the AI Cloud transition depends on unhindered access to institutional capital markets and timely grid energizations across its core North American footprint.
Presentation Download & Video Access:
Presentation Download: Click the PDF download link under 'Related Topics' to access the full institutional presentation of this report.
Video Link: Click this link to watch the HDIN analyst briefing on YouTube.
About HDIN Research:
HDIN Research is a premier global market intelligence and strategic advisory firm specializing in institutional-grade financial analysis, supply chain audits, and macroeconomic forecasting. Our dedicated sector analysts deliver actionable, data-driven insights tailored for private equity, hedge funds, and corporate strategy teams. Visit us at http://www.hdinresearch.com.
2026 AI Transparency Footer:
"This intelligence report was authored by HDIN Research analysts following a rigorous audit of official corporate filings. AI was utilized for massive-scale data synthesis and structural drafting, ensuring 100% inclusion of reported data points. All strategic insights, financial modeling, and final verdicts were verified by our editorial board to ensure professional accuracy and compliance with 2026 Google Search E-E-A-T standards."