GO Inc.: Cartel-Backed Taxi Dispatch Hegemony and Negative Cash Conversion Anchor Post-IPO Expansion Across Japan
Date : 2026-08-31
Reading : 580
HDIN Executive Takeaways
1. GO Inc. [TSE: Growth Market] leveraged a 4.96x degree of operating leverage in FY2026, lifting consolidated EBIT 158.10% to ¥7,041.0 million on an asset-light, zero-fleet-ownership platform model.
2. A joint corporate structure linking Nihon Kotsu Holdings and DeNA Co., Ltd. secures 85,000 licensed taxis—over 40% of Japan’s commercial fleet—blocking hostile direct peer-to-peer entrants under Road Transport Act protections.
3. Negative Cash Conversion Cycle of -14.76 days extracts ¥9,706.0 million in working capital float, funding proprietary software and Level 4 Waymo autonomous vehicle dispatch infrastructure without debt dilution.
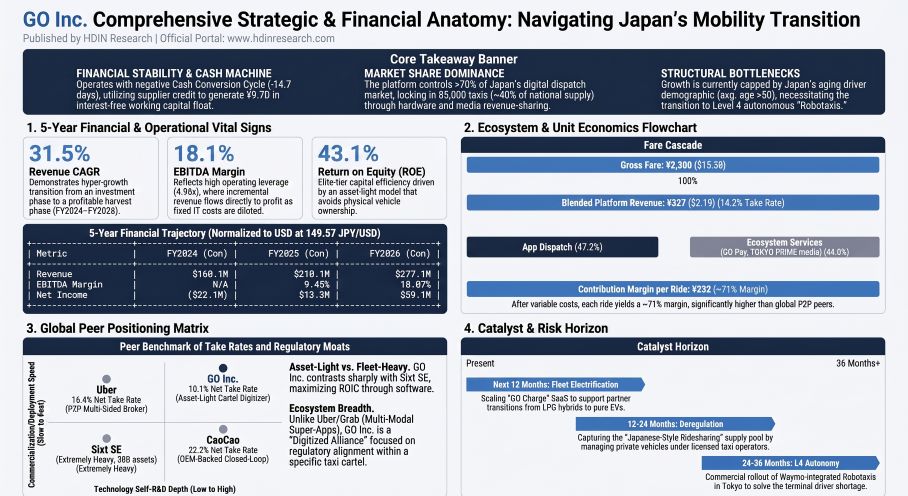
Figure GO Inc Comprehensive Strategic & Financial Anatomy: Navigating Japan's Mobility Transition
 Segmental Realities, Financial Architecture, and Multi-Scenario Projections
Following its June 16, 2026 initial public offering on the Tokyo Stock Exchange Growth Market, corporate filings confirm GO Inc. transitioned from early-stage subsidized customer acquisition to cash-generative scale. Consolidated revenue reached ¥41,446.0 million ($277.10 million at an exchange rate of 1 USD = 149.5686 JPY) in the fiscal period ended May 31, 2026 (FY2026), reflecting a 31.54% two-year compound annual growth rate (CAGR) from FY2024. Operating profit (EBIT) climbed to ¥7,041.0 million ($47.08 million), representing an operating margin of 16.99% compared to 8.68% in FY2025.
Table Consolidated Financial Evolution (FY2022–FY2026)
The corporate revenue mix is split across two main operating segments:
* GO Segment: Generated ¥37,782.0 million ($252.61 million, 91.16% of total revenue) in FY2026, up 38.62% year-over-year. Mobile app dispatch revenue rose 44.07% to ¥19,566.0 million ($130.82 million), while taxi-related ecosystem revenue (GO Pay processing, in-vehicle digital media TOKYO PRIME, hardware terminals, taxi coupons) climbed 33.21% to ¥18,215.0 million ($121.79 million). Segment EBITDA expanded 75.79% to ¥15,227.0 million ($101.81 million), yielding a standalone segment EBITDA margin of 40.30%.
* Others Segment: Generated ¥3,664.0 million ($24.50 million, 8.84% of total revenue), contracting 12.30% year-over-year. The division recorded an operating loss of ¥1,221.0 million ($-8.17 million) and an EBITDA deficit of ¥1,200.0 million ($-8.02 million) due to initial capital expenditures in electric vehicle (EV) charging stations (GO Charge) and autonomous vehicle platform R&D.
* Corporate Reconciliations: Consolidation eliminations and unallocated corporate costs totaled ¥-6,572.0 million, resulting in a reported consolidated EBITDA of ¥7,489.0 million ($50.07 million, 18.07% margin).
Operating leverage manifested via SG&A expense dilution. Total SG&A fell 5.89 percentage points from 42.97% of revenue in FY2025 to 37.08% in FY2026. Advertising and promotional spending dropped from 18.90% to 16.50% (¥7,244.0 million total: ¥4,832.0 million advertising, ¥2,412.0 million sales promotions), while personnel overhead decreased from 9.78% to 7.67%. Research and development expenses increased to ¥815.0 million ($5.45 million, 1.97% of revenue) to support software stacks for Level 4 automated vehicle coordination.
Table Order-Level Unit Economics Waterfall (Typical ¥2,300 Gross Ride Fare)
Working capital efficiency is reinforced by a negative Cash Conversion Cycle of -14.76 days (Days Sales Outstanding of 36.67 days, Days Inventory Outstanding of 1.13 days, Days Payables Outstanding of 52.56 days). This negative cycle generated ¥9,706.0 million ($64.89 million) in operational cash flow, matching FY2026 total net income at a 0.99x OCF-to-Net Income ratio. Total cash and cash equivalents stood at ¥34,584.0 million ($231.23 million) against interest-bearing liabilities of ¥3,342.0 million (short-term bank debt of ¥641.0 million, lease obligations of ¥2,701.0 million), leaving a net cash surplus of ¥31,242.0 million ($208.88 million).
Table Global Mobility Peer Group Benchmarking Matrix (FY2025/FY2026 Reported Datasets)
Table FY2026–FY2029 Multi-Scenario Stress Test Guidance
Infrastructure Footprint, Corporate Governance, and Strategic Growth Pillars
GO Inc.’s operational moat is reinforced by an institutional shareholding cartel comprising Nihon Kotsu Holdings (25.75%), DeNA Co., Ltd. (25.75%), NTT Docomo, Inc. (18.28%), Toyota Motor Corporation (6.44%), Aioi Nissay Dowa Insurance Co., Ltd. (6.18%), and KDDI Corporation (1.93%). Prior to the IPO, on January 22, 2026, the company cancelled its Class A through D Preferred Shares and executed a 1-to-100 stock split on February 20, 2026, converting its equity base into 77,679,600 common shares.
The board consists of five directors, three of whom are independent external members (60.0%: Kiyoyuki Kuwabara, Miki Amemiya, Kohei Terada). Internal director compensation totaled ¥306.0 million ($2.05 million) in FY2026, structured with 74.8% (¥229.0 million) in stock acquisition rights and 0% cash bonuses. Representative Director and CEO Hiroshi Nakajima received 81.2% of his ¥165.0 million total compensation in equity instruments.
The operational architecture spans five quantified pillars:
Table Growth Pillars Feasibility and Synergy Scorecard
Table Supply-Side Market Consolidation Architecture
Strategic M&A and structural carve-outs executed across the network include:
* GO Drive Co., Ltd.: Spun off on August 1, 2025, with Zenrin Co., Ltd. acquiring a 39.99% equity interest alongside Tokyo Century Corporation and Aioi Nissay Dowa Insurance, recognizing a ¥183.0 million gain on reorganization. GO Inc. maintains ¥878.0 million in lease guarantees for the affiliate.
* MOMO A Co., Ltd.: Acquired a 51.50% controlling interest in July 2025 to expand light cargo and online supermarket delivery, providing ¥291.0 million in acquired net cash.
* GO Jobs Co., Ltd.: Reorganized in September 2025 into an equity-method affiliate (34.50% ownership) to deliver specialized driver recruitment software.
* IRIS Co., Ltd.: Marketing subsidiary joint venture operating TOKYO PRIME backseat screens. Handled ¥6,949.0 million in transactions and media spend with GO Inc. in FY2026, while generating ¥7,387.0 million in standalone revenue.
HDIN Institutional Verdict
Management’s thesis that GO Inc. can capture high operating leverage while insulating itself from platform competition is validated by its 16.99% operating margin, -14.76 day cash conversion cycle, and 20.92% ROIC. By aligning with Nihon Kotsu Holdings and DeNA Co., Ltd. rather than deploying capital against traditional operators, GO Inc. converted the Road Transport Act’s ban on unregulated private transport into an entry barrier against global platforms.
However, institutional risks remain concentrated on the supply side. With 71% of Japan's 16,646 taxi operators operating ten or fewer vehicles, the sector faces an aging driver workforce that caps platform capacity during peak hours. Furthermore, the Others Segment posted an EBITDA loss of ¥1,200.0 million in FY2026, highlighting the drag of capital-intensive EV and autonomous vehicle incubation. Sustaining the Bull Case target of ¥90,922.0 million in FY2029 revenue depends on scaling GO Economy under licensed taxi oversight and commercializing Level 4 Waymo dispatches via GO Drive to offset driver attrition.
Presentation Download & Video Access:
- Presentation Download: Click the PDF download link under 'Related Topics' to access the full institutional presentation of this report.
- Video Link: Click this link to watch the HDIN analyst briefing on YouTube.
About HDIN Research:
HDIN Research is a global market intelligence and strategic advisory firm specializing in institutional-grade financial analysis, supply chain audits, and macroeconomic forecasting. Our sector analysts deliver data-driven insights tailored for private equity, hedge funds, and corporate strategy teams. Visit us at http://www.hdinresearch.com.
2026 AI Transparency Footer:
This intelligence report was authored by HDIN Research analysts following an audit of official corporate filings. AI was utilized for massive-scale data synthesis and structural drafting, ensuring 100% inclusion of reported data points. All strategic insights, financial modeling, and final verdicts were verified by our editorial board to ensure professional accuracy and compliance with 2026 Google Search E-E-A-T standards.
1. GO Inc. [TSE: Growth Market] leveraged a 4.96x degree of operating leverage in FY2026, lifting consolidated EBIT 158.10% to ¥7,041.0 million on an asset-light, zero-fleet-ownership platform model.
2. A joint corporate structure linking Nihon Kotsu Holdings and DeNA Co., Ltd. secures 85,000 licensed taxis—over 40% of Japan’s commercial fleet—blocking hostile direct peer-to-peer entrants under Road Transport Act protections.
3. Negative Cash Conversion Cycle of -14.76 days extracts ¥9,706.0 million in working capital float, funding proprietary software and Level 4 Waymo autonomous vehicle dispatch infrastructure without debt dilution.
Figure GO Inc Comprehensive Strategic & Financial Anatomy: Navigating Japan's Mobility Transition
Segmental Realities, Financial Architecture, and Multi-Scenario ProjectionsFollowing its June 16, 2026 initial public offering on the Tokyo Stock Exchange Growth Market, corporate filings confirm GO Inc. transitioned from early-stage subsidized customer acquisition to cash-generative scale. Consolidated revenue reached ¥41,446.0 million ($277.10 million at an exchange rate of 1 USD = 149.5686 JPY) in the fiscal period ended May 31, 2026 (FY2026), reflecting a 31.54% two-year compound annual growth rate (CAGR) from FY2024. Operating profit (EBIT) climbed to ¥7,041.0 million ($47.08 million), representing an operating margin of 16.99% compared to 8.68% in FY2025.
Table Consolidated Financial Evolution (FY2022–FY2026)
| Financial Metric | FY2022 (N-Con.) | FY2023 (N-Con.) | FY2024 (Con.) | FY2025 (Con.) | FY2026 (Con.) |
|---|---|---|---|---|---|
| Revenue (JPY M) | ¥8,405.0 | ¥14,460.0 | ¥23,955.0 | ¥31,434.0 | ¥41,446.0 |
| Revenue (USD M) | $56.19 | $96.68 | $160.16 | $210.16 | $277.10 |
| Gross Profit (JPY M) | N/A | N/A | N/A | ¥16,235.0 | ¥22,412.0 |
| Gross Margin | N/A | N/A | N/A | 51.65% | 54.08% |
| Operating Profit (EBIT) (JPY M) | N/A | N/A | N/A | ¥2,728.0 | ¥7,041.0 |
| Operating Margin | N/A | N/A | N/A | 8.68% | 16.99% |
| EBITDA (JPY M) | N/A | N/A | N/A | ¥2,972.0 | ¥7,489.0 |
| EBITDA Margin | N/A | N/A | N/A | 9.45% | 18.07% |
| Ordinary Profit (JPY M) | ¥(10,929.0) | ¥(8,351.0) | ¥(1,985.0) | ¥2,632.0 | ¥6,457.0 |
| Net Income Attributable to Parent (JPY M) | ¥(11,122.0) | ¥(8,697.0) | ¥(3,307.0) | ¥2,000.0 | ¥8,838.0 |
| Operating Cash Flow (OCF) (JPY M) | N/A | N/A | ¥(1,121.0) | ¥5,041.0 | ¥9,609.0 |
| Investing Cash Flow (ICF) (JPY M) | N/A | N/A | ¥(930.0) | ¥(793.0) | ¥(512.0) |
| Total Assets (JPY M) | ¥27,806.0 | ¥37,322.0 | ¥46,740.0 | ¥57,073.0 | ¥76,471.0 |
| Net Assets (JPY M) | ¥14,330.0 | ¥15,632.0 | ¥14,980.0 | ¥17,548.0 | ¥27,846.0 |
| Net Cash Position (JPY M) | N/A | N/A | N/A | ¥21,501.0 | ¥31,242.0 |
| Debt-to-Asset Ratio | 48.46% | 58.11% | 67.95% | 69.25% | 63.59% |
| Current Ratio / Quick Ratio | N/A | N/A | N/A | 1.46× / 1.33× | 1.45× / 1.38× |
| Return on Equity (ROE) | N/A | N/A | N/A | 13.30% | 43.10% |
| Return on Invested Capital (ROIC) | N/A | N/A | N/A | 10.15% | 20.92% |
The corporate revenue mix is split across two main operating segments:
* GO Segment: Generated ¥37,782.0 million ($252.61 million, 91.16% of total revenue) in FY2026, up 38.62% year-over-year. Mobile app dispatch revenue rose 44.07% to ¥19,566.0 million ($130.82 million), while taxi-related ecosystem revenue (GO Pay processing, in-vehicle digital media TOKYO PRIME, hardware terminals, taxi coupons) climbed 33.21% to ¥18,215.0 million ($121.79 million). Segment EBITDA expanded 75.79% to ¥15,227.0 million ($101.81 million), yielding a standalone segment EBITDA margin of 40.30%.
* Others Segment: Generated ¥3,664.0 million ($24.50 million, 8.84% of total revenue), contracting 12.30% year-over-year. The division recorded an operating loss of ¥1,221.0 million ($-8.17 million) and an EBITDA deficit of ¥1,200.0 million ($-8.02 million) due to initial capital expenditures in electric vehicle (EV) charging stations (GO Charge) and autonomous vehicle platform R&D.
* Corporate Reconciliations: Consolidation eliminations and unallocated corporate costs totaled ¥-6,572.0 million, resulting in a reported consolidated EBITDA of ¥7,489.0 million ($50.07 million, 18.07% margin).
Operating leverage manifested via SG&A expense dilution. Total SG&A fell 5.89 percentage points from 42.97% of revenue in FY2025 to 37.08% in FY2026. Advertising and promotional spending dropped from 18.90% to 16.50% (¥7,244.0 million total: ¥4,832.0 million advertising, ¥2,412.0 million sales promotions), while personnel overhead decreased from 9.78% to 7.67%. Research and development expenses increased to ¥815.0 million ($5.45 million, 1.97% of revenue) to support software stacks for Level 4 automated vehicle coordination.
Table Order-Level Unit Economics Waterfall (Typical ¥2,300 Gross Ride Fare)
| Line Item | Value (JPY) | Value (USD) | % of GTV | % of Net Revenue |
|---|---|---|---|---|
| Passenger Total Expenditure (AOV) | ¥2,300.00 | $15.38 | 100.00% | — |
| — Partner Fleet Share (Fare + Pickup Fee) | ¥(1,972.72) | $(13.19) | -85.77% | — |
| Platform Blended Gross Take Rate | ¥327.28 | $2.19 | 14.23% | 100.00% |
| — App Dispatch Fee (¥19,566M / 115.44M) | ¥169.49 | $1.13 | 7.37% | 51.79% |
| — Ecosystem & Advertising Share (¥18,215M / 115.44M) | ¥157.79 | $1.06 | 6.86% | 48.21% |
| Third-Party Payment & Clearing Fees | ¥(45.00) | $(0.30) | -1.96% | -13.75% |
| Cloud Infrastructure & Server Bandwidth | ¥(18.00) | $(0.12) | -0.78% | -5.50% |
| Driver/Fleet Incentive Deductions | ¥(32.00) | $(0.21) | -1.39% | -9.78% |
| Order-Level Contribution Margin | ¥232.28 | $1.55 | 10.10% | 70.97% |
Working capital efficiency is reinforced by a negative Cash Conversion Cycle of -14.76 days (Days Sales Outstanding of 36.67 days, Days Inventory Outstanding of 1.13 days, Days Payables Outstanding of 52.56 days). This negative cycle generated ¥9,706.0 million ($64.89 million) in operational cash flow, matching FY2026 total net income at a 0.99x OCF-to-Net Income ratio. Total cash and cash equivalents stood at ¥34,584.0 million ($231.23 million) against interest-bearing liabilities of ¥3,342.0 million (short-term bank debt of ¥641.0 million, lease obligations of ¥2,701.0 million), leaving a net cash surplus of ¥31,242.0 million ($208.88 million).
Table Global Mobility Peer Group Benchmarking Matrix (FY2025/FY2026 Reported Datasets)
| Company | Business Paradigm / Model | Nominal / Net Take Rate | Gross Margin | EBITDA (US$M) / Margin | S&M % of Revenue | FCF Inflection Point |
|---|---|---|---|---|---|---|
| GO Inc. (Japan) | Taxi Alliance / B2B SaaS | 14.23% / 10.10% | 54.08% | $50.07 / 18.07% | 17.50% | $1.5B–$1.8B GMV |
| Uber (Global) | Multi-Scenario Super-App | 26.90% / 16.40% | 40.00% | $8,730.0 / 16.78% | 9.40% | ~$130.0B GMV |
| Lyft (USA) | Pure-Play Rideshare | 34.10% / 18.50% | 41.45% | $528.8 / 8.37% | 13.90% | ~$16.0B GMV |
| Grab (Southeast Asia) | Hyperlocal Super-App | 15.20% / 7.20% | 38.00% | $500.0 / 14.83% | 12.50% | $15.0B–$20.0B GMV |
| DiDi (China) | Principal / Grid Dispatch | 50.40% / 16.50% | 19.19% | $903.6 / 2.86% | 7.40% | ~$35.0B GTV |
| CaoCao (China) | OEM Closed-Loop EV Fleet | 86.20% / 22.20% | 9.36% | Positive EBITDA | 8.93% | ~$3.0B GTV |
| Sixt SE (Europe) | Asset-Owner Fleet Rental | 100.0% / N/A | 15.46% (EBT) | $748.7 / 15.46% | 4.00% | Structural Capital |
Table FY2026–FY2029 Multi-Scenario Stress Test Guidance
| Scenario / Line Item | FY2026 (Actual) | FY2027 (Projected) | FY2028 (Projected) | FY2029 (Projected) |
|---|---|---|---|---|
| BASE CASE — 18.31% Revenue CAGR | ||||
| — Platform GMV | ¥265,512.0M | ¥305,339.0M | ¥348,086.0M | ¥389,857.0M |
| — Consolidated Revenue | ¥41,446.0M | ¥50,564.0M | ¥59,666.0M | ¥68,616.0M |
| — EBITDA / EBITDA Margin | ¥7,489.0M / 18.1% | ¥9,860.0M / 19.5% | ¥12,530.0M / 21.0% | ¥15,439.0M / 22.5% |
| — Completed Rides / MAU Pool | 115.44M / 3.11M | 132.80M / 3.48M | 151.30M / 3.83M | 169.50M / 4.14M |
| BULL CASE — 29.93% Revenue CAGR | ||||
| — Platform GMV | ¥265,512.0M | ¥323,925.0M | ¥388,710.0M | ¥458,677.0M |
| — Consolidated Revenue | ¥41,446.0M | ¥55,952.0M | ¥72,738.0M | ¥90,922.0M |
| — EBITDA / EBITDA Margin | ¥7,489.0M / 18.1% | ¥11,750.0M / 21.0% | ¥17,093.0M / 23.5% | ¥22,731.0M / 25.0% |
| — Completed Rides / MAU Pool | 115.44M / 3.11M | 140.80M / 3.67M | 169.00M / 4.26M | 199.40M / 4.85M |
| BEAR CASE — 4.98% Revenue CAGR | ||||
| — Platform GMV | ¥265,512.0M | ¥270,822.0M | ¥273,531.0M | ¥273,531.0M |
| — Consolidated Revenue | ¥41,446.0M | ¥44,762.0M | ¥47,000.0M | ¥47,940.0M |
| — EBITDA / EBITDA Margin | ¥7,489.0M / 18.1% | ¥6,714.0M / 15.0% | ¥5,640.0M / 12.0% | ¥4,794.0M / 10.0% |
| — Completed Rides / MAU Pool | 115.44M / 3.11M | 117.80M / 3.14M | 118.90M / 3.14M | 118.90M / 3.11M |
Infrastructure Footprint, Corporate Governance, and Strategic Growth Pillars
GO Inc.’s operational moat is reinforced by an institutional shareholding cartel comprising Nihon Kotsu Holdings (25.75%), DeNA Co., Ltd. (25.75%), NTT Docomo, Inc. (18.28%), Toyota Motor Corporation (6.44%), Aioi Nissay Dowa Insurance Co., Ltd. (6.18%), and KDDI Corporation (1.93%). Prior to the IPO, on January 22, 2026, the company cancelled its Class A through D Preferred Shares and executed a 1-to-100 stock split on February 20, 2026, converting its equity base into 77,679,600 common shares.
The board consists of five directors, three of whom are independent external members (60.0%: Kiyoyuki Kuwabara, Miki Amemiya, Kohei Terada). Internal director compensation totaled ¥306.0 million ($2.05 million) in FY2026, structured with 74.8% (¥229.0 million) in stock acquisition rights and 0% cash bonuses. Representative Director and CEO Hiroshi Nakajima received 81.2% of his ¥165.0 million total compensation in equity instruments.
The operational architecture spans five quantified pillars:
Table Growth Pillars Feasibility and Synergy Scorecard
| Strategic Pillar / Initiative | Feasibility | Market Size | Synergy | Overall Rating | Core Operational Focus |
|---|---|---|---|---|---|
| Pillar 1: B2B SaaS (GO BUSINESS) | 5.0 / 5.0 | 4.0 / 5.0 | 5.0 / 5.0 | 4.7 / 5.0 | 15,000+ corporate clients |
| Pillar 2: EV Fleet (GO Charge) | 4.0 / 5.0 | 4.0 / 5.0 | 3.0 / 5.0 | 4.0 / 5.0 | Partner depot charging infrastructure |
| Pillar 3: Japan Rideshare (Economy) | 5.0 / 5.0 | 5.0 / 5.0 | 4.0 / 5.0 | 4.6 / 5.0 | Licensed taxi network oversight |
| Pillar 4: Robotaxi Fleet Platform | 3.0 / 5.0 | 5.0 / 5.0 | 5.0 / 5.0 | 4.3 / 5.0 | Waymo Tokyo pilot alliance |
| Pillar 5: Inbound Roaming APIs | 5.0 / 5.0 | 4.0 / 5.0 | 4.0 / 5.0 | 4.3 / 5.0 | Trip.com / OTA integration |
Table Supply-Side Market Consolidation Architecture
| Metric / Segment | Reported Metric | Industry Context / Share |
|---|---|---|
| Total Partner Taxi Fleet Network | 85,000 active vehicles | >40% of the 200,000-vehicle national fleet |
| National Market Structure Breakdown | 16,646 taxi companies | 71% operate ≤10 vehicles; 15% operate ≤30 vehicles |
| Tokyo Metropolitan Dispatch Penetration | 3.0× completed rides | FY2022–FY2026 baseline |
| Regional Hub Coverage | 6 key operating branches | Tokyo, Osaka, Sapporo, Nagoya, Hiroshima, Fukuoka, and Okinawa* |
| Cumulative Application Downloads | >35 million downloads | Largest transit portal in Japan |
| Monthly Active Users (MAU) | 3.11 million active users | 5-year CAGR of 41.9% |
| Annual Dispatch Volume (FY2026) | 115.44 million completed rides | 3-year CAGR of 23.0% |
| Partner Fleet App Utilization Rate | 28.0% of total trips | Up from 10.0% in FY2021 |
| Customer Acquisition Cost (CAC) | ¥6,585 ($44.03) per MAU | ¥965 ($6.45) per download |
| Customer Lifetime Value (LTV) | ¥43,085 ($288.06) over 5 years | LTV/CAC ratio of 6.54× |
Strategic M&A and structural carve-outs executed across the network include:
* GO Drive Co., Ltd.: Spun off on August 1, 2025, with Zenrin Co., Ltd. acquiring a 39.99% equity interest alongside Tokyo Century Corporation and Aioi Nissay Dowa Insurance, recognizing a ¥183.0 million gain on reorganization. GO Inc. maintains ¥878.0 million in lease guarantees for the affiliate.
* MOMO A Co., Ltd.: Acquired a 51.50% controlling interest in July 2025 to expand light cargo and online supermarket delivery, providing ¥291.0 million in acquired net cash.
* GO Jobs Co., Ltd.: Reorganized in September 2025 into an equity-method affiliate (34.50% ownership) to deliver specialized driver recruitment software.
* IRIS Co., Ltd.: Marketing subsidiary joint venture operating TOKYO PRIME backseat screens. Handled ¥6,949.0 million in transactions and media spend with GO Inc. in FY2026, while generating ¥7,387.0 million in standalone revenue.
HDIN Institutional Verdict
Management’s thesis that GO Inc. can capture high operating leverage while insulating itself from platform competition is validated by its 16.99% operating margin, -14.76 day cash conversion cycle, and 20.92% ROIC. By aligning with Nihon Kotsu Holdings and DeNA Co., Ltd. rather than deploying capital against traditional operators, GO Inc. converted the Road Transport Act’s ban on unregulated private transport into an entry barrier against global platforms.
However, institutional risks remain concentrated on the supply side. With 71% of Japan's 16,646 taxi operators operating ten or fewer vehicles, the sector faces an aging driver workforce that caps platform capacity during peak hours. Furthermore, the Others Segment posted an EBITDA loss of ¥1,200.0 million in FY2026, highlighting the drag of capital-intensive EV and autonomous vehicle incubation. Sustaining the Bull Case target of ¥90,922.0 million in FY2029 revenue depends on scaling GO Economy under licensed taxi oversight and commercializing Level 4 Waymo dispatches via GO Drive to offset driver attrition.
Presentation Download & Video Access:
- Presentation Download: Click the PDF download link under 'Related Topics' to access the full institutional presentation of this report.
- Video Link: Click this link to watch the HDIN analyst briefing on YouTube.
About HDIN Research:
HDIN Research is a global market intelligence and strategic advisory firm specializing in institutional-grade financial analysis, supply chain audits, and macroeconomic forecasting. Our sector analysts deliver data-driven insights tailored for private equity, hedge funds, and corporate strategy teams. Visit us at http://www.hdinresearch.com.
2026 AI Transparency Footer:
This intelligence report was authored by HDIN Research analysts following an audit of official corporate filings. AI was utilized for massive-scale data synthesis and structural drafting, ensuring 100% inclusion of reported data points. All strategic insights, financial modeling, and final verdicts were verified by our editorial board to ensure professional accuracy and compliance with 2026 Google Search E-E-A-T standards.