AIR Global PLC: Secondary Resale and Supply-Chain Rerouting Unfold Amid 63.7% Gearing and Counterparty Credit Concentration
Date : 2026-09-01
Reading : 170
HDIN Executive Takeaways
1. AIR Global PLC [NASDAQ: AIIR] posted FY 2025 revenue of $399.74 million (+6.13% YoY) and H1 2026 revenue of $206.90 million (+3.73% YoY), while operating cash flow deteriorated from $9.01 million in H1 2025 to -$107 thousand in H1 2026 due to $89.40 million in transaction costs and working capital expansion.
2. Geopolitical transit bottlenecks in the Strait of Hormuz required overland freight rerouting and shifting U.S.-bound volume to Grodzisk Mazowiecki, Poland (5,500-ton capacity), supported by the buildout of a 6,425-square-meter leased facility in Stefanestii de Jos, Romania.
3. Balance-sheet leverage remains elevated at 63.73% gearing ($424.19 million total debt), while 34.5% of FY 2025 revenue remains concentrated in two counterparties, alongside $113.50 million in total trade credit where 32.7% of external receivables exceed 365 days past due.
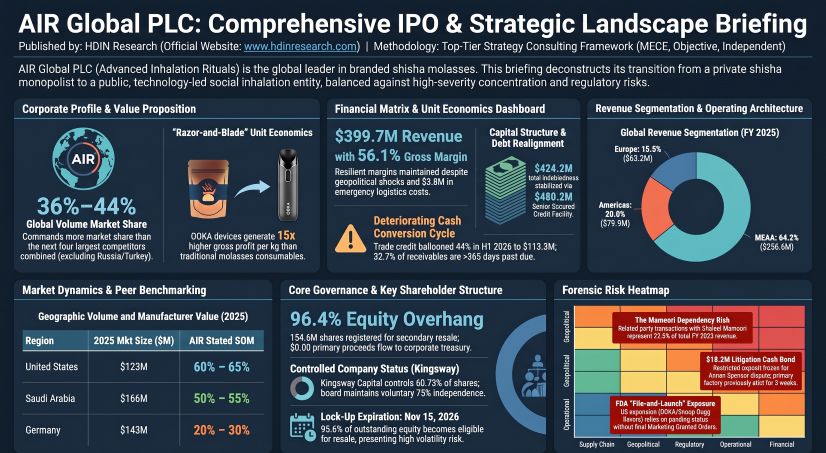
Figure AlR Global PLC: Comprehensive lPO & Strategic Landscape Briefing
 Segmental Realities, Margin Dynamics, and Non-GAAP Adjustments
AIR Global PLC generated consolidated revenue of $399.74 million in FY 2025, an increase of 6.13% YoY from $376.64 million in FY 2024. For H1 2026, revenue reached $206.90 million, up 3.73% YoY compared to $199.47 million in H1 2025. Gross margin contracted 166 basis points YoY in FY 2025 to 56.12% (down from 57.78% in FY 2024), and stood at 56.44% in H1 2026 compared to 57.15% in H1 2025.
The group recorded an IFRS operating loss of $63.60 million and a net loss of $81.82 million in H1 2026, compared to an operating profit of $51.54 million and net profit of $31.97 million in H1 2025, impacted by $48.15 million in IFRS 2 capital reorganization listing expenses and $47.74 million in business combination advisory fees.
Table CONSOLIDATED FINANCIAL PERFORMANCE SUMMARY (FY 2024 – H1 2026)
Flavored Shisha Molasses (FSM) remains the primary core business line, accounting for 98.93% of group revenue in H1 2026, while New Growth Categories (NGCs) contributed 1.07%.
Table IFRS SEGMENTAL REVENUE BREAKDOWN
By customer domicile, MEAA generated $256.63 million in FY 2025 (including Iraq at $50.53 million or 12.64%, and Saudi Arabia at $48.62 million or 12.16%), Americas generated $79.93 million (United States anchor at $78.84 million or 19.72%), and Europe contributed $63.18 million (Germany at $41.48 million or 10.38%; Spain volume share between 30% and 40%). Unsatisfied performance obligations expanded 127.0% from $5.69 million on December 31, 2024, to $7.87 million on December 31, 2025, and $12.91 million on June 30, 2026.
Table NON-GAAP ADJUSTED EBITDA RECONCILIATION SCHEDULE
The unit economics of the core flavored molasses formulation across volume and cost dimensions for FY 2025 show the following structure:
* Tobacco leaf: 14% of volume, 33% of raw material cost (sourced via 18-month forward contracts from Europe and India).
* Flavor concentrates: 5% of volume, 16% of raw material cost (European flavor houses under annual renewals).
* Glycerin: 42% of volume, 7% of raw material cost (Asian sourcing linked to palm oil indices).
* Fructose syrup: 39% of volume, 4% of raw material cost (Turkey).
* Packaging materials: 14% of total COGS.
* Manufacturing overhead and direct labor: 25% of total COGS.
Downstream pricing reveals an average manufacturer selling price (NTO) of ~$15.00/kg, compared to a retail selling price (RSP) of ~$50.00/kg (3.3x markup), a value-for-money lounge price of ~$550.00/kg (37x NTO markup), and a luxury lounge price of ~$2,000.00/kg (133x NTO markup).
Hardware unit economics for OOKA indicate an MSRP of $399.00 in the U.S., €399.00 in Europe ($451.11 USD at 1.1306 EUR/USD), and AED 1,699.00 in the UAE ($462.63 USD at 3.6725 USD/AED). OOKA consumables generate 15x higher gross profit per kilogram and 20x higher net revenue per kilogram than bulk molasses.
Table CONSOLIDATED BALANCE SHEET & LEVERAGE STRUCTURE
Infrastructure Footprint, Credit Aging, and Counterparty Exposure
AIR Global PLC operates 44,800 metric tons of annual molasses production capacity across three company-operated plants:
* Ajman Free Zone (UAE): 25,700 square meters; 28,300 tons capacity; leased under one-year recurring terms.
* Ajman Industrial Zone (UAE): 10,700 square meters; 11,000 tons capacity; company-owned.
* Grodzisk Mazowiecki (Poland): 8,900 square meters; 5,500 tons capacity; leased EU hub.
* Stefanestii de Jos (Romania): 6,425 square meters; leased in H1 2026 and currently under buildout.
* Partner manufacturing sites: Third-party facilities in Egypt, Iraq, Lebanon, and Malaysia (OOKA hardware outsourced to Fox with a 12-month termination clause).
Consolidated capacity utilization sits at ~55.8% based on FY 2024 volume output of ~25,000 tons (~1.0 billion servings at 25g/session), providing ~19,800 tons of operational buffer. Following the late February 2026 maritime blockade of the Strait of Hormuz, the group redirected shipments overland through Saudi Arabia to Gulf of Oman ports (Fujairah and Khor Fakkan) and shifted U.S. supply lines to Poland, resulting in $3.80 million in extraordinary spot glycerin and air-freight costs.
Table RELATED-PARTY TRANSACTION INVENTORY (KHALEEL MAMOORI & AFFILIATES)
Total trade credit extended rose 44.22% from $78.70 million on December 31, 2025, to $113.50 million on June 30, 2026, with $16.80 million subject to legal proceedings. Gross external trade receivables as of December 31, 2025, totaled $53.80 million, categorized as follows:
* Current (0 days past due): $23.20 million (0.00% default rate).
* 1 to 90 days past due: $10.40 million (0.01% loss rate).
* 91 to 365 days past due: $2.60 million.
* Greater than 365 days past due: $17.60 million (32.71% of gross external receivables), carrying an expected credit loss provision of $10.62 million (60.35% loss rate). Arrears include $7.50 million from defaulted Saudi Arabian accounts ($4.60 million single-debtor default), carrying a 63% provision of $4.70 million.
Related-party receivables expanded from $24.85 million to $28.17 million in H1 2026, of which $27.60 million (97.98%) is owed by entities controlled by Khaleel Mamoori (KM Tobacco: $16.19 million; Al Fakher Al Mithaliya: $7.87 million; United General Trading: $2.77 million). These balances carry no collateral, zero interest, and zero expected credit loss allowances.
Legal and regulatory liabilities include:
* Ajman Sponsor Litigation: Ahmed Ibrahim Rashed Al Ghamlasi Al Shamsi obtained a precautionary attachment in December 2025 that halted the Ajman Free Zone facility for 5 weeks. Operations resumed upon posting an $18.20 million bank guarantee (held as restricted cash). Mr. Al Ghamlasi has an active claim for AED 66.86 million (~$18.0 million) in the Ajman Court of First Instance, and has attached three core UAE trademarks. AIR Global PLC countersued for $20.0 million (AED 73.40 million) in Dubai; the court confirmed trademark rights but awarded zero monetary damages in January 2026.
* U.S. FDA Premarket Review: OOKA devices, Two Apples OOKA pods, and Shisha Kartel flavors are marketed in the U.S. under pending Substantial Equivalence (SE) and Exemption Requests (EX REQ) without formal Marketing Granted Orders (MGOs).
* External Investments & Asset Disposals: The group executed a $20.00 million strategic equity investment in Greentank Innovations Corp. ($10.00 million on June 3, 2026; expanded July 29, 2026) for Quantum Vape micro-fluidic chip technology. It completed the acquisition of the remaining 50% of ZeroSmoke F.Z.C. for $800 thousand on July 7, 2026, and discontinued all CBD/cannabis lines as of June 30, 2026.
HDIN Institutional Verdict
AIR Global PLC maintains pricing power and a defensible volume market share of 36% to 44% in flavored shisha molasses, with Al Fakher's top three recipes (Two Apples at 56%, Mint at 20%, Gum with Mint at 10%) generating 86% of brand volume. However, the corporate structure exhibits operational and financial vulnerabilities:
1. Cash Flow Reality of the Listing: The Form F-1 registration covers a secondary resale of 154,623,867 Ordinary Shares (96.4% of total equity) by pre-IPO holders, including Kingsway Capital Partners Limited (60.73% controlling stake) and KIM AIR Limited (9.64%). AIR Global PLC receives $0.00 in primary proceeds while absorbing listing and SEC registration overhead, leaving debt service on $424.19 million in total obligations dependent on operating cash flows and the $47.50 million undrawn portion of its $75.00 million Revolving Credit Facility.
2. Counterparty Subsidization and Collection Lag: Trade receivables aging reveals structural working capital friction, with 32.71% of external receivables uncollected for over a year. Carrying $28.17 million in unsecured, zero-interest related-party receivables from Khaleel Mamoori's entities without credit loss provisions functions as an uncompensated credit facility to affiliated entities.
3. Supply-Chain Single Points of Failure: Despite adding the Poland facility and leasing site space in Stefanestii de Jos, Romania, 87.7% of operated capacity remains in Ajman, UAE, where annual land lease structures and Middle East geopolitical transit exposures create operational risks.
Presentation Download & Video Access
Presentation Download: Click the PDF download link under 'Related Topics' to access the full institutional presentation of this report.
Video Link: Click this link to watch the HDIN analyst briefing on YouTube.
About HDIN Research
HDIN Research is a premier global market intelligence and strategic advisory firm specializing in institutional-grade financial analysis, supply chain audits, and macroeconomic forecasting. Our dedicated sector analysts deliver actionable, data-driven insights tailored for private equity, hedge funds, and corporate strategy teams. Visit us at http://www.hdinresearch.com.
2026 AI Transparency Footer
"This intelligence report was authored by HDIN Research analysts following a rigorous audit of official corporate filings. AI was utilized for massive-scale data synthesis and structural drafting, ensuring 100% inclusion of reported data points. All strategic insights, financial modeling, and final verdicts were verified by our editorial board to ensure professional accuracy and compliance with 2026 Google Search E-E-A-T standards."
1. AIR Global PLC [NASDAQ: AIIR] posted FY 2025 revenue of $399.74 million (+6.13% YoY) and H1 2026 revenue of $206.90 million (+3.73% YoY), while operating cash flow deteriorated from $9.01 million in H1 2025 to -$107 thousand in H1 2026 due to $89.40 million in transaction costs and working capital expansion.
2. Geopolitical transit bottlenecks in the Strait of Hormuz required overland freight rerouting and shifting U.S.-bound volume to Grodzisk Mazowiecki, Poland (5,500-ton capacity), supported by the buildout of a 6,425-square-meter leased facility in Stefanestii de Jos, Romania.
3. Balance-sheet leverage remains elevated at 63.73% gearing ($424.19 million total debt), while 34.5% of FY 2025 revenue remains concentrated in two counterparties, alongside $113.50 million in total trade credit where 32.7% of external receivables exceed 365 days past due.
Figure AlR Global PLC: Comprehensive lPO & Strategic Landscape Briefing
Segmental Realities, Margin Dynamics, and Non-GAAP AdjustmentsAIR Global PLC generated consolidated revenue of $399.74 million in FY 2025, an increase of 6.13% YoY from $376.64 million in FY 2024. For H1 2026, revenue reached $206.90 million, up 3.73% YoY compared to $199.47 million in H1 2025. Gross margin contracted 166 basis points YoY in FY 2025 to 56.12% (down from 57.78% in FY 2024), and stood at 56.44% in H1 2026 compared to 57.15% in H1 2025.
The group recorded an IFRS operating loss of $63.60 million and a net loss of $81.82 million in H1 2026, compared to an operating profit of $51.54 million and net profit of $31.97 million in H1 2025, impacted by $48.15 million in IFRS 2 capital reorganization listing expenses and $47.74 million in business combination advisory fees.
Table CONSOLIDATED FINANCIAL PERFORMANCE SUMMARY (FY 2024 – H1 2026)
| Metric ($000) | FY 2024 | FY 2025 | H1 2025 | H1 2026 |
|---|---|---|---|---|
| Total Revenue | $376,638 | $399,737 | $199,467 | $206,898 |
| Cost of Sales | $(159,009) | $(175,401) | $(85,465) | $(90,134) |
| Gross Profit | $217,629 | $224,336 | $114,002 | $116,764 |
| Gross Margin (%) | 57.78% | 56.12% | 57.15% | 56.44% |
| Operating Profit / (Loss) | $91,028 | $83,151 | $51,538 | $(63,596) |
| Adjusted EBITDA (Non-GAAP) | $129,548 | $139,302 | $71,659 | $71,748 |
| Adjusted EBITDA Margin (%) | 34.40% | 34.85% | 35.93% | 34.68% |
| Net Profit / (Loss) | $34,086 | $46,804 | $31,973 | $(81,820) |
| Operating Cash Flow (OCF) | $150,865 | $115,894 | $9,009 | $(107) |
| Capital Expenditures (CapEx) | $(26,400) | $(25,300) | $(6,800) | $(5,600) |
| Free Cash Flow (Disclosed) | $124,465 | $90,594 | $2,209 | $(5,707) |
| Free Cash Flow (PP&E/Intang.) | $122,759 | N/A | $(303) | $(5,386) |
Flavored Shisha Molasses (FSM) remains the primary core business line, accounting for 98.93% of group revenue in H1 2026, while New Growth Categories (NGCs) contributed 1.07%.
Table IFRS SEGMENTAL REVENUE BREAKDOWN
| Business Segment | FY 2024 ($000) / % | FY 2025 ($000) / % | YoY Growth | H1 2025 ($000) / % | H1 2026 ($000) / % |
|---|---|---|---|---|---|
| FSM – Americas | $74,453 (19.77%) | $79,414 (19.87%) | +6.66% | $41,410 (20.76%) | $42,804 (20.69%) |
| FSM – Europe | $46,230 (12.27%) | $61,966 (15.50%) | +34.04% | $25,063 (12.56%) | $25,233 (12.20%) |
| FSM – MEAA | $253,112 (67.20%) | $255,275 (63.86%) | +0.85% | $131,376 (65.86%) | $136,649 (66.05%) |
| NGCs (Devices & Pouches) | $2,843 (0.75%) | $3,082 (0.77%) | +8.41% | $1,618 (0.81%) | $2,212 (1.07%) |
| Total Group Revenue | $376,638 (100.0%) | $399,737 (100.0%) | +6.13% | $199,467 (100.0%) | $206,898 (100.0%) |
By customer domicile, MEAA generated $256.63 million in FY 2025 (including Iraq at $50.53 million or 12.64%, and Saudi Arabia at $48.62 million or 12.16%), Americas generated $79.93 million (United States anchor at $78.84 million or 19.72%), and Europe contributed $63.18 million (Germany at $41.48 million or 10.38%; Spain volume share between 30% and 40%). Unsatisfied performance obligations expanded 127.0% from $5.69 million on December 31, 2024, to $7.87 million on December 31, 2025, and $12.91 million on June 30, 2026.
Table NON-GAAP ADJUSTED EBITDA RECONCILIATION SCHEDULE
| Metric ($000) | FY 2024 | FY 2025 | H1 2025 | H1 2026 |
|---|---|---|---|---|
| IFRS Profit / (Loss) for the Period | $34,086 | $46,804 | $31,973 | $(81,820) |
| Income Tax Expense | $22,924 | $6,032 | $5,431 | $3,832 |
| Share of Net Loss in Joint Venture | $— | $618 | $329 | $240 |
| Finance Costs | $38,333 | $36,265 | $21,616 | $14,416 |
| Finance Income | $(4,315) | $(6,568) | $(7,811) | $(547) |
| Depreciation – PP&E | $5,015 | $5,242 | $2,494 | $2,492 |
| Depreciation – Right-of-Use Assets | $3,386 | $3,299 | $1,659 | $1,904 |
| Amortization – Intangible Assets | $9,247 | $11,527 | $5,346 | $7,106 |
| Fair Value Changes on Derivatives | $— | $— | $— | $283 |
| Share-Based Compensation | $6,344 | $10,059 | $1,007 | $12,439 |
| Corporate Restructuring Costs | $6,305 | $1,051 | $1,184 | $703 |
| Significant Provisions & Legal Claims | $3,372 | $10,634 | $6,506 | $1,675 |
| Intangible Impairment Losses | $881 | $— | $— | $— |
| Divested Entities Expenses | $633 | $— | $— | $— |
| Regulatory Inventory Write-Down | $1,305 | $— | $— | $— |
| Public Company Readiness Costs | $1,624 | $14,339 | $1,925 | $7,365 |
| Extraordinary Supply Chain Disruption Costs | $408 | $— | $— | $3,795 |
| Fees Related to BCA Transaction | $— | $— | $— | $47,735 |
| IFRS 2 BCA Listing Expense (Net) | $— | $— | $— | $48,150 |
| Regulatory Advisory Costs (PMTA) | $— | $— | $— | $1,980 |
| Adjusted EBITDA (Non-GAAP) | $129,548 | $139,302 | $71,659 | $71,748 |
The unit economics of the core flavored molasses formulation across volume and cost dimensions for FY 2025 show the following structure:
* Tobacco leaf: 14% of volume, 33% of raw material cost (sourced via 18-month forward contracts from Europe and India).
* Flavor concentrates: 5% of volume, 16% of raw material cost (European flavor houses under annual renewals).
* Glycerin: 42% of volume, 7% of raw material cost (Asian sourcing linked to palm oil indices).
* Fructose syrup: 39% of volume, 4% of raw material cost (Turkey).
* Packaging materials: 14% of total COGS.
* Manufacturing overhead and direct labor: 25% of total COGS.
Downstream pricing reveals an average manufacturer selling price (NTO) of ~$15.00/kg, compared to a retail selling price (RSP) of ~$50.00/kg (3.3x markup), a value-for-money lounge price of ~$550.00/kg (37x NTO markup), and a luxury lounge price of ~$2,000.00/kg (133x NTO markup).
Hardware unit economics for OOKA indicate an MSRP of $399.00 in the U.S., €399.00 in Europe ($451.11 USD at 1.1306 EUR/USD), and AED 1,699.00 in the UAE ($462.63 USD at 3.6725 USD/AED). OOKA consumables generate 15x higher gross profit per kilogram and 20x higher net revenue per kilogram than bulk molasses.
Table CONSOLIDATED BALANCE SHEET & LEVERAGE STRUCTURE
| Balance Sheet Item ($000) | Dec. 31, 2024 | Dec. 31, 2025 | June 30, 2026 |
|---|---|---|---|
| Cash and Cash Equivalents | $71,702 | $119,456 | $85,411 |
| Restricted Cash (UAE Bank Collateral) | $— | $— | $18,200 |
| Derivative Financial Assets (Current) | $— | $— | $185 |
| Total Liquid Cash Assets | $71,702 | $119,456 | $103,796 |
| Current Assets | $216,344 | $268,221 | $293,657 |
| Current Liabilities | $235,369 | $138,012 | $207,705 |
| Working Capital (Net Current Position) | $(19,025) | $130,209 | $85,952 |
| Secured Bank Loans (Non-Current) | $250,298 | $357,679 | $338,525 |
| Secured Bank Loans (Current Portion) | $136,704 | $29,852 | $67,338 |
| Lease Liabilities (Non-Current) | $10,754 | $9,935 | $12,782 |
| Lease Liabilities (Current Portion) | $2,179 | $3,348 | $3,445 |
| Derivative Liabilities (Non-Current) | $— | $1,216 | $— |
| Derivative Liabilities (Current) | $— | $558 | $339 |
| Payables Relating to Acquisitions | $7,320 | $1,760 | $1,760 |
| Total Stated Indebtedness | $407,255 | $404,348 | $424,189 |
| Total Shareholders’ Equity | $152,279 | $209,370 | $192,828 |
| Gearing Ratio (%) (Net Debt / Capitalization) | 67.43% | 56.15% | 63.73% |
Infrastructure Footprint, Credit Aging, and Counterparty Exposure
AIR Global PLC operates 44,800 metric tons of annual molasses production capacity across three company-operated plants:
* Ajman Free Zone (UAE): 25,700 square meters; 28,300 tons capacity; leased under one-year recurring terms.
* Ajman Industrial Zone (UAE): 10,700 square meters; 11,000 tons capacity; company-owned.
* Grodzisk Mazowiecki (Poland): 8,900 square meters; 5,500 tons capacity; leased EU hub.
* Stefanestii de Jos (Romania): 6,425 square meters; leased in H1 2026 and currently under buildout.
* Partner manufacturing sites: Third-party facilities in Egypt, Iraq, Lebanon, and Malaysia (OOKA hardware outsourced to Fox with a 12-month termination clause).
Consolidated capacity utilization sits at ~55.8% based on FY 2024 volume output of ~25,000 tons (~1.0 billion servings at 25g/session), providing ~19,800 tons of operational buffer. Following the late February 2026 maritime blockade of the Strait of Hormuz, the group redirected shipments overland through Saudi Arabia to Gulf of Oman ports (Fujairah and Khor Fakkan) and shifted U.S. supply lines to Poland, resulting in $3.80 million in extraordinary spot glycerin and air-freight costs.
Table RELATED-PARTY TRANSACTION INVENTORY (KHALEEL MAMOORI & AFFILIATES)
| Related Counterparty | Nature of Transaction | FY 2023 ($000) | FY 2024 ($000) | FY 2025 ($000) | H1 2026 ($000) | Contract Status |
|---|---|---|---|---|---|---|
| Al Fakher Al Mithaliya (Iraq) | Licensing Royalties | $— | $28,388 | $29,135 | $14,592 | Active through 2033 |
| KM Tobacco General Trading (Iraq) | Raw Material Supply | $57,000 | $17,642 | $21,394 | $7,702 | Active through 2033 |
| Expert Global General Trading (NA) | Finished Goods Sales | $13,500 | $11,285 | $16,181 | $— | Exited in 2026 |
| Al Raed General Trading (LatAm) | Finished Goods Sales | $12,721 | $17,815 | $12,401 | $— | Exited in late 2025 |
| KMMS General Trading (LatAm) | Finished Goods Sales | $— | $— | $2,571 | $2,352 | Active |
| United General Trading (Egypt) | Materials & Royalties | $900 | $7,798 | $7,523 | $3,847 | Active through 2032 |
| ZeroSmoke F.Z.C. (JV – Nicotine) | Finished Goods Sales | $— | $— | $362 | $101 | 100% Acquired |
| whatIF? Consulting (Ian Fearon) | Scientific Consulting | $— | $— | $— | $487 | Ongoing |
Total trade credit extended rose 44.22% from $78.70 million on December 31, 2025, to $113.50 million on June 30, 2026, with $16.80 million subject to legal proceedings. Gross external trade receivables as of December 31, 2025, totaled $53.80 million, categorized as follows:
* Current (0 days past due): $23.20 million (0.00% default rate).
* 1 to 90 days past due: $10.40 million (0.01% loss rate).
* 91 to 365 days past due: $2.60 million.
* Greater than 365 days past due: $17.60 million (32.71% of gross external receivables), carrying an expected credit loss provision of $10.62 million (60.35% loss rate). Arrears include $7.50 million from defaulted Saudi Arabian accounts ($4.60 million single-debtor default), carrying a 63% provision of $4.70 million.
Related-party receivables expanded from $24.85 million to $28.17 million in H1 2026, of which $27.60 million (97.98%) is owed by entities controlled by Khaleel Mamoori (KM Tobacco: $16.19 million; Al Fakher Al Mithaliya: $7.87 million; United General Trading: $2.77 million). These balances carry no collateral, zero interest, and zero expected credit loss allowances.
Legal and regulatory liabilities include:
* Ajman Sponsor Litigation: Ahmed Ibrahim Rashed Al Ghamlasi Al Shamsi obtained a precautionary attachment in December 2025 that halted the Ajman Free Zone facility for 5 weeks. Operations resumed upon posting an $18.20 million bank guarantee (held as restricted cash). Mr. Al Ghamlasi has an active claim for AED 66.86 million (~$18.0 million) in the Ajman Court of First Instance, and has attached three core UAE trademarks. AIR Global PLC countersued for $20.0 million (AED 73.40 million) in Dubai; the court confirmed trademark rights but awarded zero monetary damages in January 2026.
* U.S. FDA Premarket Review: OOKA devices, Two Apples OOKA pods, and Shisha Kartel flavors are marketed in the U.S. under pending Substantial Equivalence (SE) and Exemption Requests (EX REQ) without formal Marketing Granted Orders (MGOs).
* External Investments & Asset Disposals: The group executed a $20.00 million strategic equity investment in Greentank Innovations Corp. ($10.00 million on June 3, 2026; expanded July 29, 2026) for Quantum Vape micro-fluidic chip technology. It completed the acquisition of the remaining 50% of ZeroSmoke F.Z.C. for $800 thousand on July 7, 2026, and discontinued all CBD/cannabis lines as of June 30, 2026.
HDIN Institutional Verdict
AIR Global PLC maintains pricing power and a defensible volume market share of 36% to 44% in flavored shisha molasses, with Al Fakher's top three recipes (Two Apples at 56%, Mint at 20%, Gum with Mint at 10%) generating 86% of brand volume. However, the corporate structure exhibits operational and financial vulnerabilities:
1. Cash Flow Reality of the Listing: The Form F-1 registration covers a secondary resale of 154,623,867 Ordinary Shares (96.4% of total equity) by pre-IPO holders, including Kingsway Capital Partners Limited (60.73% controlling stake) and KIM AIR Limited (9.64%). AIR Global PLC receives $0.00 in primary proceeds while absorbing listing and SEC registration overhead, leaving debt service on $424.19 million in total obligations dependent on operating cash flows and the $47.50 million undrawn portion of its $75.00 million Revolving Credit Facility.
2. Counterparty Subsidization and Collection Lag: Trade receivables aging reveals structural working capital friction, with 32.71% of external receivables uncollected for over a year. Carrying $28.17 million in unsecured, zero-interest related-party receivables from Khaleel Mamoori's entities without credit loss provisions functions as an uncompensated credit facility to affiliated entities.
3. Supply-Chain Single Points of Failure: Despite adding the Poland facility and leasing site space in Stefanestii de Jos, Romania, 87.7% of operated capacity remains in Ajman, UAE, where annual land lease structures and Middle East geopolitical transit exposures create operational risks.
Presentation Download & Video Access
Presentation Download: Click the PDF download link under 'Related Topics' to access the full institutional presentation of this report.
Video Link: Click this link to watch the HDIN analyst briefing on YouTube.
About HDIN Research
HDIN Research is a premier global market intelligence and strategic advisory firm specializing in institutional-grade financial analysis, supply chain audits, and macroeconomic forecasting. Our dedicated sector analysts deliver actionable, data-driven insights tailored for private equity, hedge funds, and corporate strategy teams. Visit us at http://www.hdinresearch.com.
2026 AI Transparency Footer
"This intelligence report was authored by HDIN Research analysts following a rigorous audit of official corporate filings. AI was utilized for massive-scale data synthesis and structural drafting, ensuring 100% inclusion of reported data points. All strategic insights, financial modeling, and final verdicts were verified by our editorial board to ensure professional accuracy and compliance with 2026 Google Search E-E-A-T standards."