Nobel Hygiene Limited: Adult Incontinence Pivot and Halol Expansion Signal Operating Turnaround Amid Sourcing Friction
Date : 2026-09-04
Reading : 94
HDIN Executive Takeaways
1. Nobel Hygiene Limited achieved a structural turnaround in FY26, posting revenue of ₹8,467.50 million (+14.56% YoY) and net profit of ₹189.09 million, driven by an operating leverage multiplier of 3.95x and an adult incontinence revenue mix reaching 49.25%.
2. Sourcing concentration remains a key vulnerability, with 51.34% of raw materials imported (100% of fluff pulp from the US via Ekman Pulp and Paper Limited) without binding supply contracts, dynamic commodity indexation, or active currency hedging.
3. The planned ₹1,500.00 million initial public offering targets ₹420.00 million in debt reduction and ₹713.93 million in brownfield capacity expansion at Halol, Gujarat, adding 100.64 million units annually to capture high-margin period panty and pull-up segments.
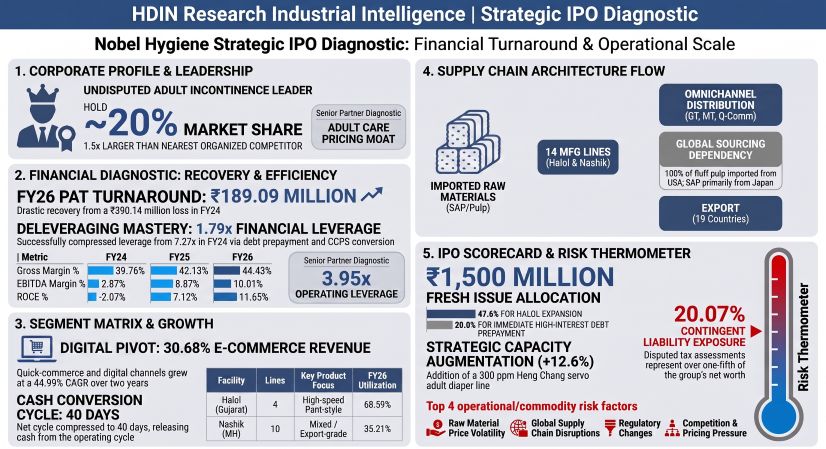
Figure Nobel Hygiene Strategic lPO Diagnostic Financial Turnaround & Operational Scale
 Consolidated Financial Performance and Segment Trajectory
Nobel Hygiene Limited's consolidated restated financial statements from FY24 through FY26 illustrate an inflection from capital-intensive net losses to operating profitability. Top-line revenue expansion of 14.56% YoY in FY26 was supported by an 18.57% volume expansion, contrasting with a 1.46% revenue increase in FY25.
Table Consolidated Financial Performance and Return Metrics (FY2024–FY2026)
DuPont decomposition indicates that the return recovery was driven by margin expansion and improved asset turns, which overcame a sharp contraction in financial leverage:
* Net Profit Margin: Shifted from -5.3551% in FY24 to 0.0308% in FY25, and reached 2.2331% in FY26.
* Asset Turnover (ATO): Advanced from 1.1293x in FY24 (1.1396x in FY25) to 1.2849x in FY26 under average assets (1.2715x under year-end assets).
* Financial Leverage: Dropped from 5.9621x in FY24 (7.2728x year-end) to 3.5119x in FY25, and compressed to 2.0185x in FY26 (1.7894x year-end). Deleveraging was executed through debt repayment—total borrowings fell from ₹3,683.11 million in FY24 to ₹1,134.08 million in FY26—and the conversion of ₹1,535.40 million in Compulsorily Convertible Preference Shares (CCPS) into equity.
Degree of Operating Leverage (DOL) calculated via percentage change was 304.22x in the FY24–FY25 turnaround phase and stabilized at 3.95x in the FY25–FY26 expansion phase. Using the contribution margin method, point-in-time DOL transitioned from -30.55x in FY24 to 9.58x in FY25 and 7.35x in FY26.
Table Revenue Breakdown by Brand and Product Segment (FY2024–FY2026)
In-house production volume totaled 931.98 million units in FY26 (up from 753.25 million units in FY24 and 800.60 million units in FY25). Baby Absorbent Hygiene represented 725.34 million units (77.83%), Adult Absorbent Hygiene represented 169.42 million units (18.18%), and Underpads represented 37.22 million units (3.99%). Category Average Selling Prices (ASP) shifted over the two-year period: Baby Hygiene ASP dropped 12.4% from ₹6.04 to ₹5.29 per unit due to entry-tier SKU formats; Adult Diapers (excluding underpads) decreased 1.5% from ₹25.00 to ₹24.62; and blended Adult Care remained steady, moving from ₹20.27 to ₹20.18 per unit.
Table Revenue Breakdown by Distribution Channel (FY2024–FY2026)
Infrastructure Footprint, Supply Chain Dependencies, and Sourcing Architecture
Manufacturing operations are distributed across Western India via 14 automated production lines across two primary sites:
Table NOBEL HYGIENE PRODUCTION NETWORK
Table Manufacturing Capacity, Output, and Utilization by Production Line (FY2024–FY2026)
Raw material procurement totaled ₹4,705.36 million in FY26. Cost of Materials Consumed reached ₹4,732.01 million, Purchases of Stock-in-Trade were ₹121.55 million, and Changes in Inventories were -₹148.20 million.
Table SUPPLY CHAIN PROCUREMENT BREAKDOWN
Imported inputs expanded from 32.37% (₹1,420.92 million) in FY24 to 51.34% (₹2,415.84 million) in FY26, while domestic procurement contracted from 67.63% (₹2,968.12 million) to 48.66% (₹2,289.52 million). The US supplied 52.07% of imports in FY26 (down from 65.13% in FY25), Japan accounted for 26.99%, Indonesia represented 15.75%, Brazil supplied 2.69%, and Malaysia accounted for 2.19%. Imports from China declined from 12.07% in FY24 to 0.26% in FY26.
Procurement concentration is consolidated within a narrow vendor base:
* Largest Supplier (Ktex Nonwovens Private Limited): Supplied ₹555.10 million in FY26 (11.80% of COGS, 6.56% of Revenue).
* Top 5 Suppliers: Accounted for ₹2,178.12 million in FY26 (46.29% of COGS, 25.72% of Revenue), up from ₹1,541.98 million (35.13% of COGS) in FY24.
* Top 10 Suppliers: Controlled ₹3,132.38 million in FY26 (66.57% of COGS, 36.99% of Revenue), up from ₹2,177.18 million (49.60% of COGS) in FY24. Other named suppliers include Ekman Pulp and Paper Limited (₹351.09 million; 7.46% of COGS), Dot Propack Industries Private Limited (₹185.78 million; 3.95%), Eximius Innovative Private Limited (₹134.21 million; 2.85%), and Everlast Packaging Solutions (₹133.86 million; 2.84%).
The company operates without long-term supply contracts, volume commitments, or raw material price indexation formulas, executing purchases on a spot basis with lead times of 20 to 60 days. In FY26, foreign currency expenditures totaled ₹1,608.38 million against export receipts of ₹646.96 million, leaving net unhedged foreign currency liabilities of ₹253.24 million, including net USD-denominated exposure of -USD 0.76 million (-₹72.74 million at ₹94.65/USD) and -EUR 0.01 million (-₹1.42 million). Sensitivity analysis indicates that a 10% adverse shock in pulp and SAP prices reduces absolute EBITDA by ₹283.92 million (335 bps margin compression to 6.66%), while a 5% INR depreciation reduces Profit Before Tax (PBT) by ₹3.64 million.
Table Export sales generated ₹646.96 million across 19 countries in FY26
Domestic operations cover 473 cities across 31 States and Union Territories with 1,158 SKUs. Distribution channels include 47,513 direct retail touchpoints and 217,930 indirect outlets supported by 418 distributors and 296 super stockists. No individual Indian state contributed more than 15.00% of revenue in FY24, FY25, or FY26.
The IPO structure comprises a Fresh Issue of ₹1,500.00 million and an Offer for Sale of up to 15,511,082 equity shares. Selling shareholders include Orbit Investment Holdings Pte. Ltd. (Quadria Capital) and Sixth Sense India Opportunities III.
The ₹957.86 million total Halol expansion (₹713.93 million via IPO proceeds, ₹243.93 million via internal accruals) adds a Heng Chang Machinery Co. Ltd. FS-CNK-300 fully-servo machine line operating at 250 to 300 pieces per minute. Assuming 7,488 annual operating hours at an 81.45% efficiency factor, installed capacity will increase by 100.64 million units per annum (+12.61%), raising Halol’s plant capacity to 898.56 million units by commercial launch in March 2028.
HDIN Institutional Verdict
Nobel Hygiene's operational pivot toward adult incontinence (49.25% revenue share) provides margin defense, with the segment commanding a ~19.86% domestic market share (₹4,170.45 million revenue against an industry pool of ₹20.50–21.50 billion). This focus creates a higher Customer Lifetime Value (LTV of ₹207,060 to ₹258,825) compared to competitive multinational positions in the baby care sector (where Unicharm India posted FY25 standalone revenues of ₹39,505.90 million and Kimberly-Clark India generated -16.53% PAT margins). Working capital management reduced the Cash Conversion Cycle from 59 to 40 days, while trade working capital days reached 22 days, and net working capital shifted from -₹626.19 million in FY24 to +₹520.55 million in FY26.
Management's operational narrative faces several critical financial and governance frictions:
1. Sourcing and Hedging Exposure: Importing 51.34% of material inputs under short-term spot orders without currency or commodity hedging creates gross margin vulnerability. A 10% price escalation across imported pulp and SAP would reduce the FY26 EBITDA pool by 33.50%.
2. Working Capital and Return Deductions: The shift toward e-commerce and quick-commerce channels (30.68% of FY26 revenue) increased trade scheme discounts to ₹870.50 million (+130.49% YoY) and sales returns to ₹416.64 million (+522.41% YoY), diluting gross contractual billings of ₹9,631.76 million down to net contract revenues of ₹8,344.62 million.
3. Legal and Contingency Overhang: Contingent liabilities of ₹747.06 million equal 20.07% of the group's ₹3,721.80 million net worth base. Primary items include ₹735.57 million in disputed direct tax assessments involving contested supplier purchases (Aadhar Venture/Arpita Tradelink) and a ₹350.55 million tax addition regarding the intercompany business transfer of the Halol facility to subsidiary NHBPL under Section 56(2)(x).
4. Governance and Human Capital Friction: Executive remuneration of ₹77.76 million across KMP and Senior Management accounted for 41.12% of FY26 net earnings (including ₹35.00 million paid to Promoter CMD Kamal Kumar Johari). In addition, permanent employee attrition remained elevated at 44.26% in FY24, 35.55% in FY25, and 40.48% in FY26, creating operational continuity challenges during ongoing facility expansions.
Presentation Download & Video Access:
- Presentation Download: Click the PDF download link under 'Related Topics' to access the full institutional presentation of this report.
- Video Link: Click this link to watch the HDIN analyst briefing on YouTube.
About HDIN Research:
HDIN Research is a premier global market intelligence and strategic advisory firm specializing in institutional-grade financial analysis, supply chain audits, and macroeconomic forecasting. Our dedicated sector analysts deliver actionable, data-driven insights tailored for private equity, hedge funds, and corporate strategy teams. Visit us at http://www.hdinresearch.com.
2026 AI Transparency Footer:
This intelligence report was authored by HDIN Research analysts following a rigorous audit of official corporate filings. AI was utilized for massive-scale data synthesis and structural drafting, ensuring 100% inclusion of reported data points. All strategic insights, financial modeling, and final verdicts were verified by our editorial board to ensure professional accuracy and compliance with 2026 Google Search E-E-A-T standards.
1. Nobel Hygiene Limited achieved a structural turnaround in FY26, posting revenue of ₹8,467.50 million (+14.56% YoY) and net profit of ₹189.09 million, driven by an operating leverage multiplier of 3.95x and an adult incontinence revenue mix reaching 49.25%.
2. Sourcing concentration remains a key vulnerability, with 51.34% of raw materials imported (100% of fluff pulp from the US via Ekman Pulp and Paper Limited) without binding supply contracts, dynamic commodity indexation, or active currency hedging.
3. The planned ₹1,500.00 million initial public offering targets ₹420.00 million in debt reduction and ₹713.93 million in brownfield capacity expansion at Halol, Gujarat, adding 100.64 million units annually to capture high-margin period panty and pull-up segments.
Figure Nobel Hygiene Strategic lPO Diagnostic Financial Turnaround & Operational Scale
Consolidated Financial Performance and Segment TrajectoryNobel Hygiene Limited's consolidated restated financial statements from FY24 through FY26 illustrate an inflection from capital-intensive net losses to operating profitability. Top-line revenue expansion of 14.56% YoY in FY26 was supported by an 18.57% volume expansion, contrasting with a 1.46% revenue increase in FY25.
Table Consolidated Financial Performance and Return Metrics (FY2024–FY2026)
| Metric (Consolidated) | FY24 | FY25 | FY26 | YoY Variance (FY25 to FY26) | Two-Year Multi-Period Variance |
| Revenue from Operations (₹ Mn) | 7,285.43 | 7,391.46 | 8,467.50 | +14.56% | +16.23% |
| Cost of Goods Sold (COGS) (₹ Mn) | 4,389.04 | 4,277.54 | 4,705.36 | +10.00% | +7.21% |
| Gross Profit (Product Profit) (₹ Mn) | 2,896.39 | 3,113.92 | 3,762.14 | +20.82% | +29.89% |
| Gross Margin (%) | 39.76% | 42.13% | 44.43% | +230 bps | +467 bps |
| EBITDA (₹ Mn) | 209.22 | 655.77 | 847.59 | +29.25% | +305.12% |
| EBITDA Margin (%) | 2.87% | 8.87% | 10.01% | +114 bps | +714 bps |
| EBIT (₹ Mn) | (94.81) | 324.96 | 511.79 | +57.49% | N/A (Turnaround) |
| EBIT Margin (%) | -1.30% | 4.40% | 6.04% | +164 bps | +734 bps |
| Restated Profit After Tax (PAT) (₹ Mn) | (390.14) | 2.28 | 189.09 | +8,193.42% | N/A (Turnaround) |
| PAT Margin (%) | -5.36% | 0.03% | 2.23% | +220 bps | +759 bps |
| Cash Flow from Operations (CFO) (₹ Mn) | 510.98 | 223.71 | 711.34 | +217.97% | +39.21% |
| Return on Capital Employed (ROCE) (%) | -2.07% | 7.12% | 11.65% | +453 bps | +1,372 bps |
| Return on Equity (Note 53 Avg Equity) (%) | -36.05% | 0.12% | 5.79% | +567 bps | +4,184 bps |
| Return on Net Worth (Year-End Net Worth) (%) | -43.98% | 0.08% | 5.08% | +500 bps | +4,906 bps |
DuPont decomposition indicates that the return recovery was driven by margin expansion and improved asset turns, which overcame a sharp contraction in financial leverage:
* Net Profit Margin: Shifted from -5.3551% in FY24 to 0.0308% in FY25, and reached 2.2331% in FY26.
* Asset Turnover (ATO): Advanced from 1.1293x in FY24 (1.1396x in FY25) to 1.2849x in FY26 under average assets (1.2715x under year-end assets).
* Financial Leverage: Dropped from 5.9621x in FY24 (7.2728x year-end) to 3.5119x in FY25, and compressed to 2.0185x in FY26 (1.7894x year-end). Deleveraging was executed through debt repayment—total borrowings fell from ₹3,683.11 million in FY24 to ₹1,134.08 million in FY26—and the conversion of ₹1,535.40 million in Compulsorily Convertible Preference Shares (CCPS) into equity.
Degree of Operating Leverage (DOL) calculated via percentage change was 304.22x in the FY24–FY25 turnaround phase and stabilized at 3.95x in the FY25–FY26 expansion phase. Using the contribution margin method, point-in-time DOL transitioned from -30.55x in FY24 to 9.58x in FY25 and 7.35x in FY26.
Table Revenue Breakdown by Brand and Product Segment (FY2024–FY2026)
| Brand and Segment Portfolio | FY24 Revenue (₹ Mn) | FY24 Mix (%) | FY25 Revenue (₹ Mn) | FY25 Mix (%) | FY26 Revenue (₹ Mn) | FY26 Mix (%) |
| Adult Absorbent Hygiene | 3,352.39 | 46.02% | 3,530.91 | 47.77% | 4,170.45 | 49.25% |
| -- Friends (Premium Adult) | 2,726.28 | 37.42% | 2,783.14 | 37.65% | 3,205.05 | 37.85% |
| -- B-Fit (Value Adult) | 624.68 | 8.57% | 752.10 | 10.18% | 916.73 | 10.83% |
| Baby Absorbent Hygiene | 3,550.33 | 48.73% | 3,520.31 | 47.63% | 3,837.45 | 45.32% |
| -- Teddyy (Home-grown Brand) | 2,613.48 | 35.87% | 2,827.94 | 38.26% | 3,355.80 | 39.63% |
| -- Snuggy (Value Brand) | 574.57 | 7.89% | 478.98 | 6.48% | 361.79 | 4.27% |
| Feminine Absorbent Hygiene (RIO) | 113.18 | 1.55% | 105.40 | 1.43% | 72.93 | 0.86% |
| Ancillary, Private Label & Others | 269.53 | 3.70% | 234.84 | 3.17% | 386.67 | 4.57% |
| -- Ancillary Products | 45.53 | 0.62% | 28.68 | 0.39% | 43.43 | 0.51% |
| -- Private Label Manufacturing | 418.29 | 5.74% | 296.58 | 4.01% | 264.57 | 3.12% |
| -- Scrap Sales & Traded Materials | 169.42 | 2.34% | 118.64 | 1.60% | 247.20 | 2.93% |
| Total Revenue from Operations | 7,285.43 | 100.00% | 7,391.46 | 100.00% | 8,467.50 | 100.00% |
In-house production volume totaled 931.98 million units in FY26 (up from 753.25 million units in FY24 and 800.60 million units in FY25). Baby Absorbent Hygiene represented 725.34 million units (77.83%), Adult Absorbent Hygiene represented 169.42 million units (18.18%), and Underpads represented 37.22 million units (3.99%). Category Average Selling Prices (ASP) shifted over the two-year period: Baby Hygiene ASP dropped 12.4% from ₹6.04 to ₹5.29 per unit due to entry-tier SKU formats; Adult Diapers (excluding underpads) decreased 1.5% from ₹25.00 to ₹24.62; and blended Adult Care remained steady, moving from ₹20.27 to ₹20.18 per unit.
Table Revenue Breakdown by Distribution Channel (FY2024–FY2026)
| Channel Architecture | FY24 (₹ Mn) | FY24 Mix (%) | FY25 (₹ Mn) | FY25 Mix (%) | FY26 (₹ Mn) | FY26 Mix (%) |
| Traditional General Trade (GT) | 4,555.30 | 62.53% | 4,000.73 | 54.13% | 4,036.24 | 47.67% |
| Quick Commerce & E-commerce | 1,236.04 | 16.97% | 1,881.29 | 25.45% | 2,598.25 | 30.68% |
| Branded Exports | 344.74 | 4.73% | 422.42 | 5.71% | 646.96 | 7.64% |
| Private / White-Label Manufacturing | 411.94 | 5.65% | 330.13 | 4.47% | 277.92 | 3.28% |
| Institutional Hospital Sales | 186.28 | 2.56% | 214.53 | 2.90% | 246.58 | 2.91% |
| Modern Trade (MT) | 121.15 | 1.66% | 127.52 | 1.73% | 159.55 | 1.88% |
| Others (Ancillary, Scrap, Traded) | 229.98 | 3.16% | 114.84 | 1.55% | 502.00 | 5.92% |
| Total Revenue from Operations | 7,285.43 | 100.00% | 7,391.46 | 100.00% | 8,467.50 | 100.00% |
Infrastructure Footprint, Supply Chain Dependencies, and Sourcing Architecture
Manufacturing operations are distributed across Western India via 14 automated production lines across two primary sites:
Table NOBEL HYGIENE PRODUCTION NETWORK
| Manufacturing Facility | Machine Lines | Installed Capacity (Mn Units) | FY2026 Output (Mn Units) | Capacity Utilization | Product / Operational Focus | Certification / Ownership |
|---|---|---|---|---|---|---|
| Nashik Facility (Maharashtra) | 10 | 1,092.65 | 384.71 | 35.21% | Tape-Style Diapers & Underpads | MDSAP & BIS Certified Export Facility |
| Halol Facility (Gujarat) | 4 | 797.92 | 547.27 | 68.59% | Pant-Style Diaper Lines | Operated by Subsidiary NHBPL |
Table Manufacturing Capacity, Output, and Utilization by Production Line (FY2024–FY2026)
| Manufacturing Line Segment | Annual Capacity (Mn) | FY24 Out (Mn) | FY24 Util (%) | FY25 Out (Mn) | FY25 Util (%) | FY26 Out (Mn) | FY26 Util (%) |
| Nashik: Baby Diaper (Tape) | 215.65 | 151.85 | 70.42% | 140.60 | 65.20% | 175.28 | 81.28% |
| Nashik: Baby Diaper (Pant) | 625.40 | 162.58 | 26.00% | 108.69 | 17.38% | 79.74 | 12.75% |
| Nashik: Adult Diaper (Tape) | 118.61 | 60.96 | 51.40% | 64.24 | 54.16% | 70.08 | 59.08% |
| Nashik: Adult Diaper (Pant) | 82.67 | 32.65 | 39.49% | 16.34 | 19.76% | 22.39 | 27.09% |
| Nashik: Underpads | 50.32 | 31.32 | 62.23% | 34.15 | 67.87% | 37.22 | 73.97% |
| Halol: Baby Diaper (Pant) | 700.88 | 273.41 | 42.56% | 380.06 | 54.23% | 470.32 | 67.10% |
| Halol: Adult Diaper (Pant) | 97.04 | 40.48 | 41.71% | 56.52 | 58.24% | 76.95 | 79.30% |
| Consolidated Plant Output | 1,890.57 | 753.25 | 39.84% | 800.60 | 42.35% | 931.98 | 49.30% |
Raw material procurement totaled ₹4,705.36 million in FY26. Cost of Materials Consumed reached ₹4,732.01 million, Purchases of Stock-in-Trade were ₹121.55 million, and Changes in Inventories were -₹148.20 million.
Table SUPPLY CHAIN PROCUREMENT BREAKDOWN
| Raw Material | Estimated Cost Share | Estimated Cost (₹ Mn) | Primary Sourcing / Supplier |
|---|---|---|---|
| Wood Pulp (Fluff Pulp) | ~30% | ₹1,419.60 Mn | 100% imported from the U.S. (Ekman) |
| Super Absorbent Polymer (SAP) | ~30% | ₹1,419.60 Mn | Imported from Japan/Asia (Sumitomo) |
| Non-Woven Fabrics | ~25% | ₹1,183.00 Mn | Domestic sourcing (Ktex Nonwovens) |
| Backsheet Polyethylene | ~8% | ₹378.56 Mn | Domestic extruders |
| Adhesives & Elastics | ~4% | ₹189.28 Mn | Imported from Japan |
| Packaging Cartons & Bags | ~3% | ₹141.96 Mn | Domestic sourcing (Everlast) |
Imported inputs expanded from 32.37% (₹1,420.92 million) in FY24 to 51.34% (₹2,415.84 million) in FY26, while domestic procurement contracted from 67.63% (₹2,968.12 million) to 48.66% (₹2,289.52 million). The US supplied 52.07% of imports in FY26 (down from 65.13% in FY25), Japan accounted for 26.99%, Indonesia represented 15.75%, Brazil supplied 2.69%, and Malaysia accounted for 2.19%. Imports from China declined from 12.07% in FY24 to 0.26% in FY26.
Procurement concentration is consolidated within a narrow vendor base:
* Largest Supplier (Ktex Nonwovens Private Limited): Supplied ₹555.10 million in FY26 (11.80% of COGS, 6.56% of Revenue).
* Top 5 Suppliers: Accounted for ₹2,178.12 million in FY26 (46.29% of COGS, 25.72% of Revenue), up from ₹1,541.98 million (35.13% of COGS) in FY24.
* Top 10 Suppliers: Controlled ₹3,132.38 million in FY26 (66.57% of COGS, 36.99% of Revenue), up from ₹2,177.18 million (49.60% of COGS) in FY24. Other named suppliers include Ekman Pulp and Paper Limited (₹351.09 million; 7.46% of COGS), Dot Propack Industries Private Limited (₹185.78 million; 3.95%), Eximius Innovative Private Limited (₹134.21 million; 2.85%), and Everlast Packaging Solutions (₹133.86 million; 2.84%).
The company operates without long-term supply contracts, volume commitments, or raw material price indexation formulas, executing purchases on a spot basis with lead times of 20 to 60 days. In FY26, foreign currency expenditures totaled ₹1,608.38 million against export receipts of ₹646.96 million, leaving net unhedged foreign currency liabilities of ₹253.24 million, including net USD-denominated exposure of -USD 0.76 million (-₹72.74 million at ₹94.65/USD) and -EUR 0.01 million (-₹1.42 million). Sensitivity analysis indicates that a 10% adverse shock in pulp and SAP prices reduces absolute EBITDA by ₹283.92 million (335 bps margin compression to 6.66%), while a 5% INR depreciation reduces Profit Before Tax (PBT) by ₹3.64 million.
Table Export sales generated ₹646.96 million across 19 countries in FY26
| UN Geopolitical Region | Destination Countries | FY26 Revenue (₹ Mn) | Export Share (%) |
| Western Asia | UAE (₹235.93 Mn), Israel (₹33.28 Mn), Oman (₹18.87 Mn), Qatar (₹1.66 Mn) | 289.74 | 44.79% |
| Southern Asia | Sri Lanka (₹156.92 Mn), Maldives (₹6.15 Mn), Nepal (₹3.64 Mn) | 166.71 | 25.77% |
| Eastern Europe | Russian Federation (₹60.72 Mn), Ukraine (₹6.02 Mn) | 66.74 | 10.32% |
| Northern Europe | United Kingdom | 58.90 | 9.10% |
| Eastern Africa | Uganda (₹27.92 Mn), Seychelles (₹6.12 Mn), Mauritius (₹2.31 Mn), Kenya (₹2.14 Mn) | 38.49 | 5.95% |
| Southeastern Asia | Thailand | 16.21 | 2.51% |
| Melanesia | Fiji | 4.73 | 0.73% |
| South America | Guyana | 2.62 | 0.40% |
| Central America | Panama | 1.91 | 0.30% |
| Southern Europe | Malta | 0.92 | 0.14% |
| Total Consolidated Exports | 19 Destination Markets | 646.96 | 100.00% |
Domestic operations cover 473 cities across 31 States and Union Territories with 1,158 SKUs. Distribution channels include 47,513 direct retail touchpoints and 217,930 indirect outlets supported by 418 distributors and 296 super stockists. No individual Indian state contributed more than 15.00% of revenue in FY24, FY25, or FY26.
The IPO structure comprises a Fresh Issue of ₹1,500.00 million and an Offer for Sale of up to 15,511,082 equity shares. Selling shareholders include Orbit Investment Holdings Pte. Ltd. (Quadria Capital) and Sixth Sense India Opportunities III.
The ₹957.86 million total Halol expansion (₹713.93 million via IPO proceeds, ₹243.93 million via internal accruals) adds a Heng Chang Machinery Co. Ltd. FS-CNK-300 fully-servo machine line operating at 250 to 300 pieces per minute. Assuming 7,488 annual operating hours at an 81.45% efficiency factor, installed capacity will increase by 100.64 million units per annum (+12.61%), raising Halol’s plant capacity to 898.56 million units by commercial launch in March 2028.
HDIN Institutional Verdict
Nobel Hygiene's operational pivot toward adult incontinence (49.25% revenue share) provides margin defense, with the segment commanding a ~19.86% domestic market share (₹4,170.45 million revenue against an industry pool of ₹20.50–21.50 billion). This focus creates a higher Customer Lifetime Value (LTV of ₹207,060 to ₹258,825) compared to competitive multinational positions in the baby care sector (where Unicharm India posted FY25 standalone revenues of ₹39,505.90 million and Kimberly-Clark India generated -16.53% PAT margins). Working capital management reduced the Cash Conversion Cycle from 59 to 40 days, while trade working capital days reached 22 days, and net working capital shifted from -₹626.19 million in FY24 to +₹520.55 million in FY26.
Management's operational narrative faces several critical financial and governance frictions:
1. Sourcing and Hedging Exposure: Importing 51.34% of material inputs under short-term spot orders without currency or commodity hedging creates gross margin vulnerability. A 10% price escalation across imported pulp and SAP would reduce the FY26 EBITDA pool by 33.50%.
2. Working Capital and Return Deductions: The shift toward e-commerce and quick-commerce channels (30.68% of FY26 revenue) increased trade scheme discounts to ₹870.50 million (+130.49% YoY) and sales returns to ₹416.64 million (+522.41% YoY), diluting gross contractual billings of ₹9,631.76 million down to net contract revenues of ₹8,344.62 million.
3. Legal and Contingency Overhang: Contingent liabilities of ₹747.06 million equal 20.07% of the group's ₹3,721.80 million net worth base. Primary items include ₹735.57 million in disputed direct tax assessments involving contested supplier purchases (Aadhar Venture/Arpita Tradelink) and a ₹350.55 million tax addition regarding the intercompany business transfer of the Halol facility to subsidiary NHBPL under Section 56(2)(x).
4. Governance and Human Capital Friction: Executive remuneration of ₹77.76 million across KMP and Senior Management accounted for 41.12% of FY26 net earnings (including ₹35.00 million paid to Promoter CMD Kamal Kumar Johari). In addition, permanent employee attrition remained elevated at 44.26% in FY24, 35.55% in FY25, and 40.48% in FY26, creating operational continuity challenges during ongoing facility expansions.
Presentation Download & Video Access:
- Presentation Download: Click the PDF download link under 'Related Topics' to access the full institutional presentation of this report.
- Video Link: Click this link to watch the HDIN analyst briefing on YouTube.
About HDIN Research:
HDIN Research is a premier global market intelligence and strategic advisory firm specializing in institutional-grade financial analysis, supply chain audits, and macroeconomic forecasting. Our dedicated sector analysts deliver actionable, data-driven insights tailored for private equity, hedge funds, and corporate strategy teams. Visit us at http://www.hdinresearch.com.
2026 AI Transparency Footer:
This intelligence report was authored by HDIN Research analysts following a rigorous audit of official corporate filings. AI was utilized for massive-scale data synthesis and structural drafting, ensuring 100% inclusion of reported data points. All strategic insights, financial modeling, and final verdicts were verified by our editorial board to ensure professional accuracy and compliance with 2026 Google Search E-E-A-T standards.