Sai Life Sciences: Operational Realignment and High-Potency API Expansion Near Bidar and Hyderabad as Net Profit Surges 105.1% in FY 2025-26
Date : 2026-09-04
Reading : 95
HDIN Executive Takeaways
1. Consolidated net profit expanded 105.1% YoY to ₹3,489.10 million on ₹21,924.92 million in revenue, driven by 33% growth in the CDMO division and 508 bps of blended EBITDA margin expansion to 30.1%.
2. Complete IPO-driven term debt retirement of ₹7,200.00 million cut net debt to ₹159.73 million (0.024x net debt/EBITDA), unlocking balance sheet capacity for a planned ₹11,000–13,000 million FY 2026-27 capex program.
3. Commercial execution remains concentrated in international markets (99.44% export revenue share), anchored by 19 of the top 25 global pharmaceutical companies and a 1,400 kL greenfield buildout at Choutuppal.
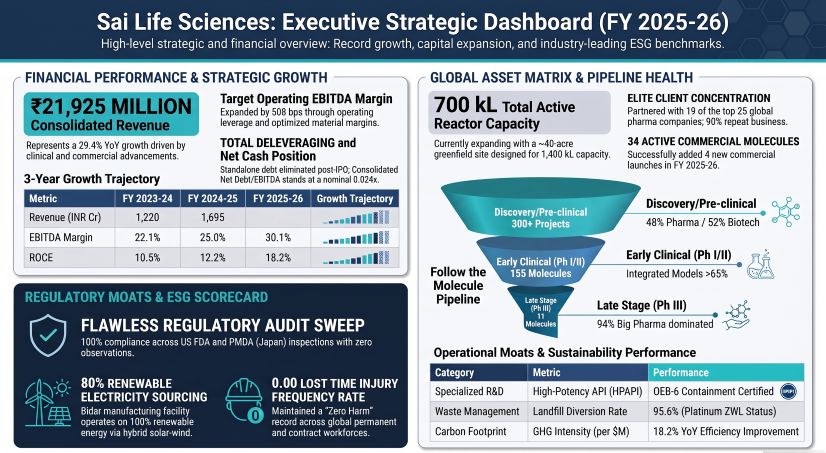
Figure Sai Life Sciences Executive Strategic Dashboard (FY 2025-26)
 Segmental Realities and Margin Expansion
Sai Life Sciences Limited [NSE/BSE: Not Disclosed / Private-to-Public CRDMO Transition] recorded consolidated operating revenue of ₹21,924.92 million ($231.18 million at ₹94.84/USD) for the fiscal year ended March 31, 2026, representing a 29.4% YoY increase from ₹16,950.00 million in FY 2024-25.
Statutory disaggregation of customer contract revenue reached ₹21,368.26 million, complemented by ₹556.66 million in other operating revenue (scrap/solvent recovery and incentives). Discovery Services (CRO) expanded 23.8% YoY to ₹7,753.51 million (35.4% of total revenue), up from ₹6,264.30 million. Technology and CMC Services (CDMO) increased 31.7% YoY to ₹13,614.75 million (62.1% of revenue), up from ₹10,339.70 million, driven by the addition of 4 commercial molecules to reach 34 active commercial-scale supply agreements.
Table CONSOLIDATED FINANCIAL PERFORMANCE BREAKDOWN (FY24 - FY26)
Operating leverage materialized across raw material procurement and workforce productivity. Raw material inputs and change in inventories accounted for 26.04% of revenue in FY 2025-26 versus 27.49% in FY 2024-25, expanding gross material margins by 145 bps to 73.96%. Operating personnel expenses fell 126 bps to 31.15% of revenue despite an 11.14% average salary increment for non-managerial staff.
Under Ind AS 115 revenue timing guidelines:
* Over-Time Recognition (FTE & Milestone Development): Contributed ₹12,107.88 million (56.7% of contract revenue).
* Point-in-Time Transfer (Commercial & Batch Shipments): Accounted for ₹9,260.38 million (43.3% of contract revenue).
Table WORKING CAPITAL & BALANCE SHEET LEVERAGE PROFILE
The conversion of OCF/PAT reached 145.9% (₹5,091.33 million OCF vs. ₹3,489.10 million PAT). Aggressive capacity buildout resulted in ₹5,929.61 million in total capital expenditures, yielding a negative unadjusted free cash flow of -₹838.28 million. Adjusted for maintenance requirements (using ₹1,668.55 million D&A as a proxy), underlying cash generation stood at ₹3,422.78 million (67.2% of OCF).
Infrastructure Layout and Regional Moats
Sai Life Sciences distributes operations across six global hubs comprising four R&D centers and two production campuses.
Table GLOBAL OPERATING ASSET ARCHITECTURE
The capital deployment audit indicates that ₹4,568.39 million of gross Property, Plant & Equipment additions took place during FY 2025-26, focused heavily on plant machinery (₹3,461.87 million) and freehold land purchases (₹368.82 million).
Capital Work-in-Progress (CWIP) closed at ₹2,704.53 million, with zero suspended projects and zero recorded cost overruns. Assets capitalized into the gross block totaled ₹4,572.56 million (365.2% of opening CWIP). Of the remaining CWIP, 92.39% (₹2,498.68 million) is under 12 months in project age, reflecting accelerated execution for the Choutuppal Unit VIII greenfield and Bidar Unit IV expansions.
Table CAPITAL WORK-IN-PROGRESS AGING PROFILE
Fixed Asset Turnover (FAT) stood at 1.429x on an ending Owned PPE basis (Net PPE: ₹15,344.14 million) and 1.212x when including Right-of-Use leased assets (Net ROU: ₹2,743.01 million). Standalone FAT was 1.454x, driven by core domestic manufacturing density relative to lower turnover generated at overseas marketing labs.
Customer concentration risks moderating: the largest single innovator represented 12.2% of consolidated turnover (₹2,674.75 million), down from 21.5% (₹3,638.84 million) in FY 2024-25. The company maintains zero retail distributor dependency, conducting 100% of commercial supply via direct B2B engagements across 19 of the top 25 global pharmaceutical corporations.
The pipeline contains 155 Phase I/II early clinical programs and 11 Phase III/pre-registration molecules. Cumulatively, 5 molecules have advanced from initial early-stage discovery discovery to commercial supply inside Sai Life's infrastructure.
Table ENVIRONMENTAL, HEALTH & SAFETY (EHS) AUDIT
HDIN Institutional Verdict
The operational and governance structure of Sai Life Sciences shows significant capital reallocation and pipeline maturity, though specific structural frictions require ongoing institutional monitoring:
* Capital Execution Risk on Greenfield Expansion: Management has guided FY 2026-27 capex to ₹11,000–13,000 million (a 100%+ YoY step-up over FY 2025-26 gross additions), with 75% targeted directly at new capacity, primarily the 1,400 kL Choutuppal site. While zero historical CWIP overruns were reported in FY 2025-26, completing 1,400 kL of reactor volume while concurrently building out complex peptide, ADC, and flow chemistry blocks introduces operational absorption and validation risks across FY27.
* Foreign Exchange Asymmetry: Consolidated contract revenues are 99.44% derived from exports, creating significant operational sensitivity to currency movements. Financial sensitivity modeling reveals that a 1% appreciation of the Indian Rupee against the USD reduces profit and equity by ₹29.54 million (against ₹2.84 million for the EUR and ₹2.43 million for the GBP). While treasury hedging increased to 187 outstanding USD/INR forward contracts covering $80.46 million (up from $42.89 million in FY25), this derivative position covers less than 40% of trailing annual USD export exposure.
* Pure CRDMO Operating Model Implication: Under Business Responsibility and Reporting Frameworks, the company discloses 0% internal R&D asset capitalization and zero proprietary drug patents. The absence of self-owned IP ensures client non-compete compliance, but it permanently ties revenue expansion to capacity utilization, batch execution, and innovator pipeline progression. Long-term margin retention depends entirely on preserving technical barriers in OEB-6 containment, flow chemistry, and peptide synthesis to avoid commoditization.
* Pending Tax Litigation: The company faces an unresolved tax dispute from the Kalaburagi GST authority demanding ₹366.84 million regarding Reverse Charge Mechanism applications on marketing support services from its US subsidiary. While management has appealed and provisioned ₹69.75 million against interest exposure, an adverse final order would represent an immediate cash outflow equivalent to 2.0% of FY 2025-26 operating profit.
Presentation Download & Video Access:
- Presentation Download: Click the PDF download link under 'Related Topics' to access the full institutional presentation of this report.
- Video Link: Click this link to watch the HDIN analyst briefing on YouTube.
About HDIN Research:
HDIN Research is a premier global market intelligence and strategic advisory firm specializing in institutional-grade financial analysis, supply chain audits, and macroeconomic forecasting. Our dedicated sector analysts deliver actionable, data-driven insights tailored for private equity, hedge funds, and corporate strategy teams. Visit us at http://www.hdinresearch.com.
2026 AI Transparency Footer:
"This intelligence report was authored by HDIN Research analysts following a rigorous audit of official corporate filings. AI was utilized for massive-scale data synthesis and structural drafting, ensuring 100% inclusion of reported data points. All strategic insights, financial modeling, and final verdicts were verified by our editorial board to ensure professional accuracy and compliance with 2026 Google Search E-E-A-T standards."
1. Consolidated net profit expanded 105.1% YoY to ₹3,489.10 million on ₹21,924.92 million in revenue, driven by 33% growth in the CDMO division and 508 bps of blended EBITDA margin expansion to 30.1%.
2. Complete IPO-driven term debt retirement of ₹7,200.00 million cut net debt to ₹159.73 million (0.024x net debt/EBITDA), unlocking balance sheet capacity for a planned ₹11,000–13,000 million FY 2026-27 capex program.
3. Commercial execution remains concentrated in international markets (99.44% export revenue share), anchored by 19 of the top 25 global pharmaceutical companies and a 1,400 kL greenfield buildout at Choutuppal.
Figure Sai Life Sciences Executive Strategic Dashboard (FY 2025-26)
Segmental Realities and Margin ExpansionSai Life Sciences Limited [NSE/BSE: Not Disclosed / Private-to-Public CRDMO Transition] recorded consolidated operating revenue of ₹21,924.92 million ($231.18 million at ₹94.84/USD) for the fiscal year ended March 31, 2026, representing a 29.4% YoY increase from ₹16,950.00 million in FY 2024-25.
Statutory disaggregation of customer contract revenue reached ₹21,368.26 million, complemented by ₹556.66 million in other operating revenue (scrap/solvent recovery and incentives). Discovery Services (CRO) expanded 23.8% YoY to ₹7,753.51 million (35.4% of total revenue), up from ₹6,264.30 million. Technology and CMC Services (CDMO) increased 31.7% YoY to ₹13,614.75 million (62.1% of revenue), up from ₹10,339.70 million, driven by the addition of 4 commercial molecules to reach 34 active commercial-scale supply agreements.
Table CONSOLIDATED FINANCIAL PERFORMANCE BREAKDOWN (FY24 - FY26)
| Metric (INR Millions) | FY2023–24 | FY2024–25 | FY2025–26 |
|---|---|---|---|
| Revenue from Operations | 14,651.20 | 16,950.00 | 21,924.92 |
| Cost of Materials Consumed & WIP | 4,120.50 | 4,659.55 | 5,709.25 |
| Material Margin (%) | 71.88% | 72.51% | 73.96% |
| Employee Benefit Expenses | 4,821.10 | 5,493.50 | 6,830.55 |
| Employee Cost as % of Revenue | 32.91% | 32.41% | 31.15% |
| Other Operating Expenses | 2,410.80 | 2,546.95 | 3,073.86 |
| Operational EBITDA | 3,298.80 | 4,250.00 | 6,610.00 |
| Operational EBITDA Margin (%) | 22.52% | 25.07% | 30.15% |
| Statutory EBITDA | 3,612.40 | 4,700.00 | 6,802.87 |
| Depreciation & Amortization (D&A) | 1,180.20 | 1,385.60 | 1,668.55 |
| Operating EBIT | 2,118.60 | 3,037.40 | 5,134.32 |
| Finance Costs | 1,021.40 | 567.80 | 124.47 |
| Profit After Tax (PAT) | 1,020.10 | 1,700.00 | 3,489.10 |
| PAT Margin (%) | 6.96% | 10.03% | 15.91% |
Operating leverage materialized across raw material procurement and workforce productivity. Raw material inputs and change in inventories accounted for 26.04% of revenue in FY 2025-26 versus 27.49% in FY 2024-25, expanding gross material margins by 145 bps to 73.96%. Operating personnel expenses fell 126 bps to 31.15% of revenue despite an 11.14% average salary increment for non-managerial staff.
Under Ind AS 115 revenue timing guidelines:
* Over-Time Recognition (FTE & Milestone Development): Contributed ₹12,107.88 million (56.7% of contract revenue).
* Point-in-Time Transfer (Commercial & Batch Shipments): Accounted for ₹9,260.38 million (43.3% of contract revenue).
Table WORKING CAPITAL & BALANCE SHEET LEVERAGE PROFILE
| Balance Sheet & Cash Flow Metric | FY2023–24 | FY2024–25 | FY2025–26 |
|---|---|---|---|
| Days Sales Outstanding (DSO – Consolidated) | 74.2 days | 68.0 days | 61.9 days |
| Days Inventory Outstanding (DIO) | 96.5 days | 91.2 days | 87.3 days |
| Days Payable Outstanding (DPO) | 142.1 days | 158.0 days | 120.0 days |
| Net Cash Conversion Cycle (NCCC) | 28.6 days | 39.4 days | 23.9 days |
| Operating Cash Flow (OCF, INR M) | 2,410.20 | 3,890.10 | 5,091.33 |
| Capital Expenditure (Gross, INR M) | 3,120.00 | 4,210.00 | 5,929.61 |
| Free Cash Flow (FCF, INR M) | (709.80) | (319.90) | (838.28) |
| Adjusted Maintenance FCF (INR M) | 1,230.00 | 2,504.50 | 3,422.78 |
| Total Net Debt (INR Millions) | 9,140.20 | 7,359.88 | 159.73 |
| Net Debt / Operational EBITDA | 2.77× | 1.73× | 0.024× |
| Return on Capital Employed (ROCE) | 9.8% | 12.2% | 18.2% |
| Return on Equity (ROE – Consolidated) | 5.2% | 8.0% | 14.0% |
The conversion of OCF/PAT reached 145.9% (₹5,091.33 million OCF vs. ₹3,489.10 million PAT). Aggressive capacity buildout resulted in ₹5,929.61 million in total capital expenditures, yielding a negative unadjusted free cash flow of -₹838.28 million. Adjusted for maintenance requirements (using ₹1,668.55 million D&A as a proxy), underlying cash generation stood at ₹3,422.78 million (67.2% of OCF).
Infrastructure Layout and Regional Moats
Sai Life Sciences distributes operations across six global hubs comprising four R&D centers and two production campuses.
Table GLOBAL OPERATING ASSET ARCHITECTURE
| Facility & Location | Category | Capacity / Scale | Regulatory & Technology Moat |
|---|---|---|---|
| Genome Valley Unit II (Hyderabad) | R&D / Discovery Campus | 83,000 sq. ft. (New R&T Center) | OEB-6 Containment, ADCs, High-Throughput Biology |
| Bidar, Karnataka Units IV & VI | Active Commercial CDMO Facility | 700 kL Total Installed Volume | USFDA and PMDA Japan Cleared; 100% Renewable Energy; Zero-Liquid-Discharge (ZLD) Water |
| Alderley Park, Manchester (UK) | Process Chemistry & R&D Facility | GMP Kilo Lab Operational Hub | Continuous Route Development; Integrated CHP Energy |
| Cambridge-Boston, Massachusetts (USA) | Discovery Biology Laboratory Hub | Innovation Center / Ecosystem Base | Proximity to Client In-Vitro Assays; IDD Lead Screening |
| IDA Bollaram Unit III (Hyderabad) | Chemical Intermediates Manufacturing Site | Multi-Purpose Industrial Plant | Regulatory-Backlog API Intermediates Processing |
| Choutuppal Unit VIII, Telangana (India) | Greenfield CDMO — Under Construction | ~40 Acres / 1,400 kL Planned Capacity | Advanced Flow Chemistry & Automated High-Volume API Manufacturing |
The capital deployment audit indicates that ₹4,568.39 million of gross Property, Plant & Equipment additions took place during FY 2025-26, focused heavily on plant machinery (₹3,461.87 million) and freehold land purchases (₹368.82 million).
Capital Work-in-Progress (CWIP) closed at ₹2,704.53 million, with zero suspended projects and zero recorded cost overruns. Assets capitalized into the gross block totaled ₹4,572.56 million (365.2% of opening CWIP). Of the remaining CWIP, 92.39% (₹2,498.68 million) is under 12 months in project age, reflecting accelerated execution for the Choutuppal Unit VIII greenfield and Bidar Unit IV expansions.
Table CAPITAL WORK-IN-PROGRESS AGING PROFILE
| CWIP Aging Segment (INR Millions) | < 1 Year | 1–2 Years | 2–3 Years | > 3 Years |
|---|---|---|---|---|
| Gross CWIP Balance | 2,498.68 | 205.85 | 0.00 | 0.00 |
| Percentage of Total CWIP | 92.39% | 7.61% | 0.00% | 0.00% |
Fixed Asset Turnover (FAT) stood at 1.429x on an ending Owned PPE basis (Net PPE: ₹15,344.14 million) and 1.212x when including Right-of-Use leased assets (Net ROU: ₹2,743.01 million). Standalone FAT was 1.454x, driven by core domestic manufacturing density relative to lower turnover generated at overseas marketing labs.
Customer concentration risks moderating: the largest single innovator represented 12.2% of consolidated turnover (₹2,674.75 million), down from 21.5% (₹3,638.84 million) in FY 2024-25. The company maintains zero retail distributor dependency, conducting 100% of commercial supply via direct B2B engagements across 19 of the top 25 global pharmaceutical corporations.
The pipeline contains 155 Phase I/II early clinical programs and 11 Phase III/pre-registration molecules. Cumulatively, 5 molecules have advanced from initial early-stage discovery discovery to commercial supply inside Sai Life's infrastructure.
Table ENVIRONMENTAL, HEALTH & SAFETY (EHS) AUDIT
| Sustainability & Regulatory Parameter | FY2024–25 | FY2025–26 | YoY Movement |
|---|---|---|---|
| Scope 1 Emissions (tCO₂e) | 18,435 | 22,445 | +21.7% |
| Scope 2 Emissions (Market-Based, tCO₂e) | 15,638 | 8,630 | -44.8% |
| Scope 3 Value Chain Emissions (tCO₂e) | 83,606 | 90,272 | +8.0% |
| Carbon Intensity (tCO₂e / $M Revenue) | 170 | 139 | -18.2% |
| Renewable Grid Share (%) | 76.5% | 80.3% | +380 bps |
| Blended Energy (Fuel + Power) Renewable Share (%) | 30.0% | 47.0% | +1,700 bps |
| Absolute Energy Consumption (GJ) | 315,631 | 385,999 | +22.3% |
| Water Recycling Efficiency (%) | 38.0% | 43.0% | +500 bps |
| Waste Landfill Diversion Rate (%) | 92.1% | 95.6% | +350 bps |
| Lost Time Injury Frequency Rate (LTIFR) | 0.00 | 0.00 | Stable |
| FDA / PMDA Inspection Clears | 5 facilities | 2 audits | 100% Pass |
| USFDA Form 483 / Warning Letters | 0 | 0 | Zero |
HDIN Institutional Verdict
The operational and governance structure of Sai Life Sciences shows significant capital reallocation and pipeline maturity, though specific structural frictions require ongoing institutional monitoring:
* Capital Execution Risk on Greenfield Expansion: Management has guided FY 2026-27 capex to ₹11,000–13,000 million (a 100%+ YoY step-up over FY 2025-26 gross additions), with 75% targeted directly at new capacity, primarily the 1,400 kL Choutuppal site. While zero historical CWIP overruns were reported in FY 2025-26, completing 1,400 kL of reactor volume while concurrently building out complex peptide, ADC, and flow chemistry blocks introduces operational absorption and validation risks across FY27.
* Foreign Exchange Asymmetry: Consolidated contract revenues are 99.44% derived from exports, creating significant operational sensitivity to currency movements. Financial sensitivity modeling reveals that a 1% appreciation of the Indian Rupee against the USD reduces profit and equity by ₹29.54 million (against ₹2.84 million for the EUR and ₹2.43 million for the GBP). While treasury hedging increased to 187 outstanding USD/INR forward contracts covering $80.46 million (up from $42.89 million in FY25), this derivative position covers less than 40% of trailing annual USD export exposure.
* Pure CRDMO Operating Model Implication: Under Business Responsibility and Reporting Frameworks, the company discloses 0% internal R&D asset capitalization and zero proprietary drug patents. The absence of self-owned IP ensures client non-compete compliance, but it permanently ties revenue expansion to capacity utilization, batch execution, and innovator pipeline progression. Long-term margin retention depends entirely on preserving technical barriers in OEB-6 containment, flow chemistry, and peptide synthesis to avoid commoditization.
* Pending Tax Litigation: The company faces an unresolved tax dispute from the Kalaburagi GST authority demanding ₹366.84 million regarding Reverse Charge Mechanism applications on marketing support services from its US subsidiary. While management has appealed and provisioned ₹69.75 million against interest exposure, an adverse final order would represent an immediate cash outflow equivalent to 2.0% of FY 2025-26 operating profit.
Presentation Download & Video Access:
- Presentation Download: Click the PDF download link under 'Related Topics' to access the full institutional presentation of this report.
- Video Link: Click this link to watch the HDIN analyst briefing on YouTube.
About HDIN Research:
HDIN Research is a premier global market intelligence and strategic advisory firm specializing in institutional-grade financial analysis, supply chain audits, and macroeconomic forecasting. Our dedicated sector analysts deliver actionable, data-driven insights tailored for private equity, hedge funds, and corporate strategy teams. Visit us at http://www.hdinresearch.com.
2026 AI Transparency Footer:
"This intelligence report was authored by HDIN Research analysts following a rigorous audit of official corporate filings. AI was utilized for massive-scale data synthesis and structural drafting, ensuring 100% inclusion of reported data points. All strategic insights, financial modeling, and final verdicts were verified by our editorial board to ensure professional accuracy and compliance with 2026 Google Search E-E-A-T standards."