Radiopharmaceutical Sector 2026 Outlook: Why Novartis AG, Lantheus Holdings, Inc., and Telix Pharmaceuticals Limited Diverge on Capital Allocation Amid CMS Reimbursement and Upstream Isotope Constraints
Date : 2026-09-02
Reading : 469
HDIN Executive Takeaways
1. Divergent Commercial Margins: Novartis AG maintains a 77.42% gross margin by scaling therapeutic radioligands, while Lantheus Holdings, Inc. faces price compression under U.S. Centers for Medicare & Medicaid Services (CMS) Mean Unit Cost (MUC) rules, and Telix Pharmaceuticals Limited records 54.54% gross margins due to low-margin distribution dilution.
2. Geopolitical and Supply Fragility: Western non-carrier-added Lutetium-177 manufacturing remains vulnerable to Russian centrifuge supplies of Ytterbium-176 precursor targets, driving Telix and Novartis to build redundant regional manufacturing hubs across North America, Europe, and Asia-Pacific.
3. Balance Sheet Resilience: Lantheus holds a net-cash position of -$21.84 million with zero net debt, whereas Telix restructured its debt maturity wall to 2031 via a $600.00 million convertible note issue, and Novartis deployed $17.40 billion in debt to fund platform acquisitions.
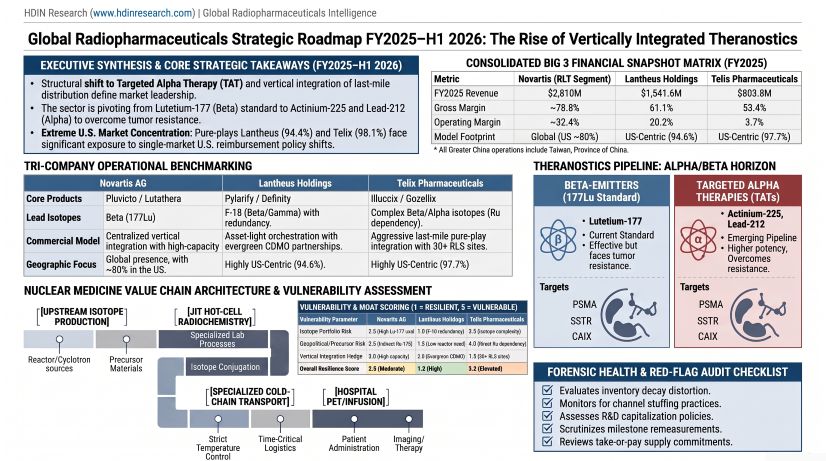
Figure Global Radiopharaceuticals Strategic Roadmap FY2025-H1 2026: The Rise of Vertically Intearated Theranostics
Segmental Realities, Margin Disruption, and Reimbursement Squeeze
The financial architecture of the radiopharmaceutical sector across fiscal year 2025 (FY2025) and the first half of 2026 (H1 2026) demonstrates structural divergence among its three core operators: Novartis AG [NYSE: NVS], Lantheus Holdings, Inc. [NASDAQ: LNTH], and Telix Pharmaceuticals Limited [NASDAQ: TLX / ASX: TLX].
Table CONSOLIDATED REVENUE & MARGIN MIX
Table PRODUCT & SEGMENT REVENUE DISAGGREGATION
Table GEOGRAPHIC REVENUE ARCHITECTURE (FY2025)
Table GEOGRAPHIC REVENUE ARCHITECTURE (H1 2026)
Under United Nations cartographic and reporting frameworks, Greater China operations are categorized under a One-China framework, designating business units in Mainland China alongside Taiwan, Province of China. Novartis AG executed direct distribution via Beijing Novartis and Novartis (Taiwan) Co., Ltd. Lantheus Holdings, Inc. licensed Neuraceq across Mainland China and Taiwan, Province of China, while accruing a $30.00 million Selling, General, and Administrative (SG&A) settlement liability in H1 2026 to repurchase the DEFINITY distribution license in China for direct commercialization. Telix Pharmaceuticals Limited recognized $9.83 million in China Grand Pharma milestone amortization in FY2025 ($nil in H1 2026) while Illuccix remains under National Medical Products Administration (NMPA) regulatory review.
U.S. CMS outpatient reimbursement mechanisms represent the primary operational determinant of diagnostic margins:
* Lantheus Holdings, Inc. experienced net price realization compression on PYLARIFY following the December 31, 2024 expiration of its Transitional Pass-Through (TPT) status. Under CMS Hospital Outpatient Prospective Payment System (HOPPS) rules, diagnostic radiopharmaceuticals exceeding daily thresholds ($630 in 2025; $655 in 2026) transitioned to retrospective Mean Unit Cost (MUC) reimbursement rather than Average Sales Price (ASP) plus 6%, lowering realized net unit receipts. To re-establish ASP-based reimbursement, Lantheus secured U.S. Food and Drug Administration (FDA) approval for PYLARIFY TruVu on March 6, 2026, and secured an HCPCS code effective October 1, 2026, targeting a Q4 2026 launch with 36 months of TPT eligibility.
* Telix Pharmaceuticals Limited mitigated post-TPT MUC compression on Illuccix by launching Gozellix in June 2025 with active CMS TPT status granted effective October 1, 2025, locking in ASP plus 6% pricing through late 2028.
* Novartis AG operates exclusively within the therapeutic domain (100% of RLT revenue), where Pluvicto and Lutathera are exempt from outpatient diagnostic bundling or MUC payment caps, maintaining separate ASP-based therapeutic reimbursement.
Table CAPITAL EFFICIENCY & OPERATING DISCLOSURES
Telix Pharmaceuticals Limited's consolidated gross margin compressed from 65.00% in FY2024 to 53.44% in FY2025 and 54.54% in H1 2026. This margin erosion reflects the consolidation of RLS (USA) Inc., whose third-party radiopharmacy distribution operations generated an 8.82% gross margin ($7.83 million gross profit on $88.72 million revenue in H1 2026), offsetting the 65.36% gross margin delivered by its core Precision Medicine diagnostic segment ($254.03 million gross profit on $388.63 million revenue).
Infrastructure Moats, Upstream Reactor Dependencies, and Logistics Architecture
The targeted theranostics sector operates under physical constraints dictated by radioactive decay, precluding conventional finished-goods warehousing.
Table RADIONUCLIDE PHYSICAL DECAY & LOGISTICS SLAS
Table GLOBAL MANUFACTURING & INFRASTRUCTURE FOOTPRINT
Supply chain vulnerabilities center on upstream raw isotope sourcing:
* Russian Precursor Exposure: Non-carrier-added (n.c.a.) Lutetium-177 requires enriched Ytterbium-176 (176Yb) targets (>99% isotopic purity), which are predominantly produced by Russian state-owned centrifuge facilities (Rosatom/Tenex). While procured under medical trade exemptions, any revocation of sanctions waivers presents supply risks for Telix and Novartis. Telix explicitly discloses material raw material exposure to Russian starting target precursors.
* Research Reactor Dependencies: Carrier-added and n.c.a. Lutetium-177 irradiation relies on a limited fleet of global research reactors, including HFR Petten (Netherlands), BR2 (Belgium), Safari-1 (South Africa), and ANSTO (Australia). Unscheduled reactor maintenance shutdowns create immediate supply-chain disruptions.
* De-risking via SPECT Divestiture: Lantheus eliminated its operational reliance on nuclear research reactors on January 1, 2026, by completing the sale of its legacy Molybdenum-99 SPECT business to SHINE Technologies for $131.20 million in total consideration ($32.10 million upfront cash, a $70.00 million installment note, and $20.00 million deferred cash). The transaction derecognized $49.20 million in Billerica plant assets and transferred $17.45 million in Asset Retirement Obligations (AROs) to SHINE, lowering Lantheus's balance sheet ARO liability from $23.34 million to $138,000, backed by a $30.30 million Massachusetts surety bond.
* Vertical Supply Integration: Telix deployed $40.00 million in cumulative infrastructure capital expenditures across FY2025 and H1 2026, validating its Brussels South facility with its first GMP production run of a Lutetium-177 therapeutic candidate in H1 2026, while scaling the ARTMS QUANTM Irradiation System (QIS) across Yokohama and the RLS network to produce Gallium-68 and Zirconium-89 directly on cyclotrons.
Table THERANOSTIC PIPELINE & REGULATORY STATUS
Telix Pharmaceuticals Limited's BLA for Zircaix (TLX250-Px) received a Complete Response Letter (CRL) in August 2025 regarding Chemistry, Manufacturing, and Controls (CMC) comparability protocols and Form 483 notices across two contract sites. Following Type A alignment, Telix received a corrected CRL on April 10, 2026, granting an extension to finalize comparability dossiers prior to BLA resubmission. Telix capitalized $14.10 million in Zircaix pre-launch inventory in FY2025 alongside a $16.86 million obsolescence reserve.
In the targeted alpha space, Novartis advanced AAA817 into the Phase III AcTION trial with target regulatory filings planned for 2028 and 2029+, while Lantheus recognized a -$31.76 million fair-value adjustment to contingent consideration liabilities in H1 2026 following a June 26, 2026 CRL for LNTH-2501 and the cessation of internal R&D allocations for PNT2002.
HDIN Institutional Verdict and Balance Sheet Quality Audit
A forensic evaluation of capital structures and accrual metrics highlights three distinct financial profiles across the peer group:
Table BALANCE SHEET & SOLVENCY AUDIT MATRIX (H1 2026)
Lantheus Holdings, Inc. presents high near-term liquidity with a 3.06x Current Ratio and negative net debt. However, its earnings quality requires scrutiny: H1 2026 net profit of $193.45 million includes an inorganic, non-operating $59.53 million gain on the SPECT business sale and a $31.76 million non-cash credit from reducing contingent acquisition liabilities. Operating cash flow of $217.33 million generated an OCF-to-Net Income ratio of 1.12x. The pending expiration of PYLARIFY's 5-year New Chemical Entity (NCE) exclusivity in May 2026 exposes the franchise to Paragraph IV ANDA filings, underpinning management's decision to enter a definitive merger agreement with Curium (announced August 3, 2026). Lantheus faces a refinancing milestone in December 2027, when its $575.00 million, 2.625% convertible notes mature, requiring cash settlement if the equity trades below the $79.81 conversion threshold.
Telix Pharmaceuticals Limited transitioned to a positive GAAP Net Profit of $38.33 million in H1 2026, though operating cash flow stood at $23.04 million (OCF-to-Net Income of 0.60x), weighed down by a $34.35 million expansion in trade receivables. In April 2026, Telix restructured its liabilities by issuing $600.00 million of 1.50% convertible notes due April 22, 2031, repurchasing 98% (A$637 million / $466.45 million) of its 2.375% 2029 notes to secure $118.43 million in net cash inflows and eliminate near-term refinancing exposure. Asset-quality concentration remains high, with goodwill and unamortized intangibles ($782.12 million) constituting 57.43% of total assets, leaving the balance sheet sensitive to clinical trial endpoints. To maintain liquidity against annualized R&D guidance of $230 million to $270 million, Telix established an At-The-Market (ATM) equity facility on the Nasdaq on August 20, 2026, following a $40.00 million non-refundable upfront payment received under its 50/50 co-development collaboration with Regeneron in April 2026.
Novartis AG operates a sovereign-grade funding profile (Aa3/AA-), maintaining $7.69 billion in total liquidity, $10.00 billion in commercial paper access, and an undrawn $6.00 billion credit line against $39.40 billion in net debt. Net Debt-to-EBITDA increased to 1.70x in H1 2026 after issuing $12.90 billion in straight debt to finance acquisitions, including Avidity Biosciences ($12.00 billion cash; $72.00/share), Pikavation Therapeutics ($1.80 billion upfront; $1.20 billion milestones), Tourmaline Bio ($1.40 billion upfront), Mariana Oncology ($1.04 billion upfront), and Myricx Bio ($1.10 billion upfront; $400.00 million milestones). With high cash conversion (1.49x OCF-to-Net Income) and Pluvicto expanding post-taxane and pre-taxane indications, Novartis maintains substantial balance sheet capacity to absorb Lutathera generic litigation while advancing its therapeutic-only theranostics pipeline.
Presentation Download & Video Access:
Presentation Download: Click the PDF download link under 'Related Topics' to access the full institutional presentation of this report.
Video Link: Click this link to watch the HDIN analyst briefing on YouTube.
About HDIN Research:
HDIN Research is a premier global market intelligence and strategic advisory firm specializing in institutional-grade financial analysis, supply chain audits, and macroeconomic forecasting. Our dedicated sector analysts deliver actionable, data-driven insights tailored for private equity, hedge funds, and corporate strategy teams. Visit us at http://www.hdinresearch.com.
2026 AI Transparency Footer:
"This intelligence report was authored by HDIN Research analysts following a rigorous audit of official corporate filings. AI was utilized for massive-scale data synthesis and structural drafting, ensuring 100% inclusion of reported data points. All strategic insights, financial modeling, and final verdicts were verified by our editorial board to ensure professional accuracy and compliance with 2026 Google Search E-E-A-T standards."
1. Divergent Commercial Margins: Novartis AG maintains a 77.42% gross margin by scaling therapeutic radioligands, while Lantheus Holdings, Inc. faces price compression under U.S. Centers for Medicare & Medicaid Services (CMS) Mean Unit Cost (MUC) rules, and Telix Pharmaceuticals Limited records 54.54% gross margins due to low-margin distribution dilution.
2. Geopolitical and Supply Fragility: Western non-carrier-added Lutetium-177 manufacturing remains vulnerable to Russian centrifuge supplies of Ytterbium-176 precursor targets, driving Telix and Novartis to build redundant regional manufacturing hubs across North America, Europe, and Asia-Pacific.
3. Balance Sheet Resilience: Lantheus holds a net-cash position of -$21.84 million with zero net debt, whereas Telix restructured its debt maturity wall to 2031 via a $600.00 million convertible note issue, and Novartis deployed $17.40 billion in debt to fund platform acquisitions.
Figure Global Radiopharaceuticals Strategic Roadmap FY2025-H1 2026: The Rise of Vertically Intearated Theranostics
Segmental Realities, Margin Disruption, and Reimbursement Squeeze
The financial architecture of the radiopharmaceutical sector across fiscal year 2025 (FY2025) and the first half of 2026 (H1 2026) demonstrates structural divergence among its three core operators: Novartis AG [NYSE: NVS], Lantheus Holdings, Inc. [NASDAQ: LNTH], and Telix Pharmaceuticals Limited [NASDAQ: TLX / ASX: TLX].
Table CONSOLIDATED REVENUE & MARGIN MIX
| Company | FY2025 Revenue | FY2025 Gross Margin | FY2025 Operating Margin | H1 2026 Revenue | H1 2026 Gross Margin | H1 2026 Operating Margin |
|---|---|---|---|---|---|---|
| Novartis AG | $54,532.00M | 78.81% | 32.36% | $27,521.00M | 77.42% | 32.65% |
| Lantheus Holdings, Inc. | $1,541.61M | 61.10% | 20.16% | $765.51M | 61.76% | 23.71% |
| Telix Pharmaceuticals Limited | $803.79M | 53.44% | 3.70% | $477.35M | 54.54% | 9.71% |
Table PRODUCT & SEGMENT REVENUE DISAGGREGATION
| Company / Product Segment | FY2025 Net Sales | H1 2026 Net Sales |
|---|---|---|
| Novartis AG – RLT Platform | $2,810.00M | $1,729.00M |
| — Pluvicto (¹⁷⁷Lu-PSMA-617) | $1,994.00M (+43% YoY) | $1,293.00M (+57% YoY) |
| — Lutathera (¹⁷⁷Lu-oxodotreotide) | $816.00M (+13% YoY) | $436.00M (+9% YoY) |
| Lantheus Holdings, Inc. | $1,541.61M | $765.51M |
| — PYLARIFY (¹⁸F-DCFPyL) | $989.12M (−6.5% YoY) | $481.29M (−5.3% YoY) |
| — DEFINITY (Ultrasound Agent) | $330.25M (+3.9% YoY) | $172.91M (+6.0% YoY) |
| — Neuraceq (¹⁸F-florbetaben) | $51.45M | $75.06M |
| — SPECT (TechneLite Mo-99) | $86.80M | $nil (Divested) |
| Telix Pharmaceuticals Limited | $803.79M | $477.35M |
| — Precision Medicine (Diagnostics) | $621.93M (+22% YoY) | $388.63M (+27% YoY) |
| — Manufacturing Solutions (RLS) | $172.59M | $88.72M (+10% YoY) |
| — Therapeutics (Licensing) | $9.27M | $nil |
Table GEOGRAPHIC REVENUE ARCHITECTURE (FY2025)
| Region | Novartis (RLT) | Lantheus Holdings | Telix Pharmaceuticals |
|---|---|---|---|
| North America | $2,558.00M (91.03%) | $1,458.88M (94.63%) | $784.91M (97.65%) |
| Europe | ~$190.00M (6.76%) | ~$50.00M (3.24%) | ~$7.50M (0.93%) |
| Asia-Pacific | ~$52.00M (1.85%) | ~$22.00M (1.43%) | $11.38M (1.42%) |
| Rest of World | ~$10.00M (0.36%) | ~$10.73M (0.70%) | $0.00M (0.00%) |
| Total Segment Revenue | $2,810.00M | $1,541.61M | $803.79M |
Table GEOGRAPHIC REVENUE ARCHITECTURE (H1 2026)
| Region | Novartis (RLT) | Lantheus Holdings | Telix Pharmaceuticals |
|---|---|---|---|
| North America | $1,313.00M (75.94%) | $722.72M (94.41%) | $468.07M (98.06%) |
| Europe | ~$320.00M (18.51%) | ~$28.00M (3.66%) | ~$7.50M (1.57%) |
| Asia-Pacific | ~$85.00M (4.92%) | ~$11.00M (1.44%) | $1.78M (0.37%) |
| Rest of World | ~$11.00M (0.64%) | ~$3.79M (0.49%) | $0.00M (0.00%) |
| Total Segment Revenue | $1,729.00M | $765.51M | $477.35M |
Under United Nations cartographic and reporting frameworks, Greater China operations are categorized under a One-China framework, designating business units in Mainland China alongside Taiwan, Province of China. Novartis AG executed direct distribution via Beijing Novartis and Novartis (Taiwan) Co., Ltd. Lantheus Holdings, Inc. licensed Neuraceq across Mainland China and Taiwan, Province of China, while accruing a $30.00 million Selling, General, and Administrative (SG&A) settlement liability in H1 2026 to repurchase the DEFINITY distribution license in China for direct commercialization. Telix Pharmaceuticals Limited recognized $9.83 million in China Grand Pharma milestone amortization in FY2025 ($nil in H1 2026) while Illuccix remains under National Medical Products Administration (NMPA) regulatory review.
U.S. CMS outpatient reimbursement mechanisms represent the primary operational determinant of diagnostic margins:
* Lantheus Holdings, Inc. experienced net price realization compression on PYLARIFY following the December 31, 2024 expiration of its Transitional Pass-Through (TPT) status. Under CMS Hospital Outpatient Prospective Payment System (HOPPS) rules, diagnostic radiopharmaceuticals exceeding daily thresholds ($630 in 2025; $655 in 2026) transitioned to retrospective Mean Unit Cost (MUC) reimbursement rather than Average Sales Price (ASP) plus 6%, lowering realized net unit receipts. To re-establish ASP-based reimbursement, Lantheus secured U.S. Food and Drug Administration (FDA) approval for PYLARIFY TruVu on March 6, 2026, and secured an HCPCS code effective October 1, 2026, targeting a Q4 2026 launch with 36 months of TPT eligibility.
* Telix Pharmaceuticals Limited mitigated post-TPT MUC compression on Illuccix by launching Gozellix in June 2025 with active CMS TPT status granted effective October 1, 2025, locking in ASP plus 6% pricing through late 2028.
* Novartis AG operates exclusively within the therapeutic domain (100% of RLT revenue), where Pluvicto and Lutathera are exempt from outpatient diagnostic bundling or MUC payment caps, maintaining separate ASP-based therapeutic reimbursement.
Table CAPITAL EFFICIENCY & OPERATING DISCLOSURES
| Company / Operating Parameter | FY2025 Disclosure | H1 2026 Disclosure |
|---|---|---|
| Novartis AG | ||
| Operating Cash Flow (OCF) | $19,144.00M | $9,558.00M |
| Free Cash Flow (FCF) | $17,596.00M | $8,891.00M |
| R&D Expense (% of Revenue) | $11,200.00M (20.54%) | $5,587.00M (20.30%) |
| SG&A Expense (% of Revenue) | $13,248.00M (24.30%) | $6,381.00M (23.19%) |
| DSO / DIO / DPO | 59.8d / 167.0d / 118.7d | 63.4d / 157.0d / 107.5d |
| Total Workforce Headcount | 75,267 FTEs | Not Disclosed |
| Revenue per Employee | $0.72M | Not Disclosed |
| Lantheus Holdings, Inc. | ||
| Operating Cash Flow (OCF) | $390.14M | $217.33M |
| Free Cash Flow (FCF) | $354.05M | $211.77M |
| R&D Expense (% of Revenue) | $177.31M (11.50%) | $77.58M (10.13%) |
| SG&A Expense (% of Revenue) | $453.81M (29.44%) | $213.66M (27.91%) |
| DSO / DIO / DPO | 84.9d / 39.4d / 26.1d | 83.4d / 35.6d / 29.7d |
| Total Workforce Headcount | 1,193 FTEs | Not Disclosed |
| Revenue per Employee | $1.29M | Not Disclosed |
| Telix Pharmaceuticals Limited | ||
| Operating Cash Flow (OCF) | $(17.29)M | $23.04M |
| Free Cash Flow (FCF) | $(42.98)M | $8.58M |
| R&D Expense (% of Revenue) | $171.25M (21.31%) | $123.83M (25.94%) |
| SG&A Expense (% of Revenue) | $104.70M (13.03%) | $107.02M (22.42%) |
| DSO / DIO / DPO | 58.7d / 35.9d / 145.4d | 62.0d / 32.6d / 140.9d |
| Total Workforce Headcount | 1,184 FTEs | Not Disclosed |
| Revenue per Employee | $0.68M | Not Disclosed |
Telix Pharmaceuticals Limited's consolidated gross margin compressed from 65.00% in FY2024 to 53.44% in FY2025 and 54.54% in H1 2026. This margin erosion reflects the consolidation of RLS (USA) Inc., whose third-party radiopharmacy distribution operations generated an 8.82% gross margin ($7.83 million gross profit on $88.72 million revenue in H1 2026), offsetting the 65.36% gross margin delivered by its core Precision Medicine diagnostic segment ($254.03 million gross profit on $388.63 million revenue).
Infrastructure Moats, Upstream Reactor Dependencies, and Logistics Architecture
The targeted theranostics sector operates under physical constraints dictated by radioactive decay, precluding conventional finished-goods warehousing.
Table RADIONUCLIDE PHYSICAL DECAY & LOGISTICS SLAS
| Radionuclide | Half-Life | Modality Class | Distribution Radius / Logistics SLA |
|---|---|---|---|
| Gallium-68 (Ga-68) | 68 minutes | Diagnostic (PET) | <1.5 hours transit / QIS |
| Fluorine-18 (F-18) | 110 minutes | Diagnostic (PET) | Same-day local transit |
| Samarium-153 (Sm-153) | 46 hours | Therapeutic | 24–48-hour dispatch |
| Zirconium-89 (Zr-89) | 78.4 hours | Diagnostic (PET) | Multi-day bio-imaging |
| Lutetium-177 (Lu-177) | 6.7 days | Therapeutic | Centralized hub export |
| Actinium-225 (Ac-225) | 9.9 days | Alpha Therapy | Global centralized hub |
Table GLOBAL MANUFACTURING & INFRASTRUCTURE FOOTPRINT
| Operating Entity & Site | Facility Size | Operational Role |
|---|---|---|
| Novartis AG | ||
| Indianapolis, Indiana, US | 8,230 sqm (88,586 sq ft) | Centralized US/Canada operations |
| Ivrea, Italy | 4,300 sqm (46,285 sq ft) | Pan-European / global operations |
| Stein, Switzerland | 64,700 sqm | Sterile processing |
| Lantheus Holdings, Inc. | ||
| North Billerica, Massachusetts, US | 61,785 sq ft retained | Dedicated DEFINITY® production |
| Springfield, New Jersey, US | 13,079 sq ft (owned) | Evergreen CDMO cGMP operations |
| Decentralized PMF Network | Leased partner sites | Local F-18 synthesis |
| Telix Pharmaceuticals Limited | ||
| Brussels South (Seneffe), Belgium | 30,000 sq ft | 9 GMP lines, 2 cyclotrons |
| RLS Radiopharmacy Network | 30+ sites across 18 states | Last-mile radiolabeling |
| TMS Yokohama, Japan | Leased site | APAC Zr-89 production |
| TMS North Melbourne, Australia | Purpose-built R&D facility | APAC clinical dosing |
| TMS Sacramento, California, US | Leased R&D site | North American clinical trials |
| IsoTherapeutics (Texas, US) | Leased GMP cleanroom | Pb-212 generator R&D |
| ImaginAb (California, US) | Leased facility | Antibody discovery |
| ARTMS (Burnaby, Canada) | Leased facility | QIS target hardware |
Supply chain vulnerabilities center on upstream raw isotope sourcing:
* Russian Precursor Exposure: Non-carrier-added (n.c.a.) Lutetium-177 requires enriched Ytterbium-176 (176Yb) targets (>99% isotopic purity), which are predominantly produced by Russian state-owned centrifuge facilities (Rosatom/Tenex). While procured under medical trade exemptions, any revocation of sanctions waivers presents supply risks for Telix and Novartis. Telix explicitly discloses material raw material exposure to Russian starting target precursors.
* Research Reactor Dependencies: Carrier-added and n.c.a. Lutetium-177 irradiation relies on a limited fleet of global research reactors, including HFR Petten (Netherlands), BR2 (Belgium), Safari-1 (South Africa), and ANSTO (Australia). Unscheduled reactor maintenance shutdowns create immediate supply-chain disruptions.
* De-risking via SPECT Divestiture: Lantheus eliminated its operational reliance on nuclear research reactors on January 1, 2026, by completing the sale of its legacy Molybdenum-99 SPECT business to SHINE Technologies for $131.20 million in total consideration ($32.10 million upfront cash, a $70.00 million installment note, and $20.00 million deferred cash). The transaction derecognized $49.20 million in Billerica plant assets and transferred $17.45 million in Asset Retirement Obligations (AROs) to SHINE, lowering Lantheus's balance sheet ARO liability from $23.34 million to $138,000, backed by a $30.30 million Massachusetts surety bond.
* Vertical Supply Integration: Telix deployed $40.00 million in cumulative infrastructure capital expenditures across FY2025 and H1 2026, validating its Brussels South facility with its first GMP production run of a Lutetium-177 therapeutic candidate in H1 2026, while scaling the ARTMS QUANTM Irradiation System (QIS) across Yokohama and the RLS network to produce Gallium-68 and Zirconium-89 directly on cyclotrons.
Table THERANOSTIC PIPELINE & REGULATORY STATUS
| Target / Asset | Diagnostic | Therapeutic | Indication | Regulatory / Clinical Status |
|---|---|---|---|---|
| Novartis AG | ||||
| PSMA Platform | Locametz (⁶⁸Ga) | Pluvicto (¹⁷⁷Lu) | mCRPC / mHSPC | Approved / Phase III |
| PSMA Alpha TAT | Locametz (⁶⁸Ga) | AAA817 (²²⁵Ac) | Post-Lu mCRPC | Phase III (AcTION) |
| SSTR Platform | N/A | Lutathera (¹⁷⁷Lu) | GEP-NETs | Approved (1L / 2L) |
| Lantheus Holdings, Inc. | ||||
| PSMA Franchise | PYLARIFY / TruVu (¹⁸F) | N/A | Prostate PET | Approved / Q4 2026 Launch |
| SSTR NET | LNTH-2501 (⁶⁸Ga) | N/A | NET Imaging | CRL (June 26, 2026) |
| Generic NET | N/A | PNT2003 (¹⁷⁷Lu) | GEP-NETs | Tentative Approval |
| Tau Biomarker | MK-6240 (¹⁸F) | N/A | Alzheimer's Disease | PDUFA: August 13, 2026 |
| GRPR Pair | LNTH-2401 (⁶⁸Ga) | LNTH-2402 (¹⁷⁷Lu) | Prostate / Solid Tumors | Phase I/II; IND Q4 2025 |
| Telix Pharmaceuticals Limited | ||||
| LAT1 Platform | Pixclara (¹⁸F-FET) | TLX101-Tx (¹³¹I) | Glioma / Brain Metastases | PDUFA: September 11, 2026 |
| CAIX Platform | Zircaix (⁸⁹Zr) | TLX250-Tx (¹⁷⁷Lu) | ccRCC / Kidney Cancer | BLA Resubmission Preparation (CRL) |
| PSMA rADC | Illuccix / Gozellix | TLX591-Tx (¹⁷⁷Lu) | mCRPC | Phase III (ProstACT) |
| PSMA Alpha TAT | Illuccix (⁶⁸Ga) | TLX592-Tx (²²⁵Ac) | Prostate Cancer | Phase I (AlphaPRO) |
| FAP Platform | Diagnostic FAPi | TLX400-Tx (¹⁷⁷Lu) | Solid Tumors | Preclinical / In-licensed |
Telix Pharmaceuticals Limited's BLA for Zircaix (TLX250-Px) received a Complete Response Letter (CRL) in August 2025 regarding Chemistry, Manufacturing, and Controls (CMC) comparability protocols and Form 483 notices across two contract sites. Following Type A alignment, Telix received a corrected CRL on April 10, 2026, granting an extension to finalize comparability dossiers prior to BLA resubmission. Telix capitalized $14.10 million in Zircaix pre-launch inventory in FY2025 alongside a $16.86 million obsolescence reserve.
In the targeted alpha space, Novartis advanced AAA817 into the Phase III AcTION trial with target regulatory filings planned for 2028 and 2029+, while Lantheus recognized a -$31.76 million fair-value adjustment to contingent consideration liabilities in H1 2026 following a June 26, 2026 CRL for LNTH-2501 and the cessation of internal R&D allocations for PNT2002.
HDIN Institutional Verdict and Balance Sheet Quality Audit
A forensic evaluation of capital structures and accrual metrics highlights three distinct financial profiles across the peer group:
Table BALANCE SHEET & SOLVENCY AUDIT MATRIX (H1 2026)
| Financial & Solvency Metric | Lantheus Holdings, Inc. | Telix Pharmaceuticals Limited |
|---|---|---|
| Cash & Cash Equivalents | $593.30M | $251.91M |
| Total Borrowings / Notes | $571.46M | $600.00M |
| Net Debt / (Net Cash) | $(21.84)M | $348.09M |
| Net Debt-to-EBITDA (Annualized) | -0.05× | 2.55× |
| Current Ratio / Quick Ratio | 3.06× / 1.77× | 2.01× / 1.04× |
| Cash Interest Coverage Ratio | 18.56× | 6.25× |
| Goodwill & Intangibles (% of Total Assets) | $679.39M (28.14%) | $782.12M (57.43%) |
| Accrual Ratio (Cash-to-Assets) | -0.99% | +1.12% |
| Undrawn Committed Facilities | $750.00M (Dec. 2029) | $34.40M (HSBC) |
| Debt Maturity Profile | $575.00M (Dec. 2027) | $600.00M (Apr. 2031) |
Lantheus Holdings, Inc. presents high near-term liquidity with a 3.06x Current Ratio and negative net debt. However, its earnings quality requires scrutiny: H1 2026 net profit of $193.45 million includes an inorganic, non-operating $59.53 million gain on the SPECT business sale and a $31.76 million non-cash credit from reducing contingent acquisition liabilities. Operating cash flow of $217.33 million generated an OCF-to-Net Income ratio of 1.12x. The pending expiration of PYLARIFY's 5-year New Chemical Entity (NCE) exclusivity in May 2026 exposes the franchise to Paragraph IV ANDA filings, underpinning management's decision to enter a definitive merger agreement with Curium (announced August 3, 2026). Lantheus faces a refinancing milestone in December 2027, when its $575.00 million, 2.625% convertible notes mature, requiring cash settlement if the equity trades below the $79.81 conversion threshold.
Telix Pharmaceuticals Limited transitioned to a positive GAAP Net Profit of $38.33 million in H1 2026, though operating cash flow stood at $23.04 million (OCF-to-Net Income of 0.60x), weighed down by a $34.35 million expansion in trade receivables. In April 2026, Telix restructured its liabilities by issuing $600.00 million of 1.50% convertible notes due April 22, 2031, repurchasing 98% (A$637 million / $466.45 million) of its 2.375% 2029 notes to secure $118.43 million in net cash inflows and eliminate near-term refinancing exposure. Asset-quality concentration remains high, with goodwill and unamortized intangibles ($782.12 million) constituting 57.43% of total assets, leaving the balance sheet sensitive to clinical trial endpoints. To maintain liquidity against annualized R&D guidance of $230 million to $270 million, Telix established an At-The-Market (ATM) equity facility on the Nasdaq on August 20, 2026, following a $40.00 million non-refundable upfront payment received under its 50/50 co-development collaboration with Regeneron in April 2026.
Novartis AG operates a sovereign-grade funding profile (Aa3/AA-), maintaining $7.69 billion in total liquidity, $10.00 billion in commercial paper access, and an undrawn $6.00 billion credit line against $39.40 billion in net debt. Net Debt-to-EBITDA increased to 1.70x in H1 2026 after issuing $12.90 billion in straight debt to finance acquisitions, including Avidity Biosciences ($12.00 billion cash; $72.00/share), Pikavation Therapeutics ($1.80 billion upfront; $1.20 billion milestones), Tourmaline Bio ($1.40 billion upfront), Mariana Oncology ($1.04 billion upfront), and Myricx Bio ($1.10 billion upfront; $400.00 million milestones). With high cash conversion (1.49x OCF-to-Net Income) and Pluvicto expanding post-taxane and pre-taxane indications, Novartis maintains substantial balance sheet capacity to absorb Lutathera generic litigation while advancing its therapeutic-only theranostics pipeline.
Presentation Download & Video Access:
Presentation Download: Click the PDF download link under 'Related Topics' to access the full institutional presentation of this report.
Video Link: Click this link to watch the HDIN analyst briefing on YouTube.
About HDIN Research:
HDIN Research is a premier global market intelligence and strategic advisory firm specializing in institutional-grade financial analysis, supply chain audits, and macroeconomic forecasting. Our dedicated sector analysts deliver actionable, data-driven insights tailored for private equity, hedge funds, and corporate strategy teams. Visit us at http://www.hdinresearch.com.
2026 AI Transparency Footer:
"This intelligence report was authored by HDIN Research analysts following a rigorous audit of official corporate filings. AI was utilized for massive-scale data synthesis and structural drafting, ensuring 100% inclusion of reported data points. All strategic insights, financial modeling, and final verdicts were verified by our editorial board to ensure professional accuracy and compliance with 2026 Google Search E-E-A-T standards."