Astra Microwave Products Limited: Lead Systems Integration Pivot Expands FY26 EBITDA Margin to 29.70% Amid $253M Tejas Radar Contract
Date : 2026-09-04
Reading : 112
HDIN Executive Takeaways
1. Astra Microwave Products Limited [NSE: ASTRAMICRO / BSE: 532493] grew standalone FY26 revenue 10.67% to Rs. 1,155.67 Crore ($132.61M) while Profit After Tax rose 24.03% to Rs. 177.84 Crore ($20.41M), driven by a 531 bps gross margin expansion to 49.18%.
2. Cash flow from operations rebounded to Rs. 375.96 Crore ($43.14M), cutting standalone gearing to 0.22x as total debt dropped 31.42% to Rs. 287.05 Crore ($32.94M).
3. The post-balance sheet Rs. 2,205.23 Crore ($253.05M) Hindustan Aeronautics Limited Uttam AESA radar contract doubles order visibility across a five-year execution cycle.
Figure Astra Microwave Products Limited (AMPL): FY2025-26 Strategic Evolution to Lead Systems Integrator
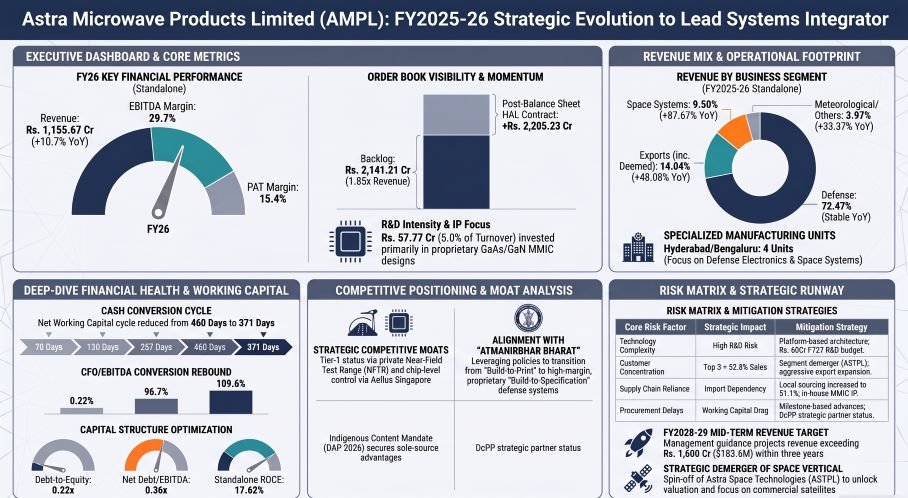 Operating Leverage and Working Capital Dynamics
Astra Microwave Products Limited's transition from a build-to-print component subcontractor to an intellectual property-driven Lead Systems Integrator (LSI) expanded profitability across standalone and consolidated operations in FY2025-26. Functional exchange rates for reporting periods are standardized at 1 USD = 87.1468 INR.
Table STANDALONE OPERATIONAL AUDIT (FY2023-24 TO FY2025-26)
Consolidated gross revenue reached Rs. 1,162.80 Crore ($133.43M) in FY26 compared to Rs. 1,051.18 Crore ($120.62M) in FY25 (+10.62%) and Rs. 908.82 Crore ($104.29M) in FY24. Consolidated gross margin expanded 584 bps to 50.92%, while consolidated EBITDA margin rose 303 bps to 30.29% and consolidated net profit margin increased 199 bps to 16.59%. Consolidated ROE and ROIC reached 15.99% (+98 bps) and 15.61% (+112 bps), respectively.
Table THREE-WAY DUPONT DECOMPOSITION (STANDALONE BALANCE SHEET AVERAGES)
Total equity expanded by Rs. 200.57 Crore, supported by a preferential warrant issuance on June 30, 2025, which issued 2,013,885 warrants at Rs. 864 per share (face value Rs. 2, premium Rs. 862) to raise Rs. 173.99 Crore ($19.96M) at 2.12% equity dilution. Cash received from warrant subscriptions in FY26 totaled Rs. 43.50 Crore (Rs. 4,349.99 Lakhs).
Total debt was reduced by Rs. 131.51 Crore, lowering gross borrowings from Rs. 418.56 Crore ($48.03M) to Rs. 287.05 Crore ($32.94M). Ending cash and cash equivalents rose from Rs. 21.29 Crore to Rs. 115.73 Crore, while total cash balances closed at Rs. 164.57 Crore. Standalone gross debt-to-EBITDA dropped from 1.57x to 0.84x, and net debt-to-EBITDA declined from 1.40x to 0.36x. The interest coverage ratio improved from 4.44x to 5.45x (+22.75%).
Cash flow from operations (CFO) shifted from negative Rs. 98.91 Crore (-$11.35M) in FY25 to positive Rs. 375.96 Crore ($43.14M) in FY26, yielding a CFO-to-EBITDA conversion ratio of 109.55% and a CFO-to-PAT matching ratio of 2.11x (compared to -0.69x in FY25).
Table WORKING CAPITAL TURNOVER CYCLE (STANDALONE)
Trade receivables decreased by Rs. 89.32 Crore in FY26. Standalone gross trade receivables closed at Rs. 708.25 Crore (Rs. 70,825.05 Lakhs / $81.27M). Expected credit loss (ECL) provisions stood at Rs. 14.82 Crore (Rs. 1,481.58 Lakhs), an aggregate provisioning rate of 2.09%, following a net addition of Rs. 5.41 Crore (Rs. 540.89 Lakhs).
Table STANDALONE TRADE RECEIVABLES AGING AND ECL MATRIX (AS OF MARCH 31, 2026)
Consolidated gross receivables totaled Rs. 709.06 Crore (Rs. 70,905.98 Lakhs / $81.36M) with ECL allowances of Rs. 14.91 Crore (Rs. 1,490.96 Lakhs), leaving net consolidated receivables at Rs. 694.15 Crore (Rs. 69,415.02 Lakhs / $79.65M). Overdue receivables exceeding two years totaled Rs. 81.58 Crore (Rs. 8,158.33 Lakhs). Under Note 39.a.ii, default probability on sovereign Defense Public Sector Undertakings (DPSUs) and state laboratory accounts is treated as negligible, limiting provision recognition to private accounts.
Total standalone inventory ended at Rs. 608.53 Crore (Rs. 60,852.99 Lakhs / $69.82M) versus Rs. 608.38 Crore in FY25, generating an inventory turnover ratio of 1.79x (1.80x in FY25). Raw materials totaled Rs. 321.77 Crore (Rs. 32,177.32 Lakhs / $36.92M, 52.88% of inventory), including goods-in-transit of Rs. 22.18 Crore (Rs. 2,217.69 Lakhs). Work-in-progress (WIP) was Rs. 286.38 Crore (Rs. 28,637.86 Lakhs / $32.86M, 47.06%), finished goods closed at Rs. 0.13 Crore (Rs. 13.41 Lakhs / $0.15M, 0.02%), and packing materials were Rs. 0.24 Crore (Rs. 24.40 Lakhs). Consolidated inventory totaled Rs. 616.35 Crore (Rs. 61,634.64 Lakhs / $70.73M), with raw materials at Rs. 329.22 Crore, WIP at Rs. 286.66 Crore, and finished goods at Rs. 0.22 Crore.
Industrial Infrastructure, Supply Chain Realignment, and Order Backlog Distribution
Astra Microwave Products Limited operates five specialized production and engineering units in Telangana and Karnataka:
* Unit 1 (Bollaram Industrial Area, Hyderabad): Advanced RF and microwave design, hybrid microcircuit prototyping.
* Unit 2 (Bollaram, Hyderabad): Surface-mount technology (SMT) automated assembly lines and subsystem testing.
* Unit 3 (Maheswaram, Hyderabad): Precision mechanical fabrication, laser hermetic welding, and module integration.
* Unit 4 (Hardware Park, Shamshabad, Hyderabad): Cleanroom assembly for strategic electronic warfare and defense payloads.
* Bengaluru Aerospace Park Facility: Systems integration and Near-Field Test Range (NFTR) for Active Electronically Scanned Array (AESA) calibration, supported by Far-Field and EMI/EMC chambers.
* EOU & E-City Units (Maheswaram): Export oriented units handling contract manufacturing.
* Aelius Semiconductors Pte. Ltd. (Singapore): Fabless semiconductor design subsidiary producing custom Gallium Arsenide (GaAs) and Gallium Nitride (GaN) Monolithic Microwave Integrated Circuits (MMICs) up to 40 GHz.
Table STANDALONE SECTOR-WISE REVENUE BREAKDOWN (FY25 VS FY26)
Under Ind AS 108 geographic segment reporting, standalone direct billing inside India totaled Rs. 1,153.19 Crore ($132.33M) versus Rs. 2.16 Crore ($0.25M) billed directly outside India. Consolidated geographic revenue comprised Rs. 1,158.73 Crore ($132.96M) domestic and Rs. 4.07 Crore ($0.47M) international.
Direct foreign currency outgo fell 37.27% in FY26 to Rs. 287.34 Crore ($32.97M) from Rs. 458.03 Crore ($52.56M) in FY25. Foreign exchange earnings were Rs. 83.85 Crore ($9.62M) compared to Rs. 109.60 Crore in FY25. Domestic Indian procurement rose from 32.27% to 51.09% of total input materials, with local Micro, Small, and Medium Enterprises (MSME) vendor sourcing climbing from 12.82% to 27.56%.
Complete systems dispatches reached 27.8% of total revenue in FY26, up from 12.01% in FY23. Deliveries included 40 indigenized Digital Instantaneous Frequency Measurement (DIFM) units, VLSRSAM X-band Rx-Exciters, Ku-band Solid-State Power Amplifiers (SSPAs), Multi-Mode Radar (MMR) exciters, and telemetry systems for SAMOOHA projects.
Table STANDALONE ORDER BACKLOG PROFILE (AS OF MARCH 31, 2026)
The order conversion cycle averages 22.2 months across the backlog: 20.4 months for defense, 20.4 months for space, 13.3 months for export offsets, and 91.6 months for meteorological contracts (following an India Meteorological Department contract exceeding Rs. 160 Crore for S-band polarimetric Doppler weather radars).
Post-balance sheet, Astra Microwave Products Limited secured a Rs. 2,205.23 Crore ($253.05M) production contract from Hindustan Aeronautics Limited to deliver 122 Active Array Antenna Units (AAAU) and 121 Interface Frames for the Tejas LCA Mk-1A Uttam AESA radar suite over a five-year deployment timeline (averaging Rs. 441 Crore annually). Management estimates the addressable medium-term pipeline across domestic radar, EW, and commercial satellite programs at Rs. 6,000 Crore to Rs. 8,000 Crore ($689M to $918M).
Audit Quality, Governance Friction, and HDIN Institutional Verdict
Statutory auditor Price Waterhouse LLP issued an unmodified audit opinion for FY2025-26, identifying the allowance for expected credit losses on trade receivables as the sole Key Audit Matter (KAM).
The Companies (Auditor's Report) Order (CARO) 2020 report disclosed structural non-compliances regarding quarterly returns of current assets filed with lending banks (including HDFC Bank) for working capital lines exceeding Rs. 5 Crore:
* Astra Microwave Products Limited did not file its quarterly current assets statement for the quarter ended March 31, 2026.
* 50:50 joint venture Astra Rafael Comsys Private Limited (ARC) reported wide variances between bank filings and unaudited books:
* June 30, 2025: Reported trade receivables of Rs. 5.19 Crore (Rs. 518.86 Lakhs) versus Rs. 29.53 Crore (Rs. 2,952.53 Lakhs) in books (unreconciled variance: -Rs. 24.34 Crore). Reported trade payables of Rs. 26.20 Crore (Rs. 2,620.34 Lakhs) versus Rs. 74.95 Crore (Rs. 7,495.28 Lakhs) in books (unreconciled variance: -Rs. 48.75 Crore).
* September 30, 2025: Reported trade payables of Rs. 56.71 Crore (Rs. 5,670.56 Lakhs) versus Rs. 77.53 Crore (Rs. 7,752.76 Lakhs) in books.
* March 31, 2026: Reported trade payables of Rs. 142.88 Crore (Rs. 14,288.48 Lakhs) versus Rs. 127.94 Crore (Rs. 12,793.53 Lakhs) in books.
Table RELATED-PARTY FLOWS AND CAPITAL COMMITMENTS
Total contingent liabilities closed at Rs. 116.85 Crore ($13.41M) on a standalone basis and Rs. 81.85 Crore ($9.39M) on a consolidated basis. Customer advances and contract liabilities rose 9.02% to Rs. 168.72 Crore ($19.36M), comprising non-current advances of Rs. 72.39 Crore ($8.31M, +37.19%), current advances of Rs. 81.58 Crore ($9.36M, -11.00%), and deferred service revenues of Rs. 14.75 Crore ($1.69M, +42.72%). Zero liquidated damages provisions were recognized on long-term contracts.
Total R&D outlay reached Rs. 57.77 Crore ($6.63M, 5.00% of revenue) in FY26 compared to Rs. 52.68 Crore (5.01%) in FY25. Recurring R&D expenses rose 39.00% to Rs. 55.74 Crore ($6.40M), while capitalized R&D declined 83.86% to Rs. 2.03 Crore ($0.23M), lowering the capitalization rate from 23.89% to 3.52%. Planned FY27 R&D is budgeted at Rs. 60.00 Crore. Additions to gross fixed assets totaled Rs. 77.00 Crore ($8.84M) in FY26 (plant and machinery additions: Rs. 59.63 Crore; software tools: Rs. 14.25 Crore). Capital Work-in-Progress (CWIP) was Rs. 9.25 Crore, all under one year of age. Cumulative depreciation reached 49.41% of gross block. Projected FY27 CapEx is Rs. 75.00 Crore ($8.61M).
Top three external clients contributed Rs. 610.52 Crore ($70.06M), representing 52.83% of standalone and 52.50% of consolidated turnover. Client concentration is anchored in the Ministry of Defence, Bharat Electronics Limited [NSE: BEL], Hindustan Aeronautics Limited [NSE: HAL], DRDO, and ISRO.
Corporate transitions include the retirement of Managing Director Mr. S. Gurunatha Reddy on September 30, 2026, with leadership consolidating under Joint Managing Director Dr. M.V. Reddy (34 years of defense sector tenure). The Board approved a severance compensation of Rs. 1.36 Crore (Rs. 1,35,68,889 / $0.156M) for Mr. Reddy, calculated as 7/12ths of his three-year average annual remuneration (Rs. 2.33 Crore). Dr. M.V. Reddy received FY26 remuneration of Rs. 3.38 Crore (+20.72%), and Whole-Time Director Mr. Atim Kabra received Rs. 1.31 Crore (+12.15%), both tied to Section 198 net profit ceilings (1% and 0.25%, respectively). Median employee salary increased 10.00% to Rs. 564,516 ($6,478), establishing a Managing Director-to-median pay ratio of 60.16:1 across 1,684 employees.
Chief Financial Officer Mr. Rahul Rungta transitioned to lead finance at Astra Space Technologies Private Limited (ASTPL), and Mr. Srinivasarao Devathi was appointed parent CFO on February 11, 2026. The demerger of Space, Meteorology, and Hydrology verticals into ASTPL aims to decouple commercial satellite integration from defense cycles, targeting the launch of an indigenously developed commercial small satellite within 24 months. Recommended final dividend is 120% (Rs. 2.40 per share, face value Rs. 2), absorbing Rs. 22.79 Crore ($2.61M) for a dividend payout ratio of 12.81%, retaining 87.19% of earnings.
Asset disposals generated Rs. 2.12 Crore ($0.24M) in cash from selling 28,486 compulsory convertible preference shares in associate Janyu Technologies Private Limited, yielding a net gain of Rs. 0.79 Crore (Rs. 78.71 Lakhs) with Rs. 0.93 Crore remaining in assets held for sale. PPE scrap realization delivered Rs. 0.49 Lakhs in net gains against gross asset write-offs of Rs. 57.42 Lakhs, while marginal investment write-offs were Rs. 1.00 Lakh.
HDIN Research concludes that Astra Microwave Products Limited has established a robust operating model, expanding EBITDA margins to 29.70% and turning working capital cash generative. However, the accumulation of Rs. 195.79 Crore in uncollected receivables from joint venture ARC—exceeding ARC's annual sales contribution—represents a significant structural cash drain. Management must resolve bank reporting discrepancies and balance joint venture capital requirements against its FY29 revenue target of Rs. 1,600 Crore ($183.60M).
Presentation Download & Video Access:
- Presentation Download: Click the PDF download link under 'Related Topics' to access the full institutional presentation of this report.
- Video Link: Click this link to watch the HDIN analyst briefing on YouTube.
About HDIN Research:
HDIN Research is a premier global market intelligence and strategic advisory firm specializing in institutional-grade financial analysis, supply chain audits, and macroeconomic forecasting. Our dedicated sector analysts deliver actionable, data-driven insights tailored for private equity, hedge funds, and corporate strategy teams. Visit us at http://www.hdinresearch.com.
2026 AI Transparency Footer:
"This intelligence report was authored by HDIN Research analysts following a rigorous audit of official corporate filings. AI was utilized for massive-scale data synthesis and structural drafting, ensuring 100% inclusion of reported data points. All strategic insights, financial modeling, and final verdicts were verified by our editorial board to ensure professional accuracy and compliance with 2026 Google Search E-E-A-T standards."
1. Astra Microwave Products Limited [NSE: ASTRAMICRO / BSE: 532493] grew standalone FY26 revenue 10.67% to Rs. 1,155.67 Crore ($132.61M) while Profit After Tax rose 24.03% to Rs. 177.84 Crore ($20.41M), driven by a 531 bps gross margin expansion to 49.18%.
2. Cash flow from operations rebounded to Rs. 375.96 Crore ($43.14M), cutting standalone gearing to 0.22x as total debt dropped 31.42% to Rs. 287.05 Crore ($32.94M).
3. The post-balance sheet Rs. 2,205.23 Crore ($253.05M) Hindustan Aeronautics Limited Uttam AESA radar contract doubles order visibility across a five-year execution cycle.
Figure Astra Microwave Products Limited (AMPL): FY2025-26 Strategic Evolution to Lead Systems Integrator
Operating Leverage and Working Capital DynamicsAstra Microwave Products Limited's transition from a build-to-print component subcontractor to an intellectual property-driven Lead Systems Integrator (LSI) expanded profitability across standalone and consolidated operations in FY2025-26. Functional exchange rates for reporting periods are standardized at 1 USD = 87.1468 INR.
Table STANDALONE OPERATIONAL AUDIT (FY2023-24 TO FY2025-26)
| Financial Metric | FY2023–24 (INR/USD) | FY2024–25 (INR/USD) | FY2025–26 (INR/USD) | YoY Variance |
|---|---|---|---|---|
| Gross Revenue | Rs. 904.00 Cr / $103.7M | Rs. 1,044.2 Cr / $119.8M | Rs. 1,155.7 Cr / $132.6M | +10.67% |
| Gross Profit | — | Rs. 458.07 Cr / $52.56M | Rs. 568.35 Cr / $65.22M | +24.08% |
| Gross Margin (%) | — | 43.87% | 49.18% | +531 bps |
| Operating EBITDA | Rs. 194.00 Cr / $22.26M | Rs. 266.43 Cr / $30.57M | Rs. 324.41 Cr / $37.23M | +21.76% |
| EBITDA Margin (%) | 21.45% | 25.47% | 29.70% | +423 bps |
| Profit After Tax (PAT) | Rs. 71.00 Cr / $8.15M | Rs. 143.39 Cr / $16.45M | Rs. 177.84 Cr / $20.41M | +24.03% |
| Net Profit Margin (%) | 7.88% | 13.73% | 15.39% | +166 bps |
| Return on Equity (ROE) | 13.93% | 13.93% | 14.94% | +101 bps |
| Return on Capital Employed (ROCE) | 15.85% | 16.53% | 17.62% | +109 bps |
| Return on Invested Capital (ROIC) | — | 14.12% | 15.01% | +89 bps |
Consolidated gross revenue reached Rs. 1,162.80 Crore ($133.43M) in FY26 compared to Rs. 1,051.18 Crore ($120.62M) in FY25 (+10.62%) and Rs. 908.82 Crore ($104.29M) in FY24. Consolidated gross margin expanded 584 bps to 50.92%, while consolidated EBITDA margin rose 303 bps to 30.29% and consolidated net profit margin increased 199 bps to 16.59%. Consolidated ROE and ROIC reached 15.99% (+98 bps) and 15.61% (+112 bps), respectively.
Table THREE-WAY DUPONT DECOMPOSITION (STANDALONE BALANCE SHEET AVERAGES)
| Component Driver | FY2024–25 Baseline | FY2025–26 Actual | Delta (bps / %) | Impact Type |
|---|---|---|---|---|
| Net Profit Margin (NPM) | 13.731% | 15.388% | +166 bps | Operational |
| Asset Turnover (ATO) | 0.570× | 0.609× | +6.84% | Efficiency |
| Equity Multiplier (EM) | 1.682× | 1.594× | -5.23% | Deleveraging |
| Computed ROE | 13.93% | 14.94% | +101 bps | Structural |
Total equity expanded by Rs. 200.57 Crore, supported by a preferential warrant issuance on June 30, 2025, which issued 2,013,885 warrants at Rs. 864 per share (face value Rs. 2, premium Rs. 862) to raise Rs. 173.99 Crore ($19.96M) at 2.12% equity dilution. Cash received from warrant subscriptions in FY26 totaled Rs. 43.50 Crore (Rs. 4,349.99 Lakhs).
Total debt was reduced by Rs. 131.51 Crore, lowering gross borrowings from Rs. 418.56 Crore ($48.03M) to Rs. 287.05 Crore ($32.94M). Ending cash and cash equivalents rose from Rs. 21.29 Crore to Rs. 115.73 Crore, while total cash balances closed at Rs. 164.57 Crore. Standalone gross debt-to-EBITDA dropped from 1.57x to 0.84x, and net debt-to-EBITDA declined from 1.40x to 0.36x. The interest coverage ratio improved from 4.44x to 5.45x (+22.75%).
Cash flow from operations (CFO) shifted from negative Rs. 98.91 Crore (-$11.35M) in FY25 to positive Rs. 375.96 Crore ($43.14M) in FY26, yielding a CFO-to-EBITDA conversion ratio of 109.55% and a CFO-to-PAT matching ratio of 2.11x (compared to -0.69x in FY25).
Table WORKING CAPITAL TURNOVER CYCLE (STANDALONE)
| Metric Parameter | FY2024–25 (Days) | FY2025–26 (Days) | Absolute Shift (Days) |
|---|---|---|---|
| Days Sales Outstanding (DSO) | 274.0 | 219.0 | -55.0 |
| Days Inventory Outstanding (DIO) | 202.8 | 203.9 | +1.1 |
| Days Payable Outstanding (DPO) | 38.0 | 72.0 | +34.0 |
| Net Working Capital (NWC) Cycle | 460.0 | 371.0 | -89.0 |
Trade receivables decreased by Rs. 89.32 Crore in FY26. Standalone gross trade receivables closed at Rs. 708.25 Crore (Rs. 70,825.05 Lakhs / $81.27M). Expected credit loss (ECL) provisions stood at Rs. 14.82 Crore (Rs. 1,481.58 Lakhs), an aggregate provisioning rate of 2.09%, following a net addition of Rs. 5.41 Crore (Rs. 540.89 Lakhs).
Table STANDALONE TRADE RECEIVABLES AGING AND ECL MATRIX (AS OF MARCH 31, 2026)
| Aging Bucket | Gross Receivables (INR Lakhs) | Value (USD) | ECL (INR Lakhs) | ECL Rate |
|---|---|---|---|---|
| Not Due | 651.06 | $0.75M | 0.00 | 0.00% |
| 0–6 Months Past Due | 49,347.75 | $56.63M | 155.38 | 0.31% |
| 6–12 Months Past Due | 6,037.31 | $6.93M | 66.77 | 1.11% |
| 1–2 Years Past Due | 6,630.60 | $7.61M | 40.33 | 0.61% |
| Above 2 Years Past Due | 8,158.33 | $9.36M | 1,219.10 | 14.94% |
| Total Gross Receivables | 70,825.05 | $81.27M | 1,481.58 | 2.09% |
Consolidated gross receivables totaled Rs. 709.06 Crore (Rs. 70,905.98 Lakhs / $81.36M) with ECL allowances of Rs. 14.91 Crore (Rs. 1,490.96 Lakhs), leaving net consolidated receivables at Rs. 694.15 Crore (Rs. 69,415.02 Lakhs / $79.65M). Overdue receivables exceeding two years totaled Rs. 81.58 Crore (Rs. 8,158.33 Lakhs). Under Note 39.a.ii, default probability on sovereign Defense Public Sector Undertakings (DPSUs) and state laboratory accounts is treated as negligible, limiting provision recognition to private accounts.
Total standalone inventory ended at Rs. 608.53 Crore (Rs. 60,852.99 Lakhs / $69.82M) versus Rs. 608.38 Crore in FY25, generating an inventory turnover ratio of 1.79x (1.80x in FY25). Raw materials totaled Rs. 321.77 Crore (Rs. 32,177.32 Lakhs / $36.92M, 52.88% of inventory), including goods-in-transit of Rs. 22.18 Crore (Rs. 2,217.69 Lakhs). Work-in-progress (WIP) was Rs. 286.38 Crore (Rs. 28,637.86 Lakhs / $32.86M, 47.06%), finished goods closed at Rs. 0.13 Crore (Rs. 13.41 Lakhs / $0.15M, 0.02%), and packing materials were Rs. 0.24 Crore (Rs. 24.40 Lakhs). Consolidated inventory totaled Rs. 616.35 Crore (Rs. 61,634.64 Lakhs / $70.73M), with raw materials at Rs. 329.22 Crore, WIP at Rs. 286.66 Crore, and finished goods at Rs. 0.22 Crore.
Industrial Infrastructure, Supply Chain Realignment, and Order Backlog Distribution
Astra Microwave Products Limited operates five specialized production and engineering units in Telangana and Karnataka:
* Unit 1 (Bollaram Industrial Area, Hyderabad): Advanced RF and microwave design, hybrid microcircuit prototyping.
* Unit 2 (Bollaram, Hyderabad): Surface-mount technology (SMT) automated assembly lines and subsystem testing.
* Unit 3 (Maheswaram, Hyderabad): Precision mechanical fabrication, laser hermetic welding, and module integration.
* Unit 4 (Hardware Park, Shamshabad, Hyderabad): Cleanroom assembly for strategic electronic warfare and defense payloads.
* Bengaluru Aerospace Park Facility: Systems integration and Near-Field Test Range (NFTR) for Active Electronically Scanned Array (AESA) calibration, supported by Far-Field and EMI/EMC chambers.
* EOU & E-City Units (Maheswaram): Export oriented units handling contract manufacturing.
* Aelius Semiconductors Pte. Ltd. (Singapore): Fabless semiconductor design subsidiary producing custom Gallium Arsenide (GaAs) and Gallium Nitride (GaN) Monolithic Microwave Integrated Circuits (MMICs) up to 40 GHz.
Table STANDALONE SECTOR-WISE REVENUE BREAKDOWN (FY25 VS FY26)
| Operating Segment | FY2025 (INR Lakhs) | FY2026 (INR Lakhs) | FY2026 (USD) | YoY Growth |
|---|---|---|---|---|
| Defense (Domestic) | 84,146.00 (80.58%) | 83,748.00 (72.47%) | $96.10M | -0.47% |
| Space Electronics | 5,848.00 (5.60%) | 10,975.00 (9.50%) | $12.59M | +87.67% |
| Exports (Direct & Deemed) | 10,959.00 (11.00%) | 16,228.00 (14.04%) | $18.62M | +48.08% |
| Meteorology & Civil | 3,437.00 (3.29%) | 4,584.00 (3.97%) | $5.26M | +33.37% |
| Other Operating Income | 33.00 (0.03%) | 32.00 (0.03%) | $0.04M | -3.03% |
| Total Standalone Turnover | 104,423.39 (100%) | 115,566.75 (100%) | $132.61M | +10.67% |
Under Ind AS 108 geographic segment reporting, standalone direct billing inside India totaled Rs. 1,153.19 Crore ($132.33M) versus Rs. 2.16 Crore ($0.25M) billed directly outside India. Consolidated geographic revenue comprised Rs. 1,158.73 Crore ($132.96M) domestic and Rs. 4.07 Crore ($0.47M) international.
Direct foreign currency outgo fell 37.27% in FY26 to Rs. 287.34 Crore ($32.97M) from Rs. 458.03 Crore ($52.56M) in FY25. Foreign exchange earnings were Rs. 83.85 Crore ($9.62M) compared to Rs. 109.60 Crore in FY25. Domestic Indian procurement rose from 32.27% to 51.09% of total input materials, with local Micro, Small, and Medium Enterprises (MSME) vendor sourcing climbing from 12.82% to 27.56%.
Complete systems dispatches reached 27.8% of total revenue in FY26, up from 12.01% in FY23. Deliveries included 40 indigenized Digital Instantaneous Frequency Measurement (DIFM) units, VLSRSAM X-band Rx-Exciters, Ku-band Solid-State Power Amplifiers (SSPAs), Multi-Mode Radar (MMR) exciters, and telemetry systems for SAMOOHA projects.
Table STANDALONE ORDER BACKLOG PROFILE (AS OF MARCH 31, 2026)
| Sector Category | Backlog (INR Cr) | Backlog (USD) | Backlog Share | Book-to-Bill |
|---|---|---|---|---|
| Defense & Public Sector | Rs. 1,424.76 Cr | $163.49M | 66.54% | 1.70× |
| Space Systems | Rs. 187.06 Cr | $21.46M | 8.74% | 1.70× |
| Meteorology & Hydrology | Rs. 350.05 Cr | $40.17M | 16.35% | 7.64× |
| Defense Exports (Offsets) | Rs. 179.34 Cr | $20.58M | 8.38% | 1.11× |
| Total Standalone Backlog | Rs. 2,141.21 Cr | $245.70M | 100.00% | 1.85× |
The order conversion cycle averages 22.2 months across the backlog: 20.4 months for defense, 20.4 months for space, 13.3 months for export offsets, and 91.6 months for meteorological contracts (following an India Meteorological Department contract exceeding Rs. 160 Crore for S-band polarimetric Doppler weather radars).
Post-balance sheet, Astra Microwave Products Limited secured a Rs. 2,205.23 Crore ($253.05M) production contract from Hindustan Aeronautics Limited to deliver 122 Active Array Antenna Units (AAAU) and 121 Interface Frames for the Tejas LCA Mk-1A Uttam AESA radar suite over a five-year deployment timeline (averaging Rs. 441 Crore annually). Management estimates the addressable medium-term pipeline across domestic radar, EW, and commercial satellite programs at Rs. 6,000 Crore to Rs. 8,000 Crore ($689M to $918M).
Audit Quality, Governance Friction, and HDIN Institutional Verdict
Statutory auditor Price Waterhouse LLP issued an unmodified audit opinion for FY2025-26, identifying the allowance for expected credit losses on trade receivables as the sole Key Audit Matter (KAM).
The Companies (Auditor's Report) Order (CARO) 2020 report disclosed structural non-compliances regarding quarterly returns of current assets filed with lending banks (including HDFC Bank) for working capital lines exceeding Rs. 5 Crore:
* Astra Microwave Products Limited did not file its quarterly current assets statement for the quarter ended March 31, 2026.
* 50:50 joint venture Astra Rafael Comsys Private Limited (ARC) reported wide variances between bank filings and unaudited books:
* June 30, 2025: Reported trade receivables of Rs. 5.19 Crore (Rs. 518.86 Lakhs) versus Rs. 29.53 Crore (Rs. 2,952.53 Lakhs) in books (unreconciled variance: -Rs. 24.34 Crore). Reported trade payables of Rs. 26.20 Crore (Rs. 2,620.34 Lakhs) versus Rs. 74.95 Crore (Rs. 7,495.28 Lakhs) in books (unreconciled variance: -Rs. 48.75 Crore).
* September 30, 2025: Reported trade payables of Rs. 56.71 Crore (Rs. 5,670.56 Lakhs) versus Rs. 77.53 Crore (Rs. 7,752.76 Lakhs) in books.
* March 31, 2026: Reported trade payables of Rs. 142.88 Crore (Rs. 14,288.48 Lakhs) versus Rs. 127.94 Crore (Rs. 12,793.53 Lakhs) in books.
Table RELATED-PARTY FLOWS AND CAPITAL COMMITMENTS
| Exposure Category | Amount (INR) | Value (USD) | Underlying Status |
|---|---|---|---|
| Sales to ARC JV (FY2026) | Rs. 160.10 Cr | $18.37M | +115.8% YoY |
| Trade Receivables Due from ARC | Rs. 195.79 Cr | $22.47M | 122.3% of annual sales |
| Corporate Guarantee for ARC | Rs. 80.00 Cr | $9.18M | Bank credit backing |
| Corporate Guarantee for ADTL | Rs. 35.00 Cr | $4.02M | Subsidiary debt support |
| Capital Expenditure Commitments | Rs. 44.46 Cr | $5.10M | Up from Rs. 1.55 Cr |
| Disputed Income Tax (NFAC Delhi) | Rs. 0.92 Cr | $0.11M | Penalty claim (FY2018) |
| Disputed GST (Joint Commissioner) | Rs. 0.93 Cr | $0.11M | Paid under protest: Rs. 9.3 lakh |
Total contingent liabilities closed at Rs. 116.85 Crore ($13.41M) on a standalone basis and Rs. 81.85 Crore ($9.39M) on a consolidated basis. Customer advances and contract liabilities rose 9.02% to Rs. 168.72 Crore ($19.36M), comprising non-current advances of Rs. 72.39 Crore ($8.31M, +37.19%), current advances of Rs. 81.58 Crore ($9.36M, -11.00%), and deferred service revenues of Rs. 14.75 Crore ($1.69M, +42.72%). Zero liquidated damages provisions were recognized on long-term contracts.
Total R&D outlay reached Rs. 57.77 Crore ($6.63M, 5.00% of revenue) in FY26 compared to Rs. 52.68 Crore (5.01%) in FY25. Recurring R&D expenses rose 39.00% to Rs. 55.74 Crore ($6.40M), while capitalized R&D declined 83.86% to Rs. 2.03 Crore ($0.23M), lowering the capitalization rate from 23.89% to 3.52%. Planned FY27 R&D is budgeted at Rs. 60.00 Crore. Additions to gross fixed assets totaled Rs. 77.00 Crore ($8.84M) in FY26 (plant and machinery additions: Rs. 59.63 Crore; software tools: Rs. 14.25 Crore). Capital Work-in-Progress (CWIP) was Rs. 9.25 Crore, all under one year of age. Cumulative depreciation reached 49.41% of gross block. Projected FY27 CapEx is Rs. 75.00 Crore ($8.61M).
Top three external clients contributed Rs. 610.52 Crore ($70.06M), representing 52.83% of standalone and 52.50% of consolidated turnover. Client concentration is anchored in the Ministry of Defence, Bharat Electronics Limited [NSE: BEL], Hindustan Aeronautics Limited [NSE: HAL], DRDO, and ISRO.
Corporate transitions include the retirement of Managing Director Mr. S. Gurunatha Reddy on September 30, 2026, with leadership consolidating under Joint Managing Director Dr. M.V. Reddy (34 years of defense sector tenure). The Board approved a severance compensation of Rs. 1.36 Crore (Rs. 1,35,68,889 / $0.156M) for Mr. Reddy, calculated as 7/12ths of his three-year average annual remuneration (Rs. 2.33 Crore). Dr. M.V. Reddy received FY26 remuneration of Rs. 3.38 Crore (+20.72%), and Whole-Time Director Mr. Atim Kabra received Rs. 1.31 Crore (+12.15%), both tied to Section 198 net profit ceilings (1% and 0.25%, respectively). Median employee salary increased 10.00% to Rs. 564,516 ($6,478), establishing a Managing Director-to-median pay ratio of 60.16:1 across 1,684 employees.
Chief Financial Officer Mr. Rahul Rungta transitioned to lead finance at Astra Space Technologies Private Limited (ASTPL), and Mr. Srinivasarao Devathi was appointed parent CFO on February 11, 2026. The demerger of Space, Meteorology, and Hydrology verticals into ASTPL aims to decouple commercial satellite integration from defense cycles, targeting the launch of an indigenously developed commercial small satellite within 24 months. Recommended final dividend is 120% (Rs. 2.40 per share, face value Rs. 2), absorbing Rs. 22.79 Crore ($2.61M) for a dividend payout ratio of 12.81%, retaining 87.19% of earnings.
Asset disposals generated Rs. 2.12 Crore ($0.24M) in cash from selling 28,486 compulsory convertible preference shares in associate Janyu Technologies Private Limited, yielding a net gain of Rs. 0.79 Crore (Rs. 78.71 Lakhs) with Rs. 0.93 Crore remaining in assets held for sale. PPE scrap realization delivered Rs. 0.49 Lakhs in net gains against gross asset write-offs of Rs. 57.42 Lakhs, while marginal investment write-offs were Rs. 1.00 Lakh.
HDIN Research concludes that Astra Microwave Products Limited has established a robust operating model, expanding EBITDA margins to 29.70% and turning working capital cash generative. However, the accumulation of Rs. 195.79 Crore in uncollected receivables from joint venture ARC—exceeding ARC's annual sales contribution—represents a significant structural cash drain. Management must resolve bank reporting discrepancies and balance joint venture capital requirements against its FY29 revenue target of Rs. 1,600 Crore ($183.60M).
Presentation Download & Video Access:
- Presentation Download: Click the PDF download link under 'Related Topics' to access the full institutional presentation of this report.
- Video Link: Click this link to watch the HDIN analyst briefing on YouTube.
About HDIN Research:
HDIN Research is a premier global market intelligence and strategic advisory firm specializing in institutional-grade financial analysis, supply chain audits, and macroeconomic forecasting. Our dedicated sector analysts deliver actionable, data-driven insights tailored for private equity, hedge funds, and corporate strategy teams. Visit us at http://www.hdinresearch.com.
2026 AI Transparency Footer:
"This intelligence report was authored by HDIN Research analysts following a rigorous audit of official corporate filings. AI was utilized for massive-scale data synthesis and structural drafting, ensuring 100% inclusion of reported data points. All strategic insights, financial modeling, and final verdicts were verified by our editorial board to ensure professional accuracy and compliance with 2026 Google Search E-E-A-T standards."